
Exploring Bot Pervasiveness in Global Cities using Publicly Available
Volunteered Geographic Information
Samuel Lee Toepke
Private Engineering Firm, Washington DC, U.S.A.
Keywords:
Data Acquisition, Geographic Information Systems, Bot Detection, Volunteered Geographic Information,
Knowledge Extraction, Trustworthiness, Translation.
Abstract:
Effective crisis management and response heavily relies on up-to-date and trustworthy information. Near real-
time, volunteered geographic information (VGI) has previously been shown to be instrumental during disaster
response by helping direct resources, create communication channels between the affected, etc. Trustworthi-
ness continues to be a challenge when leveraging crowd sourced data, as quality information directly impacts
the effectiveness of response. Previous research has demonstrated cloud-based VGI collection, storage, pre-
sentation, and bot mitigation using open source technologies and freely available web services. Alas, the
technology was deployed as a prototype for small urban areas in the United States. This research explores
bot pervasiveness in several global cities that have previously suffered a catastrophic event and/or are at risk
for a future crisis event. The existence of non-trustworthy information in social media data has always been
a known issue, taking steps to quantify the presence of bots in Twitter data can allow an end-user to more
holistically understand their dataset.
1 INTRODUCTION
As human-caused global warming and worldwide
socio-political tensions continue to increase, human-
itarian and weather-related emergencies dominate
world news headlines; examples include California
(CA) rebuilding after the devastating Woolsey and
Camp Fires, Puerto Rico (PR) continuing to repair in-
frastructure that was damaged during the 2017 hur-
ricane season, and a migrant caravan stalling at the
Mexican border with the goal of attaining asylum in
the United States (US). While each of these scenar-
ios are unique, they all exhibit some or all parts of
the emergency response timeline: situational analysis,
initial/ongoing response, and reconstruction (Jennex,
2007).
The rapid growth in functionality/connectivity
of modern consumer products has greatly enhanced
communication at all stages of the response time-
line. Social media services, combined with Internet-
connected smart phones, are especially powerful tools
that enable emergency communication as well as ad-
hoc communities to develop. Social media users can
generate volunteered geographic information (VGI)
(Aubrecht et al., 2017) which leverages a device’s on-
board positioning suite to annotate the data with lo-
cation information. Device/user location can be as-
certained through a global positioning system sen-
sor, Wi-Fi networks, Bluetooth, cellular networks, or
through a combination of the technologies.
The generated VGI can then be integrated into ex-
isting geographic information sytems (GIS) to sup-
plement situational awareness (Sui and Goodchild,
2011). From desktop thick clients like ESRI’s ArcGIS
to web based clients like the Google Maps JavaScript
Application Programming Interface (API), the data
can be easily displayed with existing maps and layers,
and updated as necessary during a developing event.
While this work focuses on developing crisis situa-
tions, GIS tools and volunteered data are also useful
in routine work such as urban planning (Spivey and
Valappil, 2018) and risk assessment (Antoniou et al.,
2017).
One of the largest challenges of using VGI, for any
purpose, is trustworthiness (Moturu and Liu, 2011).
The data is not guaranteed to be authored by a hu-
man, nor is human-generated information always per-
tinent to the specific situation at hand. Adjudica-
tion of VGI is a temporally/computationally expen-
sive process but is vital when coordinating disaster
response. Misdirection of supplies or spreading fake
narratives can hamper rescue efforts and put lives at
Toepke, S.
Exploring Bot Pervasiveness in Global Cities using Publicly Available Volunteered Geographic Information.
DOI: 10.5220/0007796701430153
In Proceedings of the 5th International Conference on Geographical Information Systems Theory, Applications and Management (GISTAM 2019), pages 143-153
ISBN: 978-989-758-371-1
Copyright
c
2019 by SCITEPRESS – Science and Technology Publications, Lda. All rights reserved
143

risk.
The following sections explore the fusion of open
source technologies and openly available web ser-
vices to improve the trustworthiness of streaming so-
cial media data. Findings will show a quantification
of bot pervasiveness in Twitter data from selected
global cities, for the exploration time-period, using
the selected bot-detection algorithm.
2 BACKGROUND
The US Global Change Research Program is man-
dated by The Global Change Research Act of 1990
to deliver climate assessment reports to Congress and
the President at least every four years (Reidmiller and
(eds.), 2018). The Fourth National Climate Assess-
ment was released in late 2018, and contains alarm-
ing results in the areas of coastal effects, energy sup-
ply/delivery/demand, air quality, and the health of
tribes/indigenous peoples. To broadly summarize the
extensive report: global warming is human-caused
and the worldwide population has severe challenges
ahead. While mitigation/prevention are critical, the
planet is already responding with a greater number
of fires, hurricanes, and coastal inundations than in
previous years (Emanuel, 2011). Compounding these
challenges are global socio-political crises that put
many at risk of death, displacement, and/or having in-
adequate food/shelter/resources.
While prevention of these scenarios is ideal, it is
not always possible, and crisis mitigation is required.
To increase response success, the emergency manage-
ment community continues to integrate modern tech-
nology into its capability suite. Two major technolo-
gies, smart phones and social media services, have
created a myriad of opportunities to reach those in
need.
Modern smart phones are inexpensive, readily ac-
cessible to the general population and are richly out-
fitted with large screens, powerful cameras, and wire-
less connectivity. They are lightweight, portable,
readily interoperate with different Internet sources
and can have custom applications installed. For a
person in a disaster situation, the smartphone can be
a lifeline and function as a sensor (Avvenuti et al.,
2016) for social media communities.
Social media services, e.g. Twitter, Instagram,
Facebook, and WhatsApp, can be utilized via web
browsers or through applications installed on the
ubiquitous smart phone. Generated VGI can include
text-based messages through Tweets, ad-hoc commu-
nities offering local support on Facebook, to geospa-
tially tagged Instagram photos, etc.
The combination of smartphones and social media
services has already been leveraged to great success in
recent years for crisis response. The Twitter API has
been used as a real-time sensor to detect earthquakes
in Japan, and using a spatiotemporal algorithm, deter-
mine their centers/trajectories (Sakaki et al., 2010).
Facebook network analysis has shown how groups
of entities emerge/communicate in emergency situ-
ations, namely during the 2016 flood in Louisiana,
US (Kim and Hastak, 2018). Twitter has also been
used to estimate structure damage during a hurricane
by analyzing the drop in steady-state Twitter traf-
fic; this deceleration creates ‘data shadows’ (Shelton
et al., 2014) and is indicative of areas of high damage
(Samuels et al., 2018).
Determining trustworthiness/pertinence of a
Tweet, and/or the account from which it was gen-
erated, is a complicated task. To enable informed
decision making for emergency managers/responders,
Tweets must contain salient information, and be gen-
erated by a human. Tweet adjudication has been
explored in different ways including using convo-
lutional neural networks to inspect Tweet content
(Caragea et al., 2016), investigating a cross-platform
believability framework (Reuter, 2017), by per-
forming topic summarization (O’Connor et al.,
2010), mapping perceived emotions to useful-
ness/trustworthiness (Halse, 2016), and inspecting
interconnected network patterns of Twitter users
(Stephens and Poorthuis, 2015).
Using a combination of heuristics, researchers
at the Observatory on Social Media, a collabora-
tion between the Indiana University Network Sci-
ence Institute and the Center for Complex Networks
and Research Systems (Davis et al., 2016) have cre-
ated an algorithm called Botometer that can esti-
mate how bot-like or human-like Twitter accounts ap-
pear. Numerous characteristics are used for the ad-
judication including: user-related metadata, consider-
ation of connected friends, the content/sentiment of
the Tweets, network considerations and Tweet-timing
(Varol et al., 2017). To attain the bot adjudication, a
user’s last 200 Tweets, last 100 mentions and built-
out user data are required. Botometer is accessible
as a microservice from Mashape (Botometer, 2018a);
the online platform handles security, billing, failover
and elasticity. An end-user can create a request to
the Botometer service using their programming lan-
guage of choice and send pertinent information for
an account in JavaScript Object Notation (JSON) for-
mat. The service will return a JSON response with all
pertinent bot information, allowing the researcher to
focus on their use case, and not have to consider the
implementation of the underlying service.
GISTAM 2019 - 5th International Conference on Geographical Information Systems Theory, Applications and Management
144

The Botometer response includes float values for
the different aspects of consideration and overarching
combined values. The values used in this work are
the:
• Bot score, created from combining con-
tent/friend/etc. scores and ranging from [0.0] to
[5.0]. The lower score indicates that an account
exhibits fewer bot-like attributes, a higher score
is more indicative that the account is automated.
There are two bot scores returned, one utilizes
the English language, and all aspects of bot
consideration; the other is universal and does not
consider content/sentiment values.
• Complete automation probability (CAP) value,
one of Botometer’s newer features; Bayes’ theo-
rem is used to generate an overarching percent-
age probability that an account is completely au-
tomated; like the bot scores, an English and uni-
versal version of the value is generated (Botome-
ter, 2018b). Both scores are on a linear scale, and
there are no delineated sub-categories.
Once these values are retrieved and annotated to
each Tweet, the dataset can be filtered based on the
different bot levels. By setting a cut-off threshold
based on the scores, any query, map layer, generated
data, etc. can be affected to only use human gener-
ated Tweets. The increased human-ness of the result-
ing data can increase confidence for the end-user that
the data will be useful and pertinent.
Previous work in cloud-based VGI collection with
bot mitigation (Toepke, 2018a) has leveraged hand-
picked cities, mainly on the west coast of the US. The
cities are urban, have a high population density, and
contain inhabitants that heavily utilize social media
services. While useful for initial research, it is nec-
essary to explore larger global cities, to exercise true
utility of the software stack. Six new cities were se-
lected, for the following reasons:
• Each of the cities rate highly according to the
Globalization and World Cities Research Net-
work, which provides city rankings focusing on
the amount of integration to the world economy
that each city maintains (GaWC, 2017) (Beaver-
stock et al., 1999). While all the cities are histor-
ically/culturally/politically significant, any large
disruption in these cities will have global eco-
nomic impact; thus, this metric is sufficient for
this work. Four of the cities rate at the ‘Alpha’
level, and two rate at the ‘Beta’ level; which
are relational classifications, ‘Alpha’ indicating
higher than ‘Beta’.
• Each city has recently experienced a crisis, and/or
is at high risk of a future disaster.
• The investigation area for each city-space is much
larger than in previous work, which focused on
only the downtown cores of each city. In the
case of San Diego, CA, the exploration area was
only 3.61845 kmˆ2. The current areas of interest
are also of differing population densities; ranging
from empty (water/wilderness), to highly popu-
lated urban centers.
• Being global cities, social media services will re-
ceive Tweets in varying languages. Exploring
how the software stack can process/display that
data to end-users allows for deeper insight into
pertinent information.
Metrics for each city can be found in Table 1,
and a sample overlay map of the investigation area
for Tokyo can be found in Figure 1; the other cities
have similar rectangular investigation areas of vary-
ing sizes.
Figure 1: Area of Investigation for Tokyo, Japan.
The cities are as follows:
• Houston, Texas, US. In 2017, Hurricane Har-
vey stalled over the Houston metropolitan area
in late summer. The unprecedented amount of
precipitation from the Category 4 hurricane dam-
aged/destroyed over 200,000 structures at an esti-
mated cost of over $125 billion (NOAA, 2018).
Without immense infrastructure changes, Hous-
ton will continue to be vulnerable to mass-
precipitation events.
• Lisbon, Portugal Metropolitan Area (LMA). Due
to its seaside location, the LMA is at risk of
a tsunami, similar to the 1755 6-meter inunda-
tion which caused a large loss of life (Freire and
Aubrecht, 2011). Rapid population growth also
introduces the risk of many buildings not being
constructed to safe seismic standards (Costa et al.,
2008).
• Paris,
ˆ
Ile-de-France, France. Increased worldwide
tensions resulted in two separate terrorist attacks
Exploring Bot Pervasiveness in Global Cities using Publicly Available Volunteered Geographic Information
145
occurring in 2015; which left hundreds of peo-
ple dead, and many more grievously injured. So-
cial media was critical for communications sup-
port immediately during/after the November at-
tack (Petersen, 2018), and will continue to be in-
strumental in future crisis management plans.
• San Francisco, California, US. The nearby Hay-
ward and San Andreas faults threaten the city with
large earthquakes, the most recent being the Loma
Prieta earthquake in 1989. The disaster caused
62 deaths, 3,757 injuries, and left thousands of
people homeless (Nolen-Hoeksema and Morrow,
1991). San Francisco is also at risk of a tsunami
caused by a large earthquake from the Cascadia
subduction zone (Workgroup, 2013), which will
affect water-adjacent neighborhoods.
• San Juan, PR. The island was battered sequen-
tially by Hurricanes Irma and Maria in 2017; with
the national power grid being mostly destroyed
during Hurricane Maria, exacerbating the destruc-
tion to lives, homes, infrastructure and economy
(Gallucci, 2018). The compounding challenges
on the island continue to make the island vulnera-
ble to future weather events (Purohit, 2018).
• Tokyo, Kanto, Japan. The densely populated area
is situated on the western end of the Pacific Ring
of Fire, an area of high seismic and volcanic activ-
ity, and is at high risk of being affected by earth-
quakes and tsunamis.
Table 1: Cities of Interest.
City GaWC Rating Area, kmˆ2
Houston, US Beta+ 1811.97
Lisbon, Portugal Alpha- 693.96
Paris, France Alpha+ 114.82
San Francisco, US Alpha- 151.29
San Juan, PR Beta- 534.69
Tokyo, Japan Alpha+ 7501.44
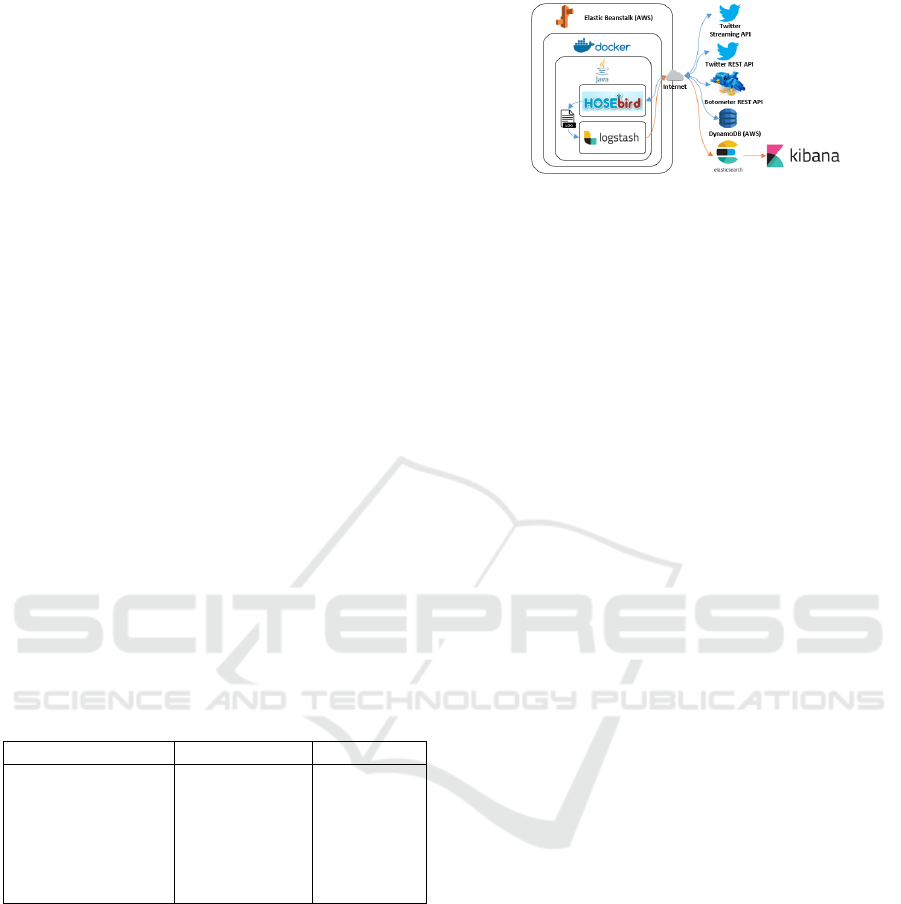
3 ARCHITECTURE
The social media service of choice for this work,
Twitter, publishes a public API that is accessible via
web services. The data is freely available for non-
commercial use and is accessible via any compatible
programming language.
A custom software solution was created using
openly available libraries, web services and technolo-
gies. While the stack is fully discussed in previous
work (Toepke, 2018a), the following is an overview
of critical components, which can be seen in Figure
2.
Figure 2: Architecture Diagram (Toepke, 2018a).
• Java is the primary programming language that af-
fects all Tweet-consumption, and Hosebird Client
(Hosebird, 2014), is an open source library that
manages the connection to the Twitter Streaming
API.
• Amazon Web Services (AWS) provides a high-
uptime execution environment via the Elastic
Beanstalk service and a Docker container.
• The Elastic Cloud provides the ELK stack via a
software-as-a-service model, which is comprised
of Logstash, Elasticsearch and Kibana. These
technologies implement the transport, index-
ing/searching and visualization of Twitter data, re-
spectively. Information overload is a critical prob-
lem when processing a high volume of social me-
dia data (Hiltz, 2013), and the ELK stack helps
to provide a responsive and stable interface to the
end-user.
• The Botometer web service takes into considera-
tion key aspects of a Twitter user’s account, time-
line and mentions, processes them via machine
learning algorithms, and generates information in-
dicating how bot-like an account appears.
The consumer code is deployed via AWS, which col-
lects the streaming Twitter data from specific geospa-
tial boundary boxes, gathers/inserts bot data for each
Tweet, then ships each annotated Tweet to the Elastic-
search instance. The end-user can then use Kibana’s
web interface to explore the underlying Elasticsearch
data via dynamic queries, maps, and/or visualizations.
One of the benefits of the consumer code is the
modularity in which new investigation areas can be
added, or existing ones can be expanded. In the
Java Tweet-consumer code, the latitudes/longitudes
are stored in a configuration file; with a small code
change, a new package can be rapidly redeployed to
production. Using Elastic Beanstalk also provides
seamless flexibility in choosing the size of the under-
lying compute infrastructure. In this case, a t2.small
instance, which includes 1 virtual processor and 2 gi-
gabytes of memory is adequate for the expected vol-
ume of Twitter data. If the investigator needed to ex-
pand areas, or expected a massive amount of Tweet
GISTAM 2019 - 5th International Conference on Geographical Information Systems Theory, Applications and Management
146

volume, they could easily choose a configuration with
more adequate specifications.
Similarly, the Elastic Cloud provides Elastic-
search/Kibana as a service, which abstracts the infras-
tructure layer. The implementor can decide between
different levels of performance/cost, and the under-
lying instances will resize in-flight, simplifying ad-
ministration, so the user can focus on the data. For
this investigation, an aws.data.highio.i3 instance with
4 gigabytes of memory and 120 gigabytes of storage
is adequate for the frequency/volume of Tweets.
While the architecture described is designed to
process in-flight Twitter data, Botometer can certainly
be used on static data sets. Annotating previously
collected Twitter data to include bot information can
greatly increase confidence for urban planning, his-
torical event analysis, land-use tracking, etc.
To affect near real-time translation, the Google
Translation API is utilized. It provides quality transla-
tions to/from many world languages (Google, 2018),
and has shown previous utility in the exploration
of social media for the purpose of bot detection
(Hegelich and Janetzko, 2016). The service is avail-
able via a web API and is functionally a programmat-
ically accessible version of the popular Google Trans-
late website. Due to cost, $20 per 1,000,000 charac-
ters, this functionality is utilized for only a few hours;
and is enabled/disabled via the Twitter data consumer
source code.
4 RESULTS/DISCUSSION
For the six cities, the collection code was run for
slightly over eight weeks, which will provide a min-
imum adequate amount of data for the purpose of
this investigation (Toepke, 2018b). The Tweets
were collected between September 1, 2018 (2018-
09-01T00:00:00.000Z) and October 27, 2018 (2018-
10-27T23:59:59.999Z); and all upcoming results are
generated from the perspective of an end-user exe-
cuting the dynamic queries using the Kibana web in-
terface. The total number of geospatially annotated
Tweets collected for the cities over that time period
was 1,394,851 and can be visualized by city in Table
2.
Table 2 also displays the average Tweet density
for each city, over the investigation areas. It can be
seen that Paris and San Francisco have a very high
Tweet density; as both investigation spaces encom-
pass smaller areas and are of a dense urban compo-
sition. The densities for Tokyo and Lisbon are af-
fected by the considerable presence of water cover,
careful selection using polygon spaces would allow
Table 2: Tweet Count and Density for the Six Cities,
September 1, 2018 to October 27, 2018.
City Total Count Tweets/kmˆ2
Houston, US 91,156 50.31
Lisbon, Portugal 24,307 35.03
Paris, France 87,679 763.62
San Francisco, US 87,360 577.43
San Juan, PR 32,682 61.12
Tokyo, Japan 1,071,667 142.86
exclusion of uninhabited areas. The density values
are not directly pertinent to bot pervasiveness but pro-
vide value in understanding each investigation space.
The raw count for Tokyo is approximately an order of
magnitude larger than that of the rest of the cities, as
the investigation area is markedly larger.
Approximately 20-30% of the Tweets do not have
populated Botometer data; which can be because
of rate limiting for the Twitter representational state
transfer (REST) API, the user having their privacy
such that their profile data cannot be accessed via the
REST API, etc. It is of note that San Juan has a sub-
stantially larger number of null Botometer values, al-
most twice as many as the rest of the cities. Cursory
inspection of Tweets shows no immediate reason for
this disparity, and future investigation of this imbal-
ance is of interest.
Figure 3 shows normalized Botometer score
counts for each of the six cities. Normalization is
achieved by dividing the count of each category of
Botometer score by the total sum of Tweets for that
city; this normalization allows for trend comparison
despite differences in total count for each city. Bot-
english values are utilized for Houston and San Fran-
cisco, while bot-universal values are used for the other
four cities, which do not consider content/sentiment
of the Tweet text, as they are not in the English lan-
guage.
It can be seen that all the cities contain a non-
negligible number of Tweets that are indicated to be
from accounts with bot-like characteristics. It is also
of note that the cities where the bot-universal values
are used show a substantial percentage of Tweets that
are not bot-like, much more so that the cities that
leverage the bot-english values. This may be indica-
tive that there are less bots targeting non-US cities,
though the results might also indicate that the actual
content/sentiment of Tweets are critical for a precise
bot estimation. The Botometer algorithm may be con-
servative on assigning high bot scores to a Twitter ac-
count without considering the actual Tweet text. In-
deed, creating the same graph for Houston and San
Francisco using the corresponding bot-universal val-
ues shows the lowest bot scores (0.0 - 1.0) growing for
Exploring Bot Pervasiveness in Global Cities using Publicly Available Volunteered Geographic Information
147
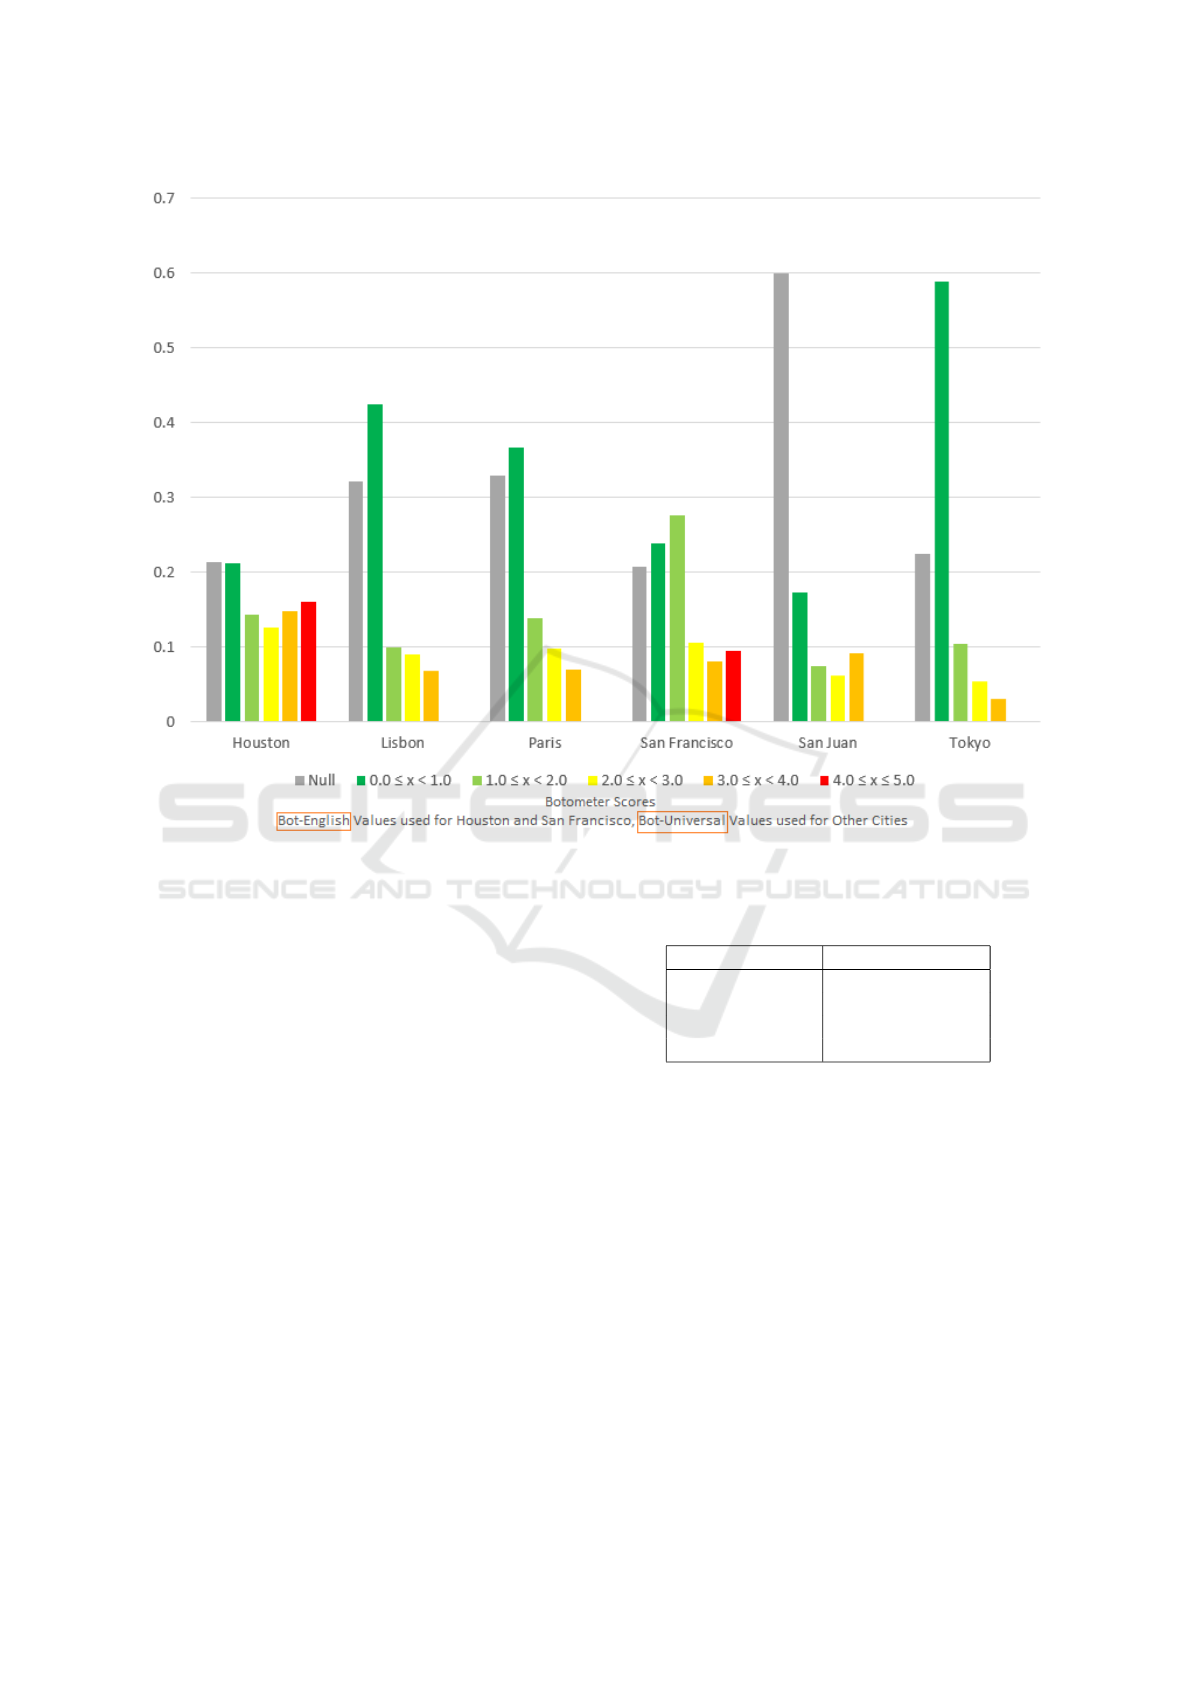
Figure 3: Normalized Botometer Score Counts for Tweets in the Six Cities, September 1, 2018 to October 27, 2018.
both cities, and the highest bot scores (4.0 - 5.0) being
reduced/absorbed amongst the other values such that
the results are more in-line with results from the other
four cities. These bot-universal results are visualized
in Figure 4.
For the four non-US cities, if they have a high
enough density of English tweets, it may be beneficial
to simply utilize the bot-english values. The percent-
age of English Tweets can be visualized in Table 3 and
range from 2.96% in Tokyo to 45.99% in San Juan.
Figure 4 also shows the normalized Botometer score
counts for the non-US cities, using bot-english values.
All cities show an increase in the (4.0 - 5.0) category,
with Lisbon showing a substantial increase, and San
Juan showing a massive increase. Using bot-english
results in international cities may be adequate for a
developing emergency response situation, but this ap-
proach disregards the local population and would not
provide true introspection for ongoing use.
A more comprehensive solution would in-
clude real-time translation of each Tweet’s
text/location/hashtags, where applicable, to the
local language of the end-user. As a proof-of-
concept, translation functionality was implemented
Table 3: Percentage of English Tweets for non-US Cities,
2018-09-01 to 2018-10-27.
City % English Tweets
Lisbon, Portugal 26.35
Paris, France 29.16
San Juan, PR 45.99
Tokyo, Japan 2.96
using the Google Translate API, a web-based trans-
lation service. The functionality was enabled for
a short period and translated Japanese characters
to English for the Tokyo investigation zone and
functioned without issue. While used for in-flight
data during this investigation, the Google Translate
API can also be used to annotate existing historic
social media datasets.
Figures 5 and 6 show the results for normalized
CAP values across the cities. Figure 5 uses CAP-
english values for Houston and San Francisco while
using CAP-universal results for the rest of the cities;
Figure 6 utilizes the opposite languages for each city.
Results show an overwhelming percentage of all re-
sults showing a low probability of totally non-human
GISTAM 2019 - 5th International Conference on Geographical Information Systems Theory, Applications and Management
148
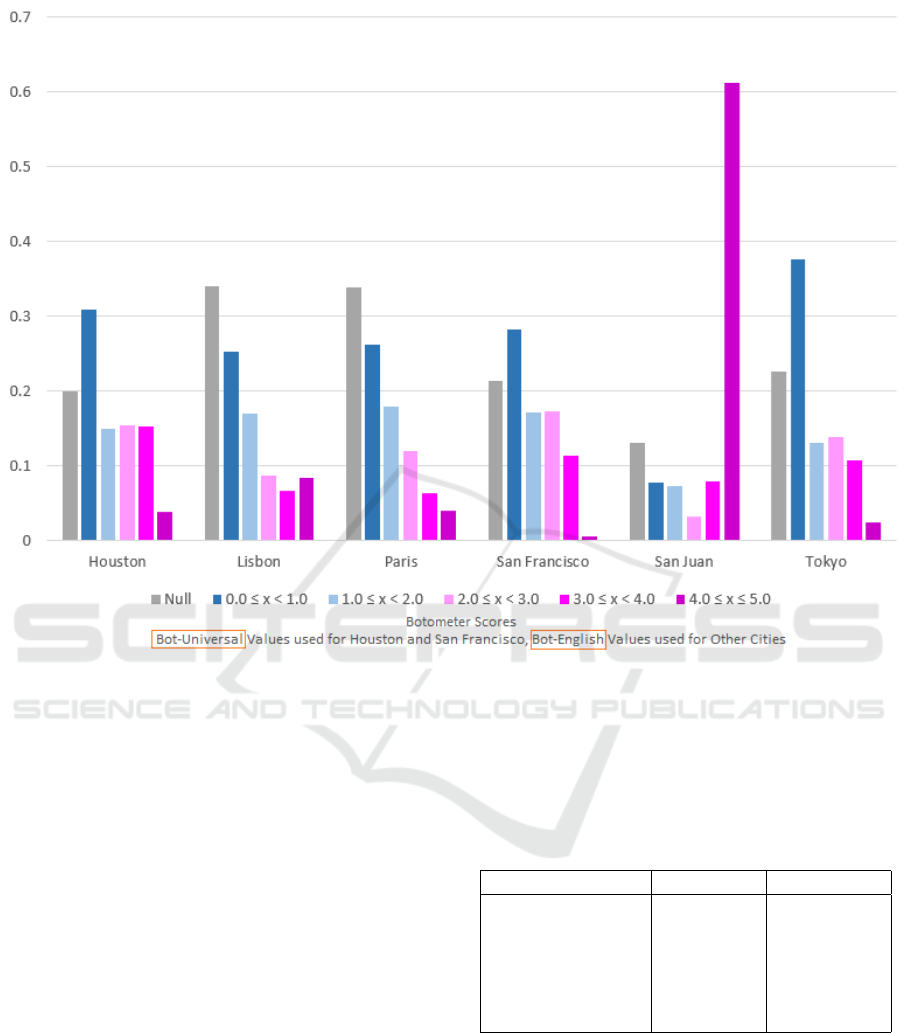
Figure 4: Normalized Botometer Score Counts for Tweets in the Six Cities Using Opposite Language Scores, September 1,
2018 to October 27, 2018.
accounts. One outlier is San Juan, which indicates
a large amount of likely totally automated Twitter
accounts. Upon further inspection, the entirety of
these Tweets have authoring accounts that are affili-
ated with a job staffing firm, corroborated by the con-
tent of the Tweets containing job postings. The re-
sults from Figure 5 and 6 do not vary as widely as the
bot scores, and likely do not rely as heavily on con-
tent/sentiment.
Deciding on a cutoff value for the bot scores and
CAP values is arbitrary and can depend on applica-
tion. E.g., if an end-user wants to be very sure they’re
considering only human-like data, they can filter out
Tweets that have a bot score above 1, which is 20% of
the maximum value of 5. For the purpose of this in-
vestigation, 40% is chosen as the cutoff value, which
will return mostly human-like Tweets, but may have
Tweets from bots present in the result set. Table 4
shows the percentages of bot-like Tweets, over the
Tweets that have non-null bot/CAP values, based on
the 40% cutoff, for the six cities, using English val-
ues for Houston and San Francisco while using the
universal values for the other four cities, over the in-
vestigation timespan.
Table 4: Percent of Bot-like Tweets for the Six Cities Using
Local Language Values across Tweets w/ Non-null Values
by Bot Score and CAP Value, September 1, 2018 to October
27, 2018.
City Bot ≥ 40% CAP ≥ 40%
Houston, US 55.05% 33.13%
Lisbon, Portugal 23.04% 10.61%
Paris, France 24.70% 8.03%
San Francisco, US 35.30% 19.20%
San Juan, PR 38.39% 58.05%
Tokyo, Japan 10.93% 4.27%
For the bot scores, the minimum bot presence is
estimated to be 10.93%, the maximum is 55.05% with
an average estimation of 31.24%. For the CAP val-
ues, the minimum bot presence is estimated to be
4.27%, the maximum is 58.08% with an average es-
timation of 22.22%. Comparison against an objective
marker of bot-permeation in an area would be ideal,
unfortunately, such a measure does not currently ex-
ist. Nonetheless, it is apparent that a significant num-
Exploring Bot Pervasiveness in Global Cities using Publicly Available Volunteered Geographic Information
149
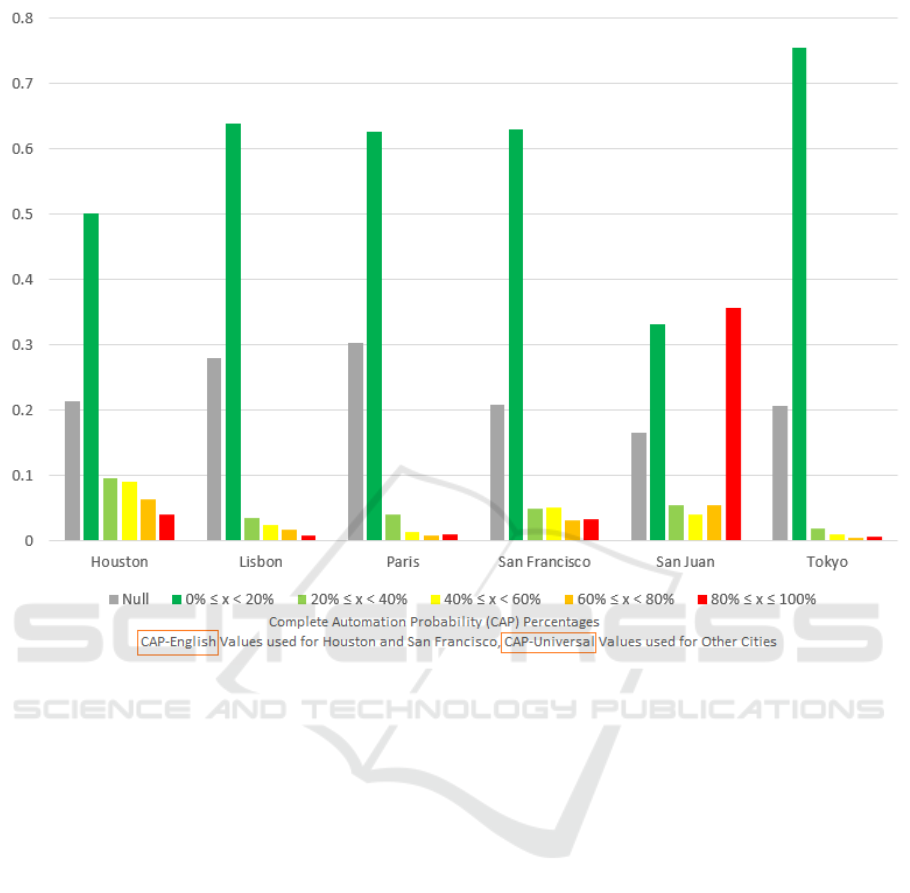
Figure 5: Normalized CAP Values Counts for Tweets in the Six Cities, September 1, 2018 to October 27, 2018.
ber of Tweets from accounts that exhibit bot-like char-
acteristics exist in publicly available Twitter data, and
adjudication/mitigation is recommended before using
for emergency response and disaster recovery.
5 FOLLOW-ON WORK
• This investigation is performed experimentally
and is not actively being used in the response
realm. Partnerships with emergency response and
disaster recovery practitioners are required for
field-level deployment, evaluation and improve-
ment. Generation of Open Geospatial Consortium
Web Map and Web Feature layers, such that this
data can be integrated into other GIS products, is
another possible way forward.
• One of the weaknesses of this method is utilizing
one social media service, and one bot-detection
algorithm. Incorporation of data from other ser-
vices can create a more complete operational pic-
ture of a geographic space. Also, receiving bot
data from a single service/algorithm creates a pos-
sible point of failure; fusion/integration with other
bot mitigation methods would increase resilience
and data quality.
• Near real-time translation is investigated in this
work, but no best path forward is apparent. With
rapid movement in the cloud-services space, con-
tinued consideration is required to find the best-in-
class translation solutions that combine high ac-
curacy/throughput with low price/latency for this
need.
• While the selected cities are more pertinent that
cities selected in previous work, many more
global cities, of varying sizes, need considered
to reliably quantify the amount of automated data
present in the sample set.
• It would also be of interest to perform testing
by providing two different data streams to end-
users during a pertinent event; one would be full-
stream, the other would have the bot-like Tweets
removed using this algorithm. After the event, er-
ror rates could be compared between the different
sets of users, exploring the practical utility of this
bot mitigation process.
GISTAM 2019 - 5th International Conference on Geographical Information Systems Theory, Applications and Management
150
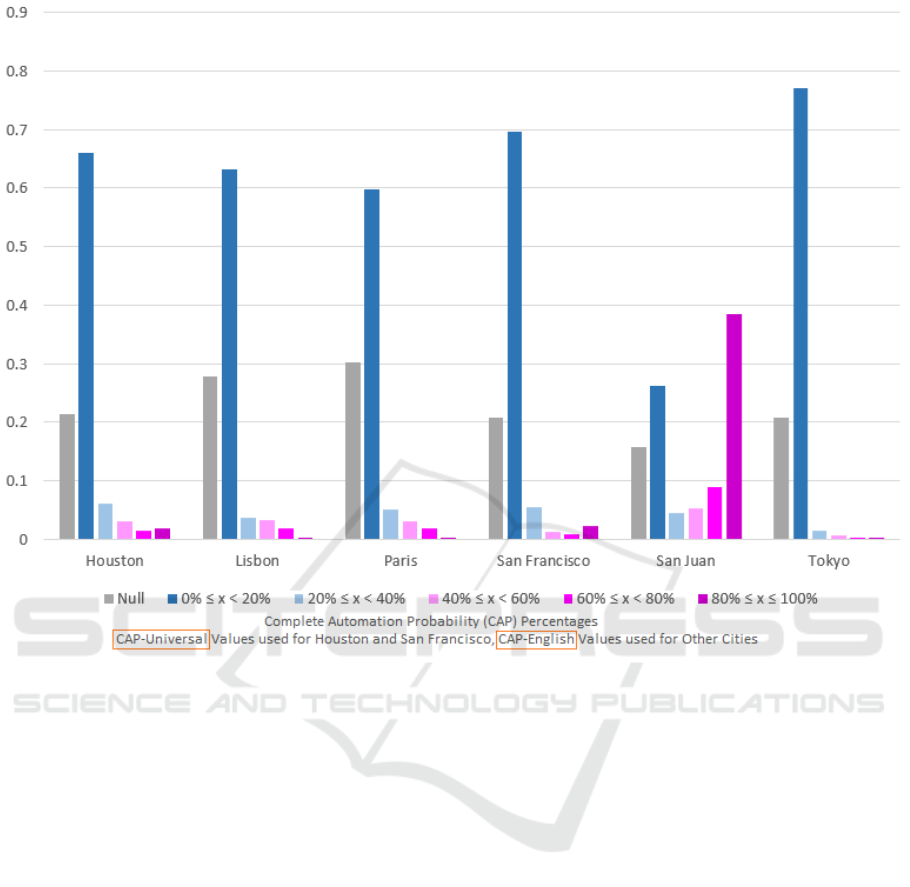
Figure 6: Normalized CAP Values Counts for Tweets in the Six Cities Using Opposite Language Scores, September 1, 2018
to October 27, 2018.
6 CONCLUSIONS
A software stack that was previously developed as a
prototype has been extended to monitor Twitter bot
pervasiveness in several global, linguistically non-
homogenous cities that are at risk for, or that have
recently suffered a crisis. Bot presence is investigated
through different metrics which take local language
into consideration. It has been found for these cities,
using publicly available Twitter data, this specific bot
detection algorithm, and local language values over
the eight-week investigation period; that on average,
an estimated 31.24% of Tweets are generated by auto-
mated accounts, with an estimated complete automa-
tion probability of 22.22%. Quantifying that nearly a
third of the data is questionable gives an end-user a
more holistic view of the dataset and is critical when
integrating volunteered geospatial data into decision
making processes.
REFERENCES
Antoniou, V., Lappas, S., Leoussis, C., and Nomikou, P.
(2017). Landslide risk assessment of the santorini
volcanic group. In Proceedings of the 3rd Interna-
tional Conference on Geographical Information Sys-
tems Theory, Applications and Management - Volume
1: GISTAM,, pages 131–141. INSTICC, SciTePress.
Aubrecht, C.,
¨
Ozceylan Aubrecht, D., Ungar, J., Freire, S.,
and Steinnocher, K. (2017). Vgdi–advancing the con-
cept: Volunteered geo-dynamic information and its
benefits for population dynamics modeling. Transac-
tions in GIS, 21(2):253–276.
Avvenuti, M., Cimino, M. G., Cresci, S., Marchetti, A.,
and Tesconi, M. (2016). A framework for detect-
ing unfolding emergencies using humans as sensors.
SpringerPlus, 5(1):43.
Beaverstock, J. V., Smith, R. G., and Taylor, P. J. (1999). A
roster of world cities. Cities, 16(6):445–458.
Botometer (2018a). Botometer api documentation.
Botometer (2018b). Botometer by osome.
Caragea, C., Silvescu, A., and Tapia, A. H. (2016). Identi-
fying informative messages in disasters using convo-
lutional neural networks. In Conference Proceedings
Exploring Bot Pervasiveness in Global Cities using Publicly Available Volunteered Geographic Information
151

- 13th International Conference on Information Sys-
tems for Crisis Response and Management. Interna-
tional Conference on Information Systems for Crisis
Response and Management.
Costa, A. C., Sousa, M., Carvalho, A., and Coelho, E.
(2008). Seismic loss scenarios based on hazard dis-
aggregation. application to the metropolitan region of
lisbon, portugal. In Assessing and managing earth-
quake risk, pages 449–462. Springer.
Davis, C. A., Varol, O., Ferrara, E., Flammini, A., and
Menczer, F. (2016). Botornot: A system to evaluate
social bots. In Proceedings of the 25th International
Conference Companion on World Wide Web, pages
273–274. International World Wide Web Conferences
Steering Committee.
Emanuel, K. (2011). Global warming effects on us
hurricane damage. Weather, Climate, and Society,
3(4):261–268.
Freire, S. and Aubrecht, C. (2011). Assessing spatio-
temporal population exposure to tsunami hazard in the
lisbon metropolitan area. Proceedings of ISCRAM.
Gallucci, M. (2018). Rebuilding puerto rico’s power grid:
The inside story. IEEE Spectrum.
GaWC (2017). The world according to gawc 2012.
Google (2018). Language support — cloud translation api
— google cloud.
Halse, S. E., T. A. S. A. C. C. (2016). An emotional step to-
wards automated trust detection in crisis social media.
In Conference Proceedings - 13th International Con-
ference on Information Systems for Crisis Response
and Management, pages 583–591. International Con-
ference on Information Systems for Crisis Response
and Management.
Hegelich, S. and Janetzko, D. (2016). Are social bots on
twitter political actors? empirical evidence from a
ukrainian social botnet. In Tenth International AAAI
Conference on Web and Social Media.
Hiltz, R., P. L. (2013). Dealing with information overload
when using social media for emergency management:
Emerging solutions. In Conference Proceedings - 10th
International Conference on Information Systems for
Crisis Response and Management, pages 823–827.
International Conference on Information Systems for
Crisis Response and Management.
Hosebird (2014). Github - twitter/hbc.
Jennex, M. E. (2007). Modeling emergency response sys-
tems. In 2007 40th Annual Hawaii International Con-
ference on System Sciences (HICSS’07), pages 22–22.
IEEE.
Kim, J. and Hastak, M. (2018). Social network analysis:
Characteristics of online social networks after a dis-
aster. International Journal of Information Manage-
ment, 38(1):86–96.
Moturu, S. T. and Liu, H. (2011). Quantifying the trust-
worthiness of social media content. Distributed and
Parallel Databases, 29(3):239–260.
NOAA (2018). Noaa national centers for environmental in-
formation u.s. billion-dollar weather and climate dis-
asters.
Nolen-Hoeksema, S. and Morrow, J. (1991). A prospective
study of depression and posttraumatic stress symp-
toms after a natural disaster: the 1989 loma prieta
earthquake. Journal of personality and social psychol-
ogy, 61(1):115.
O’Connor, B., Krieger, M., and Ahn, D. (2010). Tweetmo-
tif: Exploratory search and topic summarization for
twitter. In Fourth International AAAI Conference on
Weblogs and Social Media.
Petersen, L., F. L. H. G. R. P. S. E. B. R. (2018). Novem-
ber 2015 paris terrorist attacks and social media use:
Preliminary findings from authorities, critical infras-
tructure operators and journalists. In Conference Pro-
ceedings - 15th International Conference on Informa-
tion Systems for Crisis Response and Management,
pages 629–638. International Conference on Informa-
tion Systems for Crisis Response and Management.
Purohit, H., M. K. (2018). The digital crow’s nest: A
framework for proactive disaster informatics & re-
silience by open source intelligence. In Conference
Proceedings - 15th International Conference on Infor-
mation Systems for Crisis Response and Management,
pages 949–958. International Conference on Informa-
tion Systems for Crisis Response and Management.
Reidmiller, D.R., C. A. D. E. K. K. K. L. T. M. and (eds.),
B. S. (2018). Usgcrp, 2018: Impacts, risks, and adap-
tation in the united states: Fourth national climate as-
sessment, volume ii: Report-in-brief.
Reuter, C., K. M. S. R. (2017). Rumors, fake news and
social bots in conflicts and emergencies: Towards a
model for believability in social media. In Conference
Proceedings - 14th International Conference on Infor-
mation Systems for Crisis Response and Management,
pages 583–591. International Conference on Informa-
tion Systems for Crisis Response and Management.
Sakaki, T., Okazaki, M., and Matsuo, Y. (2010). Earthquake
shakes twitter users: real-time event detection by so-
cial sensors. In Proceedings of the 19th international
conference on World wide web, pages 851–860. ACM.
Samuels, R., Taylor, J., and Mohammadi, N. (2018). The
sound of silence: Exploring how decreases in tweets
contribute to local crisis identification. In Conference
Proceedings - 15th International Conference on Infor-
mation Systems for Crisis Response and Management,
pages 696–704. International Conference on Informa-
tion Systems for Crisis Response and Management.
Shelton, T., Poorthuis, A., Graham, M., and Zook, M.
(2014). Mapping the data shadows of hurricane sandy:
Uncovering the sociospatial dimensions of ‘big data’.
Geoforum, 52:167–179.
Spivey, R. and Valappil, S. (2018). Creating a likelihood
and consequence model to analyse rising main bursts.
In Proceedings of the 4th International Conference on
Geographical Information Systems Theory, Applica-
tions and Management - Volume 1: GISTAM,, pages
167–172. INSTICC, SciTePress.
Stephens, M. and Poorthuis, A. (2015). Follow thy neigh-
bor: Connecting the social and the spatial networks on
twitter. Computers, Environment and Urban Systems,
53:87–95.
Sui, D. and Goodchild, M. (2011). The convergence of gis
and social media: challenges for giscience. Interna-
tional Journal of Geographical Information Science,
25(11):1737–1748.
GISTAM 2019 - 5th International Conference on Geographical Information Systems Theory, Applications and Management
152

Toepke, S. L. (2018a). Leveraging elasticsearch and
botometer to explore volunteered geographic infor-
mation. In Conference Proceedings - 15th Interna-
tional Conference on Information Systems for Crisis
Response and Management, pages 663–676. Interna-
tional Conference on Information Systems for Crisis
Response and Management.
Toepke, S. L. (2018b). Minimum collection period for vi-
able population estimation from social media. In Pro-
ceedings of the 4th International Conference on Ge-
ographical Information Systems Theory, Applications
and Management - Volume 1: GISTAM,, pages 138–
147. INSTICC, SciTePress.
Varol, O., Ferrara, E., Davis, C. A., Menczer, F., and Flam-
mini, A. (2017). Online human-bot interactions: De-
tection, estimation, and characterization. In Eleventh
international AAAI conference on web and social me-
dia.
Workgroup, C. R. E. (2013). Cascadia subduction zone
earthquakes: A magnitude 9.0 earthquake scenario.
Oregon Department of Geology and Mineral Indus-
tries.
Exploring Bot Pervasiveness in Global Cities using Publicly Available Volunteered Geographic Information
153
