
Distributed and Scalable Platform for Collaborative Analysis of Massive
Time Series Data Sets
Eduardo Duarte
1
, Diogo Gomes
1,2
, David Campos
3
and Rui L. Aguiar
2
1
Department of Electronics, Telecommunications and Informatics, University of Aveiro, Aveiro, Portugal
2
Institute of Telecommunications, University of Aveiro, Aveiro, Portugal
3
Bosch Thermotechnology, Aveiro 3800-533, Portugal
Keywords:
Time Series, Annotations, Annotation Systems, Collaborative Software, Data Analysis, Information Science,
Data Modeling, Knowledge Management, Database Management Systems, Distributed Systems, Information
Visualization.
Abstract:
The recent expansion of metrification on a daily basis has led to the production of massive quantities of
data, which in many cases correspond to time series. To streamline the discovery and sharing of meaningful
information within time series, a multitude of analysis software tools were developed. However, these tools
lack appropriate mechanisms to handle massive time series data sets and large quantities of simultaneous
requests, as well as suitable visual representations for annotated data. We propose a distributed, scalable,
secure and high-performant architecture that allows a group of researchers to curate a mutual knowledge base
deployed over a network and to annotate patterns while preventing data loss from overlapping contributions
or unsanctioned changes. Analysts can share annotation projects with peers over a reactive web interface with
a customizable workspace. Annotations can express meaning not only over a segment of time but also over a
subset of the series that coexist in the same segment. In order to reduce visual clutter and improve readability,
we propose a novel visual encoding where annotations are rendered as arcs traced only over the affected
curves. The performance of the prototype under different architectural approaches was benchmarked.
1 INTRODUCTION
As we progress further into the modern age of
knowledge-oriented digital innovation, the require-
ments for digital data processing and storage keep in-
creasing at an exponential rate. While in 2016 the
annual rate of data traffic was at 1.2 zettabytes per
year, it is projected that this rate will increase to 3.3
zettabytes per year by 2021
1
. One of the major growth
spurts that has led to this large increase in data con-
sumption is the increased metrification of internet-
connected devices like smartphones, wearable gad-
gets, real-time sensors, Heating, Ventilation and Air-
Conditioning (HVAC) boilers, Smart Home devices
and many other equipments composing the Internet
of Things (IoT). While data has grown at an alarming
rate, increasing in the three Vs (Volume, Variety and
Velocity) (Laney, 2001), most business solutions col-
lect more data than they can process to produce the
1
https://www.cisco.com/c/en/us/solutions/collateral/ser
vice-provider/visual-networking-index-vni/vni-hypercon
nectivity-wp.html
fourth and fifth Vs, Value and Veracity. To generate
meaning out of large collections of data, systems for
analysis, automation, monitoring and anomaly detec-
tion have been developed. Analysts can easily explore
and refine these data sets under a myriad of criteria,
expediting the knowledge discovery.
1.1 Time Series Analysis
For most of the mentioned use cases, the collected
data is only useful if the various metric events are
logged and presented in an orderly manner, as some of
the most important observations are made not to a sin-
gle data point but to sets of data points that constitute
a pattern over time. The overall set of sorted points
comprise a time series, matching an observations of a
measurement over discrete, nonuniform time intervals
(O’Reilly, 2015). A common notation used to for-
mally specify a single data point in a series is to struc-
ture it as a tuple of two elements (i.e. a 2-tuple) or a
key-value pair, expressed as (t,v). Each data point
maps a unique time indicator, traditionally modeled
Duarte, E., Gomes, D., Campos, D. and Aguiar, R.
Distributed and Scalable Platform for Collaborative Analysis of Massive Time Series Data Sets.
DOI: 10.5220/0007834700410052
In Proceedings of the 8th International Conference on Data Science, Technology and Applications (DATA 2019), pages 41-52
ISBN: 978-989-758-377-3
Copyright
c
2019 by SCITEPRESS – Science and Technology Publications, Lda. All rights reserved
41

as a timestamp under the ISO-8601 standard or the
UNIX Epoch standard, to a nonunique value.
The continuous nature of time series makes them
particularly suitable to represent real-life events for
monitoring and analysis purposes (Fu, 2011). In
fact, time series analysis can be found in almost ev-
ery aspect of human life: medical diagnosis based
on Electroencephalograms (EEGs) and Electrocardio-
grams (ECGs), financial technical analysis, monitor-
ing and prediction of meteorological or natural occur-
rences, and many others. An integral part of the anal-
ysis process for time series is leveraging the human
ability to visually identify trends, anomalies, corre-
lations and patterns (Keim et al., 2006). To enable
this visual discovery of meaningful patterns in time
series data sets, analysis software solutions were de-
veloped to acquire, persist and display data to a set
of collaborating users. As collaborators progressively
break larger sequences of data into smaller and more
understandable ontologies, the shared data warehouse
of useful knowledge grows. However, the previously
mentioned domains typically produce large quantities
of time series, which can often lead to data entropy
and visual pollution that substantially increase the
complexity and difficulty of analytical tasks. Anal-
ysis platforms that are built to support these massive
data sets should be capable of handling them at both
an architectural level and at a visual level.
Many research papers and academic documents
already outline systems for collaborative exploration
of multivariate time series data. The Artemis platform
(Blount et al., 2010) is a fully-fledged server and web
application that displays physiological data streams
collected from patients waiting for care in the emer-
gency department. The stream data is stored long-
term for retrospective analysis and data mining pur-
poses. Papers like (Healy et al., 2010) and (O’Reilly,
2015) implement a similar web platform with the goal
of enabling decision support for diagnosis based on
physiological patient data. Other works focus on
biomedical and health-care time series data streams
from ECGs terminals (Bar-Or et al., 2004), as well as
on prediction of high-frequency yet volatile financial
time series data (Hadavandi et al., 2010).
1.1.1 Storage
A wide majority of the previously mentioned time
series analysis systems implement persistence logic
with a single relational database node. The usage of a
Relational Database Management System (RDBMS)
enables the optimal storage and indexing of time se-
ries with a wide variety of data types (e.g geospa-
tial locations) and the modeling of a strong relational
schema, but the question of wherever these RDBMSs
are the most efficient choice for storing time series
when compared with other, more recent technologies
is left unanswered. Many academic documents al-
ready contain benchmarks for existing storage tech-
nologies with time series data, so in order to find
the most appropriate tools for our time series anal-
ysis platform, we performed a survey over all these
benchmarks. The proposed solution in this paper op-
erates under the assumptions and conclusions taken
from these works.
While many RDBMSs such as PostgreSQL
2
al-
ready support temporal segments, these do not inte-
grate temporal data rollup procedures that sort and
summarize time series under data views with de-
creased detail. These procedures would allow queries
to be made to the data set without knowing the range
ahead of time and without needing to scan a massive
amount of records individually. In the last few years
there has been a surge in new time series databases
with rollup mechanisms that use RDBMSs as back-
end, inheriting their flexible data model, their battle-
tested reliability and performance, and their ecosys-
tem of open-source extensions. One such database is
TimescaleDB
3
, built with PostgreSQL. A few stud-
ies suggest that TimescaleDB has favorable perfor-
mance for both insertions and queries when directly
compared with other database systems like InfluxDB
4
(Freedman, 2018), Cassandra
5
(Hampton, 2018) and
PostgreSQL (Kiefer, 2017). However, the majority
of these benchmarks are written by the authors of
TimescaleDB and have not been independently re-
viewed, which can lead to a biased comparison.
Although a strong relational schema for time se-
ries could be a positive feature for aggregate queries
that require time series, annotations and users all-in-
one, (Jensen et al., 2017) and (Mathe et al., 2017)
suggest that using a traditional RDBMS for time se-
ries management can result in less than optimal per-
formance at scale. Instead, Time Series Database
Management Systems (TSDBMSs) should be used,
as these will index timestamps as primary identi-
fiers and perform temporal rollups to improve query
speed. Since the early 2000s there have been mul-
tiple attempts at implementing TSDBMSs, but only
the most recent generation of open-source TSDBMSs
have been developed with a deliberate focus on han-
dling massive amounts of time series, responding to
modern requirements of data processing (Jensen et al.,
2017). In (Bader et al., 2017) the authors evaluate the
performance of various TSDBMSs such as InfluxDB,
2
https://www.postgresql.org/
3
https://www.timescale.com/
4
https://www.influxdata.com/
5
http://cassandra.apache.org/
DATA 2019 - 8th International Conference on Data Science, Technology and Applications
42
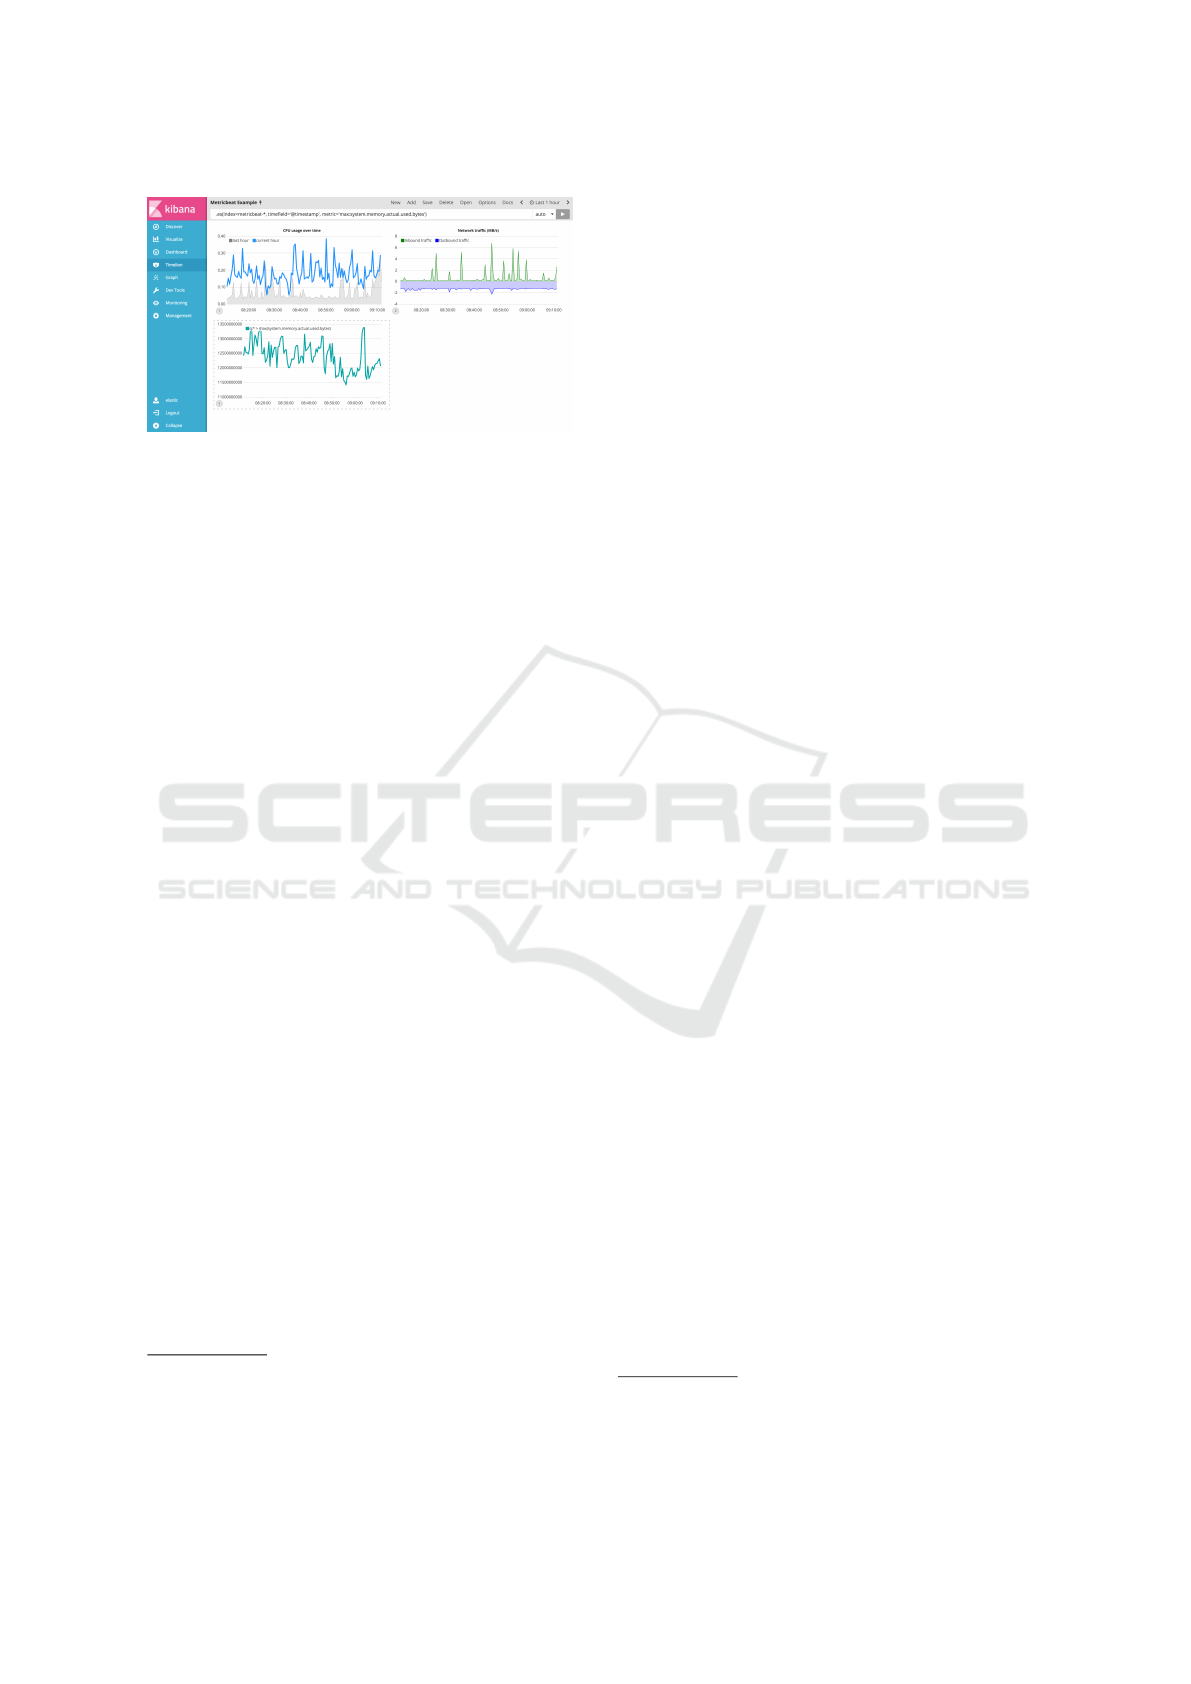
Figure 1: Timelion dashboard displaying multiple time se-
ries charts in simultaneous.
Druid
6
, ElasticSearch
7
, MonetDB
8
and Prometheus
9
,
all of which are implemented using a Log-structured
Merge (LSM) tree data structure (ONeil et al., 1996)
that specializes in storing values indexed by unique
keys. The authors concluded that both Druid and In-
fluxDB offered the best long-term storage function-
ality, but when compared with RDBMSs, TSDBMSs
have a more limited data model and a lack of features
such as constraints, data validation and fault-tolerance
mechanisms.
1.1.2 Visualization
Time series are among the most common type of data
explored in quantitative graphical perception studies.
Visualization of time series can be a very challeng-
ing task, as temporal data from realistic scenarios is
often complex with high cardinality. Line graphs in
the Cartesian coordinate system have been the main
visualization for temporal data ever since its initial
proposal by William Playfair in 1786. In (Cleveland
and McGill, 1984) it is suggested that the strength of
these graphs is in the ability to perceive patterns such
as spikes or drops and to understand how time and
values relate to each other.
Most of the previously mentioned software solu-
tions provide time series visualization within web ap-
plications. The most recent developments made to the
web browser and Javascript technologies, the near-
universal availability of web browsers in the majority
of computers and mobile devices, and the ubiquity in
the way users are accustomed to interact with these,
make the web platform a more attractive choice for
the development of data science software.
In highly heterogeneous use cases such as the
analysis over massive quantities of sensor data, there
6
http://druid.io/
7
https://www.elastic.co/products/elasticsearch
8
https://www.monetdb.org/
9
https://prometheus.io/
are various time series that tendentially need to be
visualized simultaneously, so as to observe how dif-
ferent metrics affect and depend on one another
(Hochheiser and Shneiderman, 2004). In the commer-
cial and open-source space, there are multiple dash-
board tools for visualization of time series, such as
Timelion
10
, Grafana
11
and Freeboard
12
, that imple-
ment both a shared-space model, where multiple time
series co-exist in the same chart, and a split-space
model, where series are displayed in separate charts,
as shown in Figure 1.
1.2 Annotations
While time series in themselves are highly capable
of representing a measurement over time, their mean-
ing is not directly conveyed. Human or machine ob-
servers require the assistance of appended metadata to
create this unit of knowledge. This concept of a data
annotation has been applied in a wide scope of do-
mains as a way to critique the data, represent a mem-
ory aid, highlight an important segment, describe a
taxonomy (Keraron et al., 2009), or circumvent rigid
records to express additional data that was not orig-
inally envisioned in the input data set (Healy et al.,
2011). Based on this, there is sufficient evidence
available that shows that the usage of annotations in
collaborative analysis platforms enables a more ade-
quate knowledge-building and decision-making pro-
cess (Kalogeropoulos et al., 2003). In (Guyet et al.,
2007) the authors propose a software solution where
clinicians can explore biomedical time series and an-
notate segments of interest, instructing an automated
system to extract similar patterns. In (Healy et al.,
2010), (Healy et al., 2011) and (O’Reilly, 2015), the
respective authors implement a system that stores data
from real-time physiological streams and annotations
made by analysts at remote locations.
1.2.1 Storage
All of the mentioned time series analysis solutions
that provide annotation support take advantage of
RDBMSs to model a strong relationship between an-
notations and other entities such as users, which are
often requested simultaneously. Benchmark studies
on the performance of open-source RDBMSs, such
as (Bader et al., 2017), promote PostgreSQL as being
the most mature and feature-complete option. Post-
greSQL is ideal when prioritizing high Consistency
due to its robust Multiversion concurrency control
10
https://www.elastic.co/blog/timelion-timeline
11
https://grafana.com/
12
http://freeboard.io/
Distributed and Scalable Platform for Collaborative Analysis of Massive Time Series Data Sets
43

(MVCC) model that values Atomicity, Consistency,
Isolation and Durability (ACID) (Momjian, 2018).
MySQL
13
tendentially reports faster reads and writes
than PostgreSQL, but it achieves this by prioritizing
Availability over Consistency in its design
14
. As the
platform scales and structural changes are required,
such as changing indexes or updating large tables
of records, PostgreSQL aggressive Consistency and
strict policies will avoid instances of data corruption
or loss at all costs
15
.
1.2.2 Visualization
In (Adnan et al., 2016), the authors outline two typ-
ical representations for annotations: tooltips, which
are used to append textual notes to a point or region
of interest; and colored highlights, which are used as a
tool to attract the attention of collaborators to a region
of interest (Liang and Huang, 2010).
In the time series analysis platform proposed in
(Healy et al., 2011), annotations can be displayed ei-
ther as waveform classifications, highlighting an area
with a unique color that matches a category or mean-
ing, or as textual notes, relating events outside of the
data set. Open-source dashboard tools like Timelion
and Grafana support annotations, displaying them ei-
ther as vertical line highlights for point annotations
or rectangular highlights for ranged annotations. In
TSPad (Pressly, 2008), a tablet-PC application, anno-
tations can be created by sketching a shape around the
intended area, increasing the flexibility of representa-
tion but resulting in unstructured data that automated
systems can only interpret through the use of graphi-
cal parsing algorithms.
1.3 Architecture
Although some of the previously mentioned time se-
ries analysis systems use strong data management
models that can persist large data sets, these systems
fail to implement distributed techniques like replica-
tion and partitioning to handle intensive workloads
and improve the Availability of the service.
Both (Sow et al., 2010) and (Blount et al., 2010)
build a modular backend architecture that manages
multiple independent processing adapters, using IBM
InfoSphere
16
. The architecture automatically adapts
to the increasing number of patients connected to
13
https://www.mysql.com/
14
https://wiki.postgresql.org/wiki/Why PostgreSQL Inst
ead of MySQL: Comparing Reliability and Speed in 2007
15
https://www.2ndquadrant.com/en/postgresql/postgresq
l-vs-mysql/
16
https://www.ibm.com/analytics/information-server
the system, but no distributed computing techniques
are mentioned. In (O’Reilly, 2015) the author lever-
ages an event-driven model, where any component
can subscribe to any activities in the system under
a publish-subscribe pattern. However, the author
mentions that there is no load-balancing of compo-
nents, so the platform could run into Availability is-
sues when concurrently used by multiple users. The
platform described in (Healy et al., 2010) contains a
Hypertext Transfer Protocol (HTTP) backend server
with a Create, Read, Update and Delete (CRUD)
interface using the Representational State Transfer
(REST) protocol (Fielding, 2000). The communica-
tion channel between a web application and the rela-
tional database, where time series are stored, is made
possible through this REST Application Program-
ming Interface (API). Although this platform lever-
ages modern web technologies, the authors also men-
tion that, for massive amounts of time series, there is
a considerable delay between acquiring new data and
displaying it in the frontend.
2 PROPOSAL
In this document we propose a feature-complete time
series analysis web platform that handles common
use-cases for knowledge discovery, reviewing and
sharing in an optimized manner. Through the use
of annotations, the proposed platform provides a ver-
satile collaborative process for building chunks of
knowledge. The end goal is to iterate on existing
analysis platforms by leveraging what we consider to
be, at the time of writing, the most appropriate open-
source tools and techniques for querying, storing and
displaying time series and annotations under a dis-
tributed and highly-scalable architecture. The back-
end system is implemented in Java 8
17
using vari-
ous modules from the Spring Boot 2.0
18
stack. The
web application was implemented in ReactJS
19
, using
TypeScript
20
as the primary programming language.
Throughout this paper, a massive data set is quan-
tified as at least a dozen terabytes or more of time se-
ries when stored digitally as uncompressed TSV files,
commonly reaching one million data points or more.
As more and more series are collected from multiple
data sources over a long span of time, the platform
should scale accordingly. The time series data set
we used during evaluation was specific to the HVAC
17
https://www.oracle.com/technetwork/java/javase/overv
iew/java8-2100321.html
18
https://spring.io/projects/spring-boot
19
https://reactjs.org/
20
https://www.typescriptlang.org/
DATA 2019 - 8th International Conference on Data Science, Technology and Applications
44
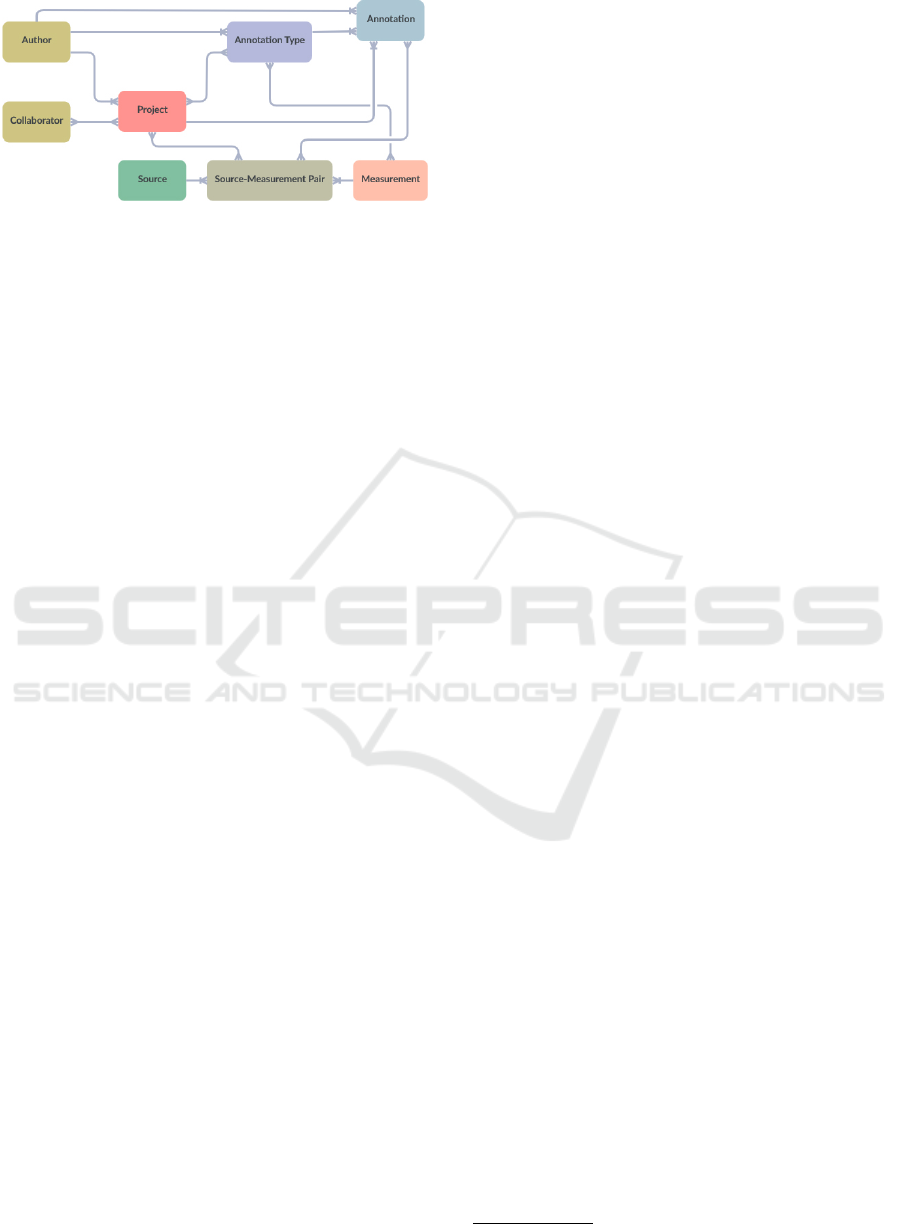
Figure 2: Relational diagram of entities.
domain, collected from 1000 DNA boilers over the
course of 1.3 years, but all the implemented compo-
nents are domain-agnostic.
2.1 Data Model
The input data set is assumed to contain points from
different series and from different data sources. The
term measurement is used to describe a specific series
and all of its meta-data, such as a name, a color and
and an indication of its data type (e.g. a number or a
boolean state), and the term source is used to describe
a data origin device. Each source can contain mul-
tiple measurements, and each measurement can exist
in multiple sources, so every time series is uniquely
identified by a source-measurement pair. If the input
data set does not identify any point of supply or does
not contain multiple measures, then the platform will
accommodate the entire data set within a single data
source or a single measurement respectively.
The designation of ontology is used in this paper
to describe all of the entities that are generated from
user input and that compose the knowledge base of
the platform, such as annotations, annotation types
and user profiles. Measurements and sources are also
included as part of the ontology, although the respec-
tive series points are not. To separate different an-
notations at the contextual level, establishing a scope
of analysis and an annotation goal over a subset of
the available time series, all annotations are contained
within projects. Any user can create a project by set-
ting up a query over the series data set, a repository of
allowed annotation types, and a set of collaborators.
Figure 2 shows how ontology entities relate to one
another. Note that while projects, annotations and
annotation-types have a set of users related to them,
data sources and measurements do not, as these two
are automatically modeled after the input time se-
ries data at the system level. Additionally, while this
diagram separates Author from Collaborator, when
stored in a RDBMS these two entities are unified un-
der the same User entity.
A = (t
1
,t
2
, p, c, u,txt, s
1
,s
2
,...,s
n
) (1)
Annotations are expressed as in (1), where: t is a
timestamp in the ISO-8601 format and in the Coordi-
nated Universal Time (UTC) standard, so t
1
and t
2
are
respectively the start and end of a segment of time; p
is the parent project; c is a parent category or type; u
is the author of the annotation; txt is a free-text field
with additional notes to be shared with collaborators;
and the s-set is the annotated time series, identified by
their source-measurement pairs. The proposed repre-
sentation enforces a set of common fields that sim-
plify searchability and versioning, and allows anno-
tations to be both readable by human observers and
interpretable by machines for indexing and data min-
ing purposes. The starting and the ending points can
be set to the same timestamp, fundamentally repre-
senting a point annotation instead of a ranged one.
The annotation type is taken from a global repository
of types, enforcing a common semantic across differ-
ent projects, series and segments of time. Annotation
types also have a user-configurable color, which is
used when rendering child annotations in a chart, and
a set of constraints that limit which annotations can
have the type in question based on their segment type
(point or range) and their annotated measurements.
The main difference between the proposed model
for annotations and the existing ones is the ability to
specify a set of annotated series, limiting the scope
of the annotation in the specified segment to only a
subset of the series that are displayed in that segment.
This set can also be left empty, denoting a global an-
notation for a segment of time that is identical to an-
notations in related work. This way, annotations are
logically connected with their series points and can
better handle realistic situations of note-taking and
commentary more appropriately. The digital medium
allows annotations to be easily set up as contextual
extensions of series and modified over time without
ever affecting the original data set.
All entities are modeled within the codebase with
the Hibernate
21
Object-Relational Mapping (ORM),
using both the Java Persistence API (JPA) and Hiber-
nate API to describe tables, indexes, columns and re-
lations. This introduces type safety, improves read-
ability, and enable features such as Integrated Devel-
opment Environment (IDE) support and debugging
through the Java compiler to facilitate maintenance
over long development cycles.
2.2 Data Management
Under the Consistency, Availability and Partition tol-
erance (CAP) theorem (Gilbert and Lynch, 2002), the
21
http://hibernate.org/
Distributed and Scalable Platform for Collaborative Analysis of Massive Time Series Data Sets
45

proposed solution should be designed with a Consis-
tency + Availability (C+A) model, prioritizing Con-
sistency and Availability over resilience to network
failures. Within an analytical scope, the main use case
is to go over historical data and gain insight over visi-
ble patterns by proposing and refining annotations, so
under the PACELC theorem (Abadi, 2012), an Avail-
ability + Latency over Consistency (E+L) architec-
ture is chosen for time series, preferring eventual-
consistency and low latency of reads, while a Consis-
tency + Availability over Latency (E+C) architecture
is chosen for the ontology, so that annotation propos-
als from collaborators always iterate consistently over
the most recent changes.
Based on the research listed in the previous sec-
tion, modern TSDBMSs are the best candidates for
efficiently querying over massive amounts of histor-
ical data. However, TSDBMSs are unable to struc-
ture relationships, making them unwieldy to use for
storing our ontology where various related entities are
commonly queried together. Therefore, a relational
database is used to store the ontology instead, and
the implemented solution leverages a granular persis-
tence model (Eltabakh et al., 2009) that takes advan-
tage of both a strong relational schema and a high-
performance time series database. In the surveyed
benchmarks, InfluxDB showed a smaller disk impact
and higher query speed for long-term historical time
series, deeming it as the most suitable choice for our
E+L architecture. Likewise, PostgreSQL consistently
showed great performance and a stronger model for
consistent reads and writes (Bader et al., 2017), mak-
ing it the perfect fit for an E+C architecture.
This polyglot framework means that the overall
traffic workload is distributed between two indepen-
dent units of storage. However, because the client
can simultaneously request data types that are split
between these two units, the overall architecture has
to ensure that these queries can be executed asyn-
chronously to avoid bottlenecks. In order to enable
queries for time series by their relation with annota-
tions in a way that reduces dependency on the on-
tology database, we include linked annotation IDs,
as well as their respective annotation-type IDs and
project IDs, in the annotated time series points as in-
dexed tags. A central backend or broker unit is placed
between the requesting user and the two databases to
enforce the data access logic, dictating the queries that
can be sent and concealing from the end-user the real
location of the data.
All annotations, annotation-types and projects are
versioned in order to allow collaborators to revert un-
sanctioned changes. Complete records of historical
data are stored in separate revision tables, emulating
append-only logs (Kreps, 2013) of versions. All ver-
sioning logic is implemented through Hibernate En-
vers
22
, which automatically orchestrates the genera-
tion of revision tables based on the modeled ontol-
ogy. Versions are created within the same transaction
as insertions and updates, so as to avoid opening an
inconsistency window where the entity is created or
updated without the respective version existing.
To reduce latency between requests that fetch or
require the same entities, a Redis
23
cache is deployed
with a Least Recently Used (LRU) eviction policy.
The client connection with Redis is made through the
Spring Data Redis library
24
, which already provides
functionality to serialize the ORM entities from and
to cached objects.
2.3 Architecture
Figure 3 shows an overview of the proposed archi-
tecture. The backend system should be capable of
maintaining high-performance over multiple simulta-
neous requests and of handling failures to guarantee
as much uptime as possible. For this, the backend ap-
plication is replicated over multiple servers/machines
where their single point of entry is a load balancer
unit. Because a load balancer alone does not typically
provide queuing of requests, all requests will continue
to be redirected to the servers even if they are un-
der strain. To solve this, we leverage a RabbitMQ
25
distributed message queue to keep the subsequent re-
quests in a First-In-First-Out (FIFO) queue. The load
balancer is set with a Least Connections balancing
policy, where requests are redirected to the queue with
the least amount queued requests. Queues are then
replicated in order to adapt to increased or decreased
simultaneous usage and to provide a failover measure.
Then, backend servers subscribe to a queue and only
poll requests when they are free to process it.
Every request made in the frontend layer is sent
through HTTP to the load balancer module and ar-
rives at a REST API in the backend layer. This REST
API enables additional layers or units of data input
and output to be added to the architecture, indepen-
dent from the visualization stack.
The entire architecture is deployed using Docker
Swarm
26
, which enables an infrastructure where each
unit can be distributed between nodes or containers.
This is particularly helpful in enabling the proposed
22
https://hibernate.org/orm/envers/
23
https://redis.io/
24
https://spring.io/projects/spring-data-redis
25
http://www.rabbitmq.com
26
https://docs.docker.com/engine/swarm/
DATA 2019 - 8th International Conference on Data Science, Technology and Applications
46
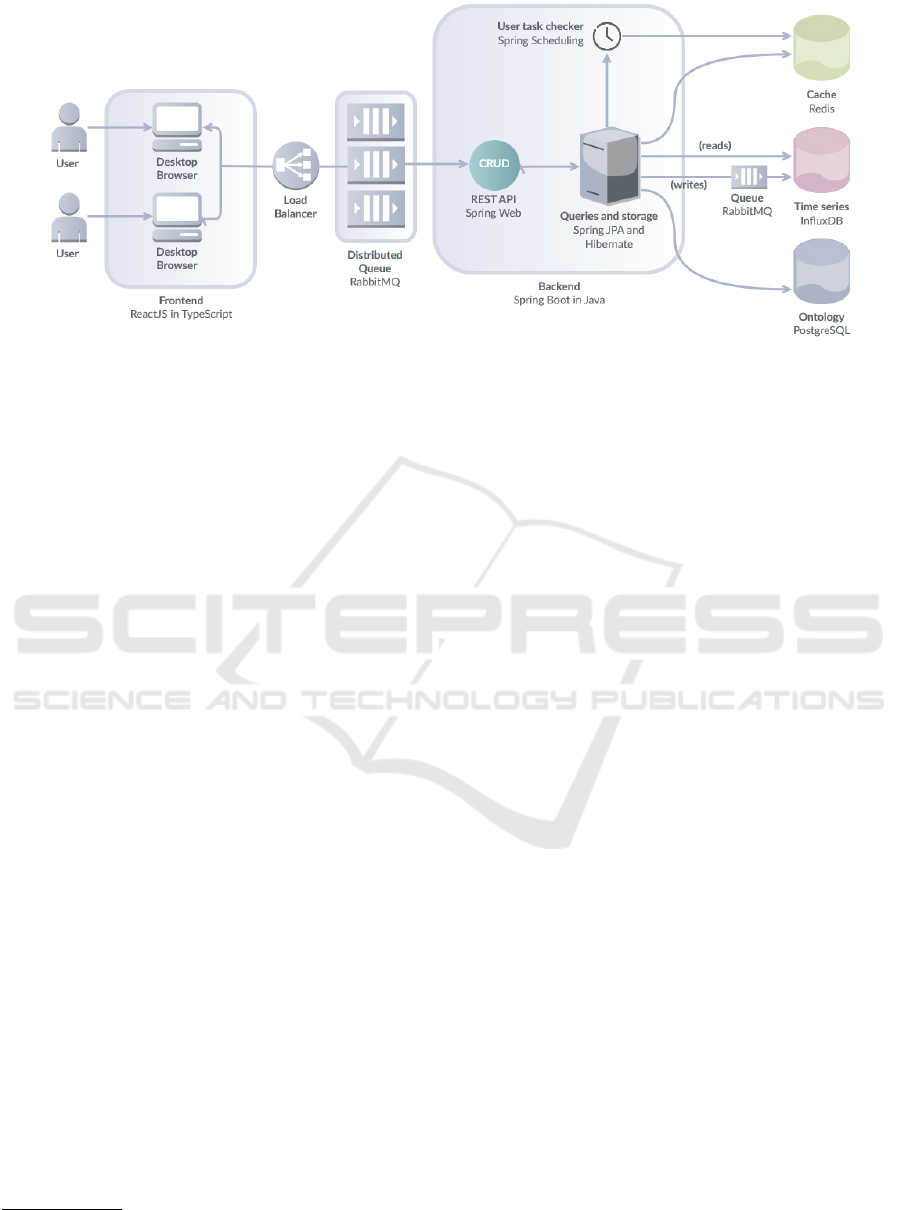
Figure 3: Platform architecture. The backend node can be replicated on-demand to accomodate intensive workloads.
distributed system and facilitating system orchestra-
tion, as both the number of distributed queues in Rab-
bitMQ and the number of backend servers can auto-
matically increase or decrease as the platform scales
and more traffic is detected.
Every operation in the platform, other than the lo-
gin request, is protected. The platform can be config-
ured to either: i) store passwords hashed in BCrypt,
and match these with passwords that are sent in sub-
sequent login requests; or ii) store meta-data that links
the user in this platform to a user in a Lightweight Di-
rectory Access Protocol (LDAP), and use the authen-
tication process of the LDAP to validate the creden-
tials. After a successful login, the JJWT library
27
is
used to generate a session token based on JSON Web
Tokens (JWTs). All JWTs have an expiration date to
prevent a token that was retrieved by a man-in-the-
middle attacker from being used indefinitely.
The backend server is best viewed as a set of pro-
cessing pipelines, where requests pass through a se-
quential order of stages: authentication; payload de-
serialization; validation; conversion of the request to
a valid query or procedure; and serialization of re-
sults while concealing extraneous data. Any request
or response body that passes through the REST API
is encoded in the JavaScript Object Notation (JSON)
markup format, so these can be deserialized to a bi-
nary object modeled in Java using the Jackson
28
li-
brary. The validation stage evaluates insertion or up-
date request payloads, checking mandatory fields and
invalid characters and testing relationship constraints
based on the data model. For an annotation A, a parent
type T , a parent project P, a measurement M, and a
source-measurement pair SM, the evaluated relation-
ship constraints are as follows: i) A is annotating SM,
27
https://github.com/jwtk/jjwt
28
https://github.com/FasterXML/jackson
which P is querying; ii) A is annotating SM, therefore
is annotating M, which T allows; iii) A is annotating
a segment (point or range) that T allows; and iv) P
allows T to be set as parent of A.
Depending on the amount of changes to contents
and entity relationships that are being committed, up-
date transactions to the ontology database can take
a long time to complete. Because of this, every up-
date or version rollback is committed to PostgreSQL
within an asynchronous thread. The pipeline simulta-
neously processes the request and returns a simulated
snapshot of the results to the user, which matches how
the entity will look like in subsequent queries after the
changes have been fully committed.
When two or more users are working simultane-
ously over the same entities, one user will inevitably
run into a situation where the last queried version of
an entity is outdated, as it has already been internally
updated by another user. Without any form of detect-
ing stale data and a locking mechanism, the database
can allow the second user to submit changes based on
an outdated snapshot, potentially discarding changes
from other users. To enforce a sequential order of
collaboration, an optimistic-locking policy is imple-
mented. This policy dictates that requesting users
should always provide the last-modified date of the
entity they observe and propose changes to. If the pro-
vided date and the last-modified date of the respective
entity in the database do not match, the update should
be canceled, forcing the user to re-fetch the entity and
manually merge their changes.
After an ontology update completes successfully,
an update to the relevant time series is propagated
asynchronously to InfluxDB, where annotation links
are added or removed from series points to match the
latest ontology state. However, if two concurrent re-
quests with overlapping series were to be sent, be-
Distributed and Scalable Platform for Collaborative Analysis of Massive Time Series Data Sets
47

Figure 4: Dashboard with three projects and two sources selected. Note that the source identified as ”appliance eb1d5b1”
contains measurements from two separate projects, as these are merged when displayed on the source list.
cause these requests read and perform changes over
the same state of the series, one request would inad-
vertently discard the changes from the other, caus-
ing a race condition. To solve this, all InfluxDB
write requests are placed in a single RabbitMQ FIFO
queue, providing an ordered channel of write pro-
posals. Each proposal naturally fetches the previous
changes made to the affected series and merges them
with new ones. Read-only queries are not queued
and can happen in parallel with writes. With this, al-
though the ontology database is a Highly-Consistent
unit, the time series database becomes an Eventually-
Consistent one, but it is guaranteed that both data
stores are eventually converged on a synchronized
state without any data loss.
Through the use of Spring JPA library
29
and Hi-
bernate, the backend server connects to PostgreSQL
in an agnostic manner. Spring provides a set of
database-agnostic Spring components called reposito-
ries that allow the specification of queries using Java
Persistence Query Language (JPQL), a SQL-like lan-
guage that is translated to the SQL variant optimized
for the chosen data store when the backend is de-
ployed. Spring comes built-in with database client
implementations for various databases, connecting
these with the database-agnostic repository compo-
nents. However, Spring does not implement a client
for InfluxDB, so the connection and query logic for
series data had to be implemented using the official
InfluxDB Java driver
30
. Series queries are modeled
as a structured object in order to expose the query ca-
29
http://spring.io/projects/spring-data-jpa
30
https://github.com/influxdata/influxdb-java
pabilities of InfluxDB to the end user while enforc-
ing the previously described custom logic of annota-
tion linking. Additionally, this query object enforces a
uniform structure that can be traversed by both back-
end and frontend systems, so the backend can check
for unbounded parameters to prevent injection attacks
while the frontend can display the query in a criteria
builder User Interface (UI). Users send this structured
query object to the REST API serialized in JSON, and
once validated, the query object is converted into a
valid InfluxQL query and sent to InfluxDB. With this,
if the data needs to be migrated to different databases,
neither the backend codebase nor the frontend clients
will require changes to accommodate this migration,
as these will continue to interface with their databases
using the same database-agnostic Spring repositories
and series query objects.
2.4 Visualization
Although the existing frontend applications that pro-
vide user-configurable dashboard workspaces, such
as Timelion and Grafana, could be connected with
our input data set in order to display it, these do not
support application-specific implementations such as
custom visual encodings or the previously described
relationship constraints. Therefore, a custom fron-
tend application with a similar dashboard interface
was implemented. This interface, using Ant Design
components
31
, leverages the UI paradigm of panels
and windows, displaying projects, queried sources
and their measurements, visible annotation types, and
31
https://ant.design
DATA 2019 - 8th International Conference on Data Science, Technology and Applications
48
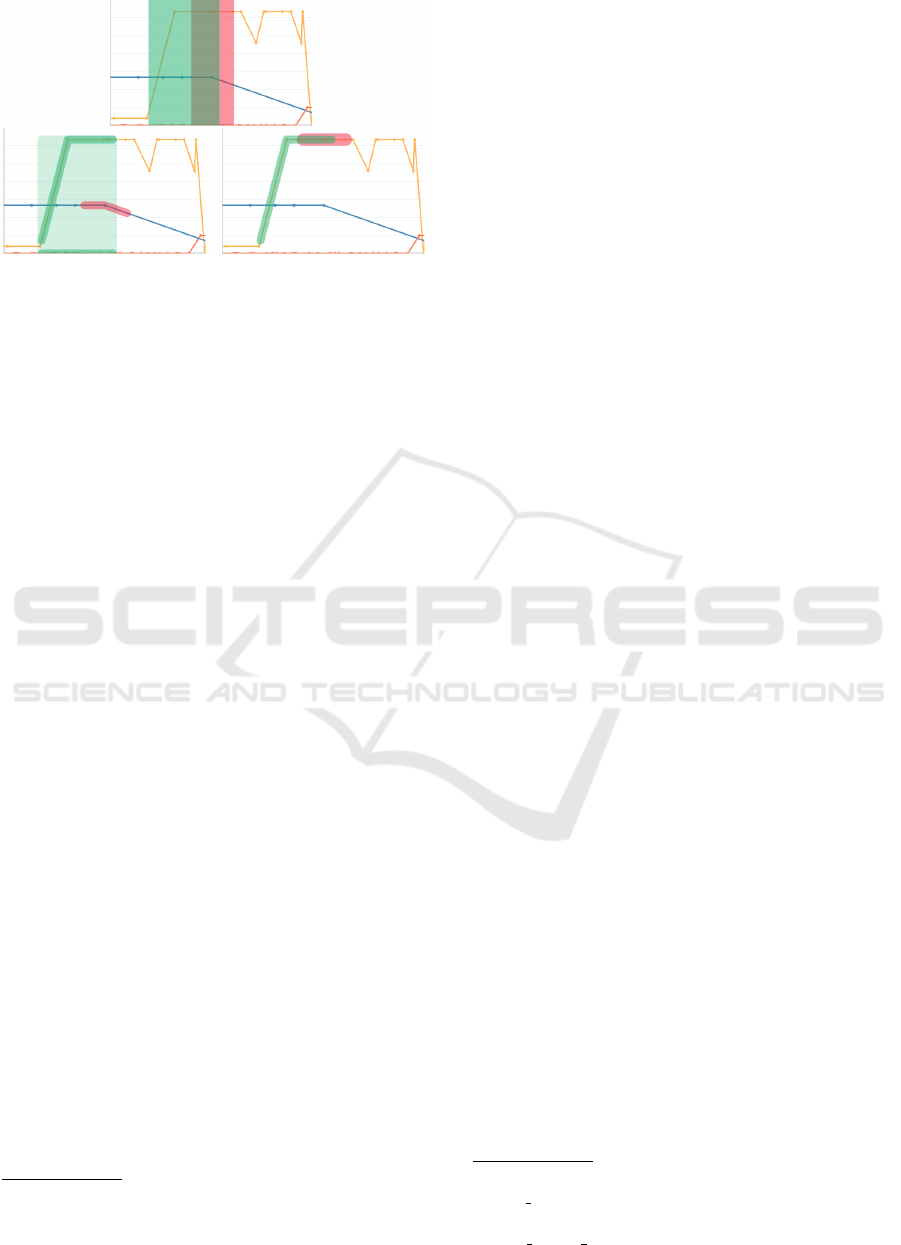
Figure 5: Visual representation of annotations. From top
to bottom and left to right: i) two intersecting annotations
in other platforms; ii) proposed annotation encoding where
two annotations intersect in the same segment of time but
not over the same series; iii) proposed annotation encoding
where two annotations are nested due to intersecting in the
same segment of time and over the same series.
chart windows simultaneously, as seen in Figure 4.
Collaborators can modify query criterias while keep-
ing the series and annotations always in view. The
user can select a project or multiple through ctrl-clicks
or shift-clicks, and the interface will display the com-
bined data from all selected projects, merging the lists
of sources, measurements and annotation types and
spawning a chart window per project. Any chart win-
dow can be moved, resized, or closed, the latter of
which will de-select the project.
The implemented application is composed of mul-
tiple interface modules that can be individually re-
rendered when their data is updated. Redux
32
is used
to handle application state and the reactive propaga-
tion of data throughout relevant modules, while ax-
ios
33
is used as a HTTP client of the implemented
REST API. Line charts are implemented with the Dy-
graphs library
34
, which already contains built-in inter-
actions such as zooming and panning over the graph.
In all of the surveyed time series annotation ap-
plications, the chosen visual representation of col-
ored highlights for annotations matches a data model
where annotations are only attached to segments of
time. However, this is a limited encoding for the pro-
posed model, where annotations are also linked to a
subset of the series within that segment. We instead
propose a novel visual encoding of snakes, where an-
notations are drawn as arcs that follow the affected
series’ curves when inside the specified segment of
time, as shown in Figure 5. Snakes will only trace
over series that are associated with the annotation,
leaving other series in the same segment uncovered,
32
https://redux.js.org/
33
https://github.com/axios/axios
34
http://dygraphs.com/
and are painted with the same color that is attributed
to the annotation’s type. If an annotation affects more
than one series in the same segment, multiple snakes
are traced over all of the affected series’ curves, and a
polygonal overlay is painted in a way that vertically
connects all snakes of the same annotation. When
a click event is intercepted in a snake or overlay, a
popover is displayed at the annotation’s location con-
taining all of its fields in editable components, so
users can freely edit annotation’s details without leav-
ing the dashboard or losing view of the data.
As Figure 5 also shows, when two annotations in-
tersect over one another by overlapping on the same
segment of time, two output encodings may occur: if
the annotations are covering different series, the two
snakes tracing over different curves will be sufficient
to visually differentiate the two annotations; if the an-
notation are overlapping on the same series, one of
the snakes assumes a wider radius in order to nest the
other, keeping both in view and with clickable areas.
Y = v
a
+ (X −t
a
) / (t
b
− t
a
) · (v
b
− v
a
) (2)
Dygraphs renders all series, x and y axis, and la-
bels on top of a Hypertext Markup Language (HTML)
2D Canvas
35
, which exposes enough functionality to
paint the desired snakes. Every visible data point is
matched with the timestamps of annotations in order
to find the exact start and end coordinates in the Doc-
ument Object Model (DOM)
36
. When these times-
tamps are set to a x coordinate without any actual
data points, the y value is determined through inter-
polation. By using the previous data point a and the
next data point b, with timestamps t
a
and t
b
and val-
ues v
a
and v
b
respectively, (2) can be used to obtain
an interpolated Y value for an annotation that starts,
ends, or is a point in X. Once the starting and ending
points have been determined, the snake can be drawn
by tracing a line over these and over all of the real
points in-between. When the current zoomed view
does not display the starting and/or ending points of
an annotation, the first and/or last visible data points
can respectively act as stand-ins.
3 EVALUATION
The research findings on time series storage technolo-
gies motivated the usage of InfluxDB for long-term
storage of time series, but because it would be imprac-
tical to model the remaining ontology under a time
35
https://developer.mozilla.org/en-US/docs/Web/API/
Canvas API
36
https://developer.mozilla.org/en-US/docs/Web/API/Do
cument Object Model/Introduction
Distributed and Scalable Platform for Collaborative Analysis of Massive Time Series Data Sets
49
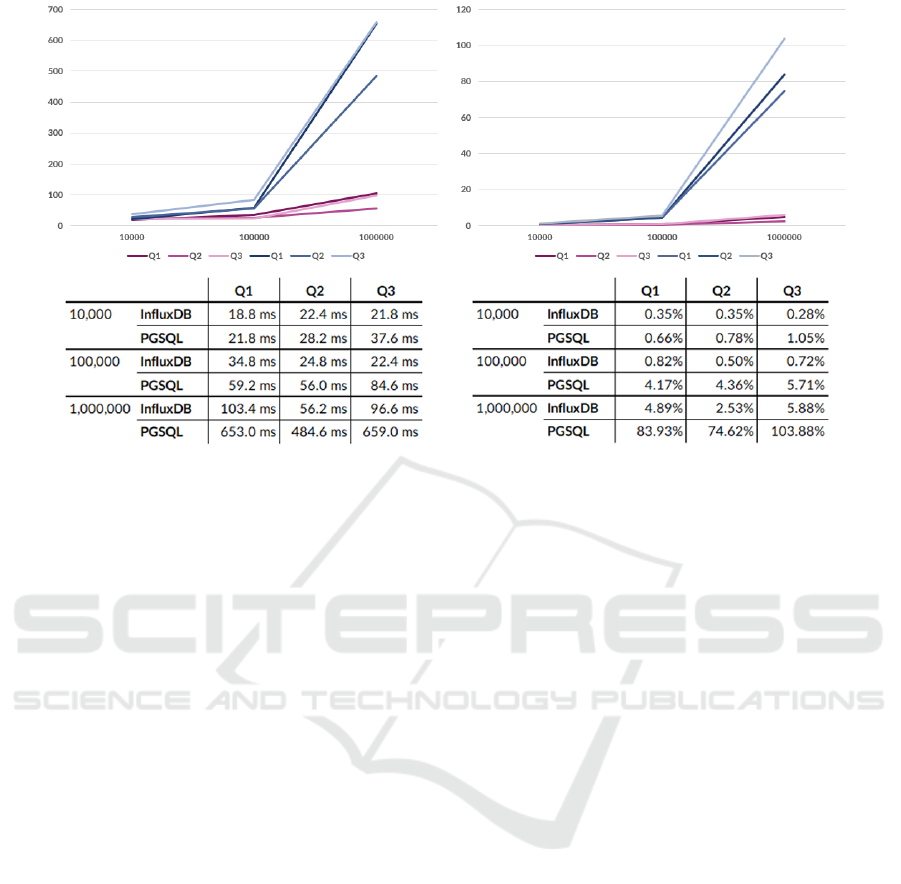
(a) Estimated time (in milliseconds) (b) CPU (in %)
Figure 6: Average request time and CPU usage observed during reads. Purple lines are InfluxDB, blue lines are PostgreSQL.
series database, the proposed solution uses a polyglot
persistence model. Although one of the major goals
is to build a system focused on High-Consistency, as
the granularity of data increases, pure Consistency be-
comes harder to attain. By reducing this granular-
ity and storing the entire data set in a single ACID-
compliant database, while modeling relationships of
time series with annotations without an ad-hoc link-
ing mechanism, then Consistency can be more easily
maintained. With this, it was important to examine
how would the implemented system behave and per-
form if both the ontology and the time series data set
were stored in the same RDBMS. The goal of these
tests was to potentially recognize a threshold in which
a performance drop could still be an acceptable trade-
off to gain in reads (where series and annotations
could be polled simultaneously through joins) and in
writes (where one single transaction would propagate
changes to annotations and series atomically).
A new series entity was modeled in Hibernate, fol-
lowing the same model of its InfluxDB point coun-
terpart. The structured series query object was re-
appropriated into this new architecture, converting the
same criterias into a JPQL statement instead of an In-
fluxQL one. All tests were executed using the same
deployment conditions (a single server node with
a 2.50GHz Quad-Core processor and 16GB RAM
memory, bypassing the load balancer and the In-
fluxDB write request FIFO queue) and the exact same
three queries. Using a segment of time that is never
changed, three source-measurement pairs P
1
, P
2
and
P
3
, of which P
1
and P
2
have the same measurement
and P
2
and P
3
have the same source, and of which P
1
and P
2
contain numeric values and P
3
contains state
values, then the evaluated queries are as follows: Q1)
get all three pairs; Q2) get the same three pairs, but
P
1
> 4, P
2
≤ 2, and P
3
= true; Q3) get the same
three pairs, but all pairs are globally filtered by an
annotation and annotation type. All of these queries
were executed over twenty times for both architec-
tures, and observed for data sets with ten thousand
(10,000), a hundred thousand (100,000), and a mil-
lion (1,000,000) points.
The benchmark results in Figure 6 show that for
the smallest data set of ten thousand points, CPU us-
age and elapsed query speed do not differ severely
between the two databases. Therefore, this new ar-
chitecture would be a better option for smaller data
sets. However, for any data set with a hundred thou-
sand data points or more, InfluxDB outperforms Post-
greSQL in both query speed and CPU requirements.
As the data set grows, PostgreSQL request time and
CPU usage increases drastically, making it a less scal-
able option. Moreover, the benchmark results in Ta-
ble 1 show that InfluxDB has a higher throughput for
insertions and better on-disk compression than Post-
greSQL, making it more ideal for long-term storage.
Despite applying strong data compression, InfluxDB
delivers better read performance due to its memory-
cached aggregated rollups, leading to a higher RAM
memory requirement.
In sum, the added value of the relational MVCC
model of PostgreSQL does not balance out its major
drop off in performance for massive data sets. Be-
DATA 2019 - 8th International Conference on Data Science, Technology and Applications
50
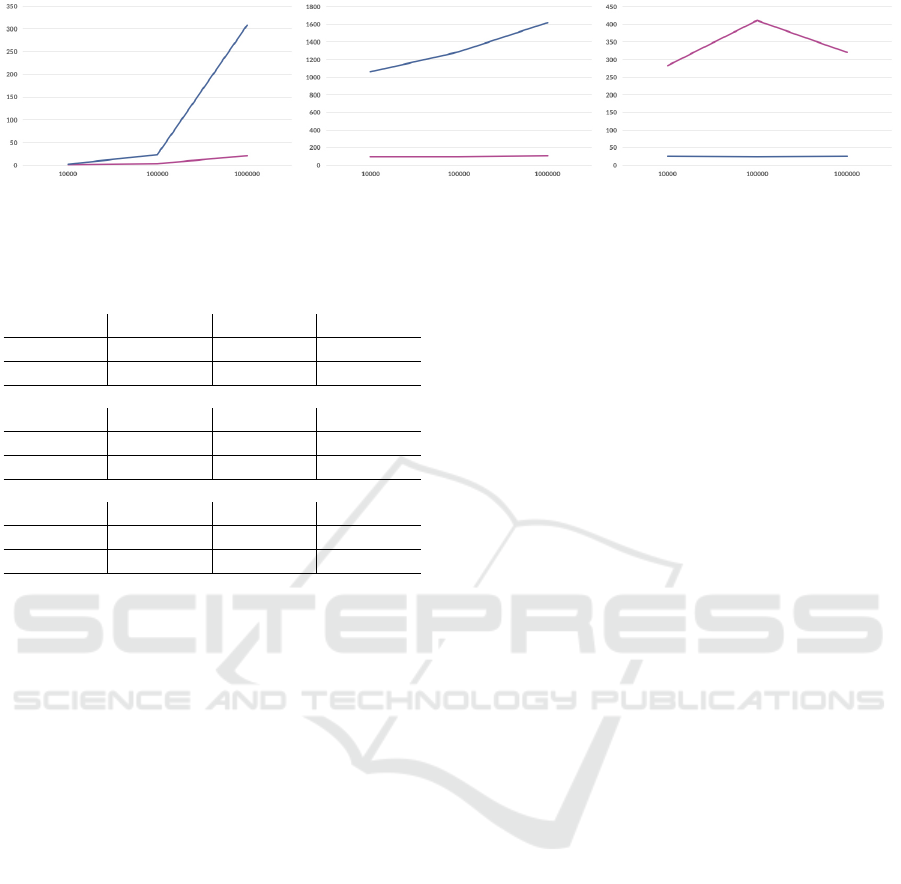
(a) Estimated time (in seconds)
(b) Disk usage (in MB) (c) RAM usage (in MB)
Figure 7: Write performance as the data set size increases. Purple lines are InfluxDB, blue lines are PostgreSQL.
Table 1: Average insertion time, disk usage and RAM mem-
ory usage observed during writes.
10,000 Time Disk RAM
InfluxDB 875.9 ms 93.36 MB 283.5 MB
PGSQL 2.945 s 1.064 GB 25.33 MB
100,000 Time Disk RAM
InfluxDB 3.480 s 97.46 MB 412 MB
PGSQL 23.26 s 1.288 GB 24.61 MB
1,000,000 Time Disk RAM
InfluxDB 21.40 s 108.3 MB 320.9 MB
PGSQL 5.139 min 1.624 GB 25.93 MB
cause the platform should be scalable to growing data
sets of time series, InfluxDB stands out as the bet-
ter solution. However, it is important to note that In-
fluxDB is always at a low data cardinality throughout
all of the tests. If this cardinality were to also increase
linearly over time, InfluxDB performance would drop
dramatically due to its reliance on the time-structured
LSM merge tree (Freedman, 2018).
4 CONCLUSION
The solution presented in this paper provides im-
proved analysis tools, stronger annotation readabil-
ity and flexibility of expression, and higher scala-
bility for both massive data sets and heavy network
traffic. This solution also reinforces a strong collab-
orative framework of reliable contributions that are
highly consistent, strongly validated by their coher-
ence with other entities, and versioned. Moreover, the
frontend application can display different scopes of
analysis under both the shared-space model and the
split-space model, enabling users to visually recog-
nize similar patterns in different locations of the data
set. All of these features combined facilitate analyti-
cal and knowledge-building tasks by human collabo-
rators, improving productivity and saving them time.
The proposed model as-is establishes a open,
modular architecture that enables complex task work-
flows to be set up while using the platform’s knowl-
edge base and annotation capabilities. Additional
modules could be connected with the REST API in
order to collect the existing annotations and deliver
them into information extraction systems, machine-
learning models or deep neural networks, and to in-
put additional time series or annotation data from ex-
ternal systems, dictionaries or real-time data streams.
By taking advantage of the acquired know-how, the
work presented in this paper serves as a foundation to
arrive at a more mature software tool with increased
usefulness in other domains.
ACKNOWLEDGEMENTS
The present study was developed in the scope of
the Smart Green Homes Project [POCI-01-0247-
FEDER-007678], a co-promotion between Bosch
Termotecnologia S.A. and the University of Aveiro. It
is financed by Portugal 2020 under the Competitive-
ness and Internationalization Operational Program,
and by the European Regional Development Fund.
REFERENCES
Abadi, D. (2012). Consistency tradeoffs in modern dis-
tributed database system design: Cap is only part of
the story. Computer, 45(2):37–42.
Adnan, M., Just, M., and Baillie, L. (2016). Investigating
time series visualisations to improve the user expe-
rience. In Proceedings of the 2016 CHI Conference
on Human Factors in Computing Systems, CHI ’16,
pages 5444–5455, New York, NY, USA. ACM.
Bader, A., Kopp, O., and Falkenthal, M. (2017). Survey
and comparison of open source time series databases.
In Mitschang, B., Nicklas, D., Leymann, F., Schning,
H., Herschel, M., Teubner, J., Hrder, T., Kopp, O., and
Wieland, M., editors, Datenbanksysteme fr Business,
Technologie und Web (BTW 2017) - Workshopband,
pages 249–268, Bonn. Gesellschaft fr Informatik e.V.
Distributed and Scalable Platform for Collaborative Analysis of Massive Time Series Data Sets
51

Bar-Or, A., Healey, J., Kontothanassis, L., and Thong, J.
M. V. (2004). Biostream: a system architecture for
real-time processing of physiological signals. In The
26th Annual International Conference of the IEEE En-
gineering in Medicine and Biology Society, volume 2,
pages 3101–3104.
Blount, M., Ebling, M., Eklund, J., James, A., Mc-
gregor, C., Percival, N., Smith, K., and Sow, D.
(2010). Real-time analysis for intensive care: Devel-
opment and deployment of the artemis analytic sys-
tem. IEEE Engineering in Medicine and Biology Mag-
azine, 29(2):110–118.
Cleveland, W. S. and McGill, R. (1984). Graphical per-
ception: Theory, experimentation, and application to
the development of graphical methods. Journal of the
American Statistical Association, 79(387):531–554.
Eltabakh, M. Y., Aref, W. G., Elmagarmid, A. K., Ouz-
zani, M., and Silva, Y. N. (2009). Supporting anno-
tations on relations. In Proceedings of the 12th Inter-
national Conference on Extending Database Technol-
ogy: Advances in Database Technology, EDBT ’09,
pages 379–390, New York, NY, USA. ACM.
Fielding, R. (2000). Representational state transfer. Ar-
chitectural Styles and the Design of Netowork-based
Software Architecture, pages 76–85.
Freedman, M. (2018). Timescaledb vs. influxdb: purpose
built differently for time-series data.
Fu, T.-c. (2011). A review on time series data min-
ing. Engineering Applications of Artificial Intelli-
gence, 24(1):164 – 181.
Gilbert, S. and Lynch, N. (2002). Brewer’s conjecture
and the feasibility of consistent, available, partition-
tolerant web services. SIGACT News, 33(2):51–59.
Guyet, T., Garbay, C., and Dojat, M. (2007). Knowledge
construction from time series data using a collabora-
tive exploration system. Journal of Biomedical Infor-
matics, 40(6):672 – 687. Intelligent Data Analysis in
Biomedicine.
Hadavandi, E., Shavandi, H., and Ghanbari, A. (2010). In-
tegration of genetic fuzzy systems and artificial neu-
ral networks for stock price forecasting. Knowledge-
Based Systems, 23(8):800 – 808.
Hampton, L. (2018). Eye or the tiger: Benchmarking cas-
sandra vs. timescaledb for time-series data.
Healy, P. D., O’Reilly, R. D., Boylan, G. B., and Morri-
son, J. P. (2010). Web-based remote monitoring of
live eeg. In The 12th IEEE International Conference
on e-Health Networking, Applications and Services,
pages 169–174.
Healy, P. D., O’Reilly, R. D., Boylan, G. B., and Morri-
son, J. P. (2011). Interactive annotations to support
collaborative analysis of streaming physiological data.
In 2011 24th International Symposium on Computer-
Based Medical Systems (CBMS), pages 1–5.
Hochheiser, H. and Shneiderman, B. (2004). Dynamic
query tools for time series data sets: Timebox widgets
for interactive exploration. Information Visualization,
3(1):1–18.
Jensen, S. K., Pedersen, T. B., and Thomsen, C. (2017).
Time series management systems: A survey. IEEE
Transactions on Knowledge and Data Engineering,
29(11):2581–2600.
Kalogeropoulos, D. A., Carson, E. R., and Collinson, P. O.
(2003). Towards knowledge-based systems in clinical
practice: Development of an integrated clinical infor-
mation and knowledge management support system.
Computer Methods and Programs in Biomedicine,
72(1):65 – 80.
Keim, D. A., Mansmann, F., Schneidewind, J., and Ziegler,
H. (2006). Challenges in visual data analysis. In
Tenth International Conference on Information Visu-
alisation (IV’06), pages 9–16.
Keraron, Y., Bernard, A., and Bachimont, B. (2009). Anno-
tations to improve the using and the updating of digital
technical publications. 20:157–170.
Kiefer, R. (2017). Timescaledb vs. postgres for time-series:
20x higher inserts, 2000x faster deletes, 1.2x-14,000x
faster queries.
Kreps, J. (2013). The log: What every software engineer
should know about real-time data’s unifying abstrac-
tion.
Laney, D. (2001). 3d data management: Controlling data
volume, variety and velocity.
Liang, J. and Huang, M. L. (2010). Highlighting in infor-
mation visualization: A survey. In 2010 14th Inter-
national Conference Information Visualisation, pages
79–85.
Mathe, Z., Haen, C., and Stagni, F. (2017). Monitoring per-
formance of a highly distributed and complex comput-
ing infrastructure in lhcb. In Journal of Physics: Con-
ference Series, volume 898, page 092028. IOP Pub-
lishing.
Momjian, B. (2018). Mvcc unmasked.
ONeil, P., Cheng, E., Gawlick, D., and ONeil, E. (1996).
The log-structured merge-tree (lsm-tree). Acta Infor-
matica, 33(4):351–385.
O’Reilly, R. D. (2015). A distributed architecture for the
monitoring and analysis of time series data.
Pressly, Jr., W. B. S. (2008). Tspad: A tablet-pc based ap-
plication for annotation and collaboration on time se-
ries data. In Proceedings of the 46th Annual Southeast
Regional Conference on XX, ACM-SE 46, pages 527–
528, New York, NY, USA. ACM.
Sow, D., Biem, A., Blount, M., Ebling, M., and Verscheure,
O. (2010). Body sensor data processing using stream
computing. In Proceedings of the International Con-
ference on Multimedia Information Retrieval, MIR
’10, pages 449–458, New York, NY, USA. ACM.
DATA 2019 - 8th International Conference on Data Science, Technology and Applications
52
