
Assessment of Extreme Surge Simulation Accuracy in the Sea of Azov
for Various Types of Atmospheric Forcing and Ocean Model
Parameters
Vladimir Fomin
1a
, Nikolay Diansky
1,2,3 b
, Evgeniya Korshenko
1c
and Irina Panasenkova
1d
1
Department of Numerical Modelling of Hydrophysical processes, Zubov State Oceanographic Institute, Moscow, Russia
2
Faculty of Physics, M. V. Lomonosov Moscow State University, Moscow, Russia
3
Institute of Numerical Mathematics, Russian Academy of Sciences, Moscow, Russia
Keywords: Azov Sea, Numerical Modelling, Atmospheric and Marine Circulation Models, Storm Surge.
Abstract: This paper focuses on numerical modelling of an extreme surge in the Taganrog Gulf on March 24, 2013 to
study its formation features and identify the requirements for an accurate reproduction of atmospheric and
marine circulation in the Sea of Azov. Two versions of the three-dimensional σ-model of marine circulation
INMOM (Institute of Numerical Mathematics Ocean Model) with different spatial resolutions of ~4 km and
~250 m were originally used. Additionally, two types of atmospheric forcing were used during the simulations
of these models: Era-Interim reanalysis and WRF (Weather Research and Forecast Model) model data. The
paper shows that, according to the obtained results, the accuracy of an extreme surge reproduction in the Sea
of Azov was more dependent on the quality of atmospheric forcing than on the spatial resolution of the marine
circulation model. Additional simulations were performed with three different configurations within the
INMOM version with a spatial resolution of ~250 m and with the use of the WRF atmospheric forcing.
Configurations varied in types of the model: baroclinic, barotropic and shallow water approximation.
However, simulation results of the models with different configurations were practically identical to each
other.
1 INTRODUCTION
The Sea of Azov with its coastal cities, intensive
navigation, developed fishing and recreational
potential has great economic importance. Therefore,
forecasting of extreme storms in it is especially
valuable. It should be noted that the strongest impact
of the storm on economic activities is connected to
the sea level fluctuations in the Sea of Azov due to
surges. Nowadays, numerical modelling is a widely
applied approach for their simulation. Although it has
reached high level of accuracy for the Sea of Azov
(Popov and Lobov, 2016; Filippov, 2012), further
attempts to improve the accuracy of simulation results
should still be made. Numerical modeling results
depend on various factors, especially on the use of
a
https://orcid.org/0000-0001-8857-1518
b
https://orcid.org/0000-0002-6785-1956
c
https://orcid.org/0000-0003-2310-9730
d
https://orcid.org/0000-0002-8338-4825
atmospheric forcing and a configuration of the marine
hydrodynamics model with its physical
parametrizations and spatial resolution. This article
examines these factors and their influence on the
simulation results with numerical modelling of an
extreme surge that occurred on March 24, 2013.
According to the data from a series of observations
for 1881-2013, this surge is the second strongest after
the historical surge of 1997. Observational data for
the surge of 2013 is available and can be used for the
appropriate setting up and verification of models. In
the present study, several versions of the three-
dimensional σ-model of marine circulation INMOM
(Institute of Numerical Mathematics Ocean Model)
with different spatial resolution and various types of
model configurations are used as models of sea
340
Fomin, V., Diansky, N., Korshenko, E. and Panasenkova, I.
Assessment of Extreme Surge Simulation Accuracy in the Sea of Azov for Various Types of Atmospheric Forcing and Ocean Model Parameters.
DOI: 10.5220/0007836603400344
In Proceedings of the 5th International Conference on Geographical Information Systems Theory, Applications and Management (GISTAM 2019), pages 340-344
ISBN: 978-989-758-371-1
Copyright
c
2019 by SCITEPRESS – Science and Technology Publications, Lda. All rights reserved

dynamics. During simulations of these models two
types of atmospheric forcing are used.
2 METHODOLOGY
Three-dimensional σ-coordinate model of marine
circulation INMOM is used to calculate the
circulation in the Sea of Azov. It was developed at the
INM RAS (Institute of Numerical Mathematics of the
Russian Academy of Sciences) (Diansky, 2013). The
model is based on so called system of primitive
equations in approximations of hydrostatics and
Boussinesq expressed in the generalized orthogonal
coordinates in horizontal direction and in σ-system of
coordinates in vertical direction. Such system with an
additional applied linearization is of the following
form:
−
(
+
)
= −
1
+
1
−
+
+
(1)
+
(
+
)
= −
1
+
1
−
+
+
(2)
+
1
=
1
(3)
=
++
(4)
=
+
(5)
=
(
,+35‰,
)
−
(
0,0,
)
(6)
Here – depth of the ocean being at rest;
and
–
metrical coefficients, =(,) – horizontal
velocity vector, and – zonal and meridional
components of the current velocity; – vertical
velocity in the – system of coordinates; –
deviation of the ocean level from its undisturbed
state; – potential temperature; – penetrating solar
radiation flow; – salinity net of the constant value
of 35‰; – deviation of the water density from a
certain average density profile which depends only on
the hydrostatic pressure
with the average
density in the ocean
= 1.025/
at the depth
= . Non-linear state equation
(
, +
35‰,
)
for the water density computation,
considering compressibility due to the hydrostatic
pressure
, is taken from (Brydon, 1999). Coriolis
parameter is =2Ω
, where Ω
– angular rate of
the Earth rotation considering the annual rotation
around the Sun, and – geographical latitude; –
summand which describes the additional pulse
transfer in curvilinear coordinates;
- atmospheric
pressure on the ocean surface; .
,
– coefficients
of vertical turbulent viscosity and diffusion;
and
– components of the horizontal pressure gradient;
,
– operators of transfer; – operator of lateral
diffusion of heat and salt which is chosen to be equal
for and .
Various versions of this model were successfully
used in numerical simulations of the World Ocean
circulation (Gusev and Diansky, 2014; Diansky, 2013),
as well as for the circulation in the western seas of the
Russian Arctic (Diansky et al., 2014, Diansky et al.,
2015), the Black, Caspian, Japanese and Baltic Seas
(Diansky et al., 2012; Zakharchuk et al., 2016;
Stepanov et al., 2014; Zalesny et al., 2012). The global
version of INMOM serves as an oceanic block of the
Earth system model created at INM RAS, participating
in international programs for research and prediction of
climate change (Volodin et al., 2013).
This paper used two versions of the INMOM
model for reproducing the Sea of Azov circulation:
the BAMS model, which includes basins of the Black,
Azov and Marmara Seas with a horizontal resolution
of ~ 4 km, and the AS model, which includes the Sea
of Azov basin with the Kerch Strait and the adjacent
waters of the Black Sea (up to about 100 m) with a
horizontal resolution of ~250 m. Fomin and Diansky
(2018) provide a detailed description of BAMS and
AS models’ configurations and physical
parametrizations.
3 RESULTS AND DISCUSSION
3.1 Analysis of the Impact of the
Atmospheric Forcing and the
Spatial Resolution of the INMOM
Model on the Sea of Azov
Circulation
The quality of atmospheric forcing is one of the key
factors affecting the accuracy of marine dynamics’
calculation. Therefore, two different types of an atmos-
pheric forcing were used to calculate the atmospheric
impact: one was from the Era-Interim global
atmospheric reanalysis with spatial resolution of 80 km
Assessment of Extreme Surge Simulation Accuracy in the Sea of Azov for Various Types of Atmospheric Forcing and Ocean Model
Parameters
341
and the other one was from the regional atmospheric
model WRF with spatial resolution of 10 km,
calculated at the Zubov State Oceanographic Institute.
Module and components of wind speed with a
resolution of 6 hours from the coastal weather stations
in Taganrog and Kerch were used to validate obtained
results of calculations using the WRF model and the
Era-Interim reanalysis. Detailed results of this
verification were discussed in the work of Fomin and
Diansky (2018). Verification results of
meteorological characteristics showed that, in
comparison with the Era-Interim reanalysis, the data
in the WRF model reproduced meteorological
characteristics over the Sea of Azov Sea more
accurately, especially during storms.
We used both versions of the INMOM model,
BAMS and AS models, for the simulation of the 2013
surge in the Taganrog Gulf with meteorological
parameters from the Era-Interium reanalysis, as well
as the WRF model. Experiments were carried out for
the period from January 1 till March 31, 2013. We
used January climatic fields of temperature and
salinity, and zero current velocity fields as initial
conditions. Moreover, it was assumed that there was
no ice field in the Sea of Azov.
The AS model with a spatial resolution of 250 m
was applied for simulation of the Sea of Azov
dynamics using Era-Interium reanalysis, as well as
WRF atmospheric characteristics. We only used the
WRF data in the numerical experiments with the
BAMS model with a spatial resolution of 4 km. We
used sea level observations at the Taganrog station in
order to estimate the accuracy of simulated sea level,
especially during the storm situations, using AS and
BAMS models.
At first, we analysed the results from the AS
model, as an a priori more accurate model because of
its higher spatial resolution, and assessed the impact
of the atmospheric forcing type on the reproduction
of the storm surge in the Sea of Azov. Hereinafter, the
analysis was carried out for the sea level deviation
from the average value. The average value was
calculated for the period of 01.02 - 03.31.2013.
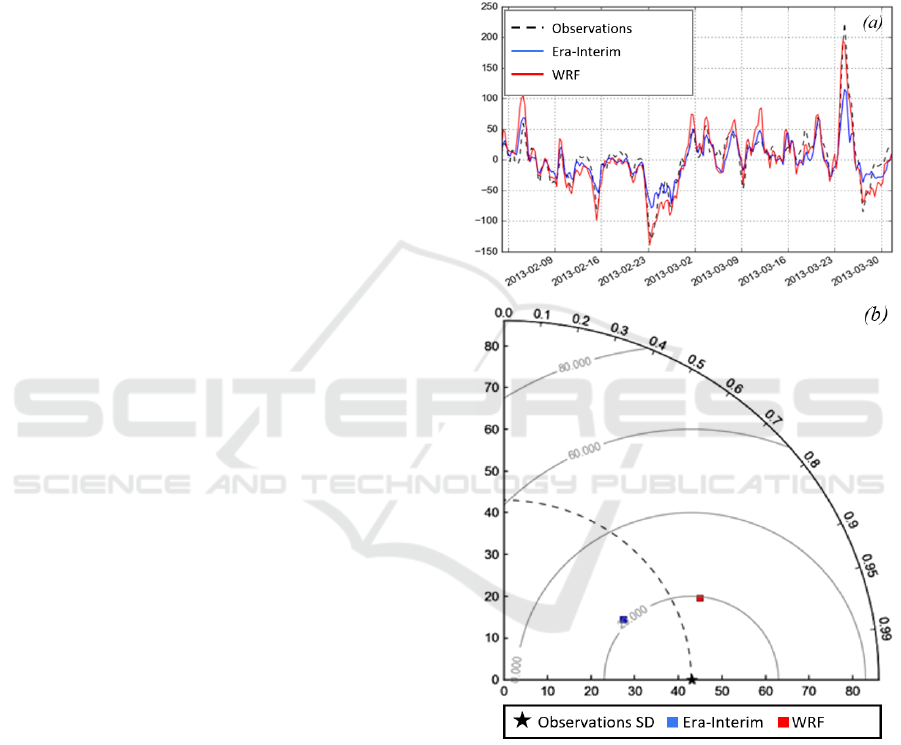
Figure 1 shows verification results of the
modelled sea level using the AS model with
atmospheric characteristics from the Era-Interim
reanalysis and from the WRF model, as well as the
observation data from the Taganrog station.
According to the calculation results, sea level during
the extreme surge on 24.03.2013 was more accurately
reproduced with the WRF model data. The maximum
value of the sea level using WRF forcing for the
Taganrog station was 194.7 cm. At the same time, the
maximum sea level according to the observations
reached 223.4 cm. The correlation coefficient
reached 0.92 for the WRF data, and equaled 0.88 for
the data from the Era-Interim reanalysis. However,
the standard deviation of the sea level was smaller for
the WRF data than for the Era-Interim data: 19.8 cm
and 21.3 cm, respectively.
Thus, calculations using WRF forcing made it
possible to improve the storm surge simulation and
the quality of the sea level variability.
Figure 1: a) Comparison between the sea level observations
from the Taganrog station (black line) and the sea level
simulated by the AS model using Era-Interium reanalysis
(blue line) and the WRF data (red line); b) the Taylor
diagram for the experiments. Black star corresponds to the
standard deviation for measurement data; blue square – Era-
Interium reanalysis; red square – WRF model.
Therefore, WRF forcing was more suitable for the
simulation of the storm surge in 2013. For this reason,
the research of the horizontal resolution of two
versions of the INMOM model (AS and BAMS
ONM-CozD 2019 - Special Session on Observations and Numerical Modeling of the Coastal Ocean Zone Dynamics
342
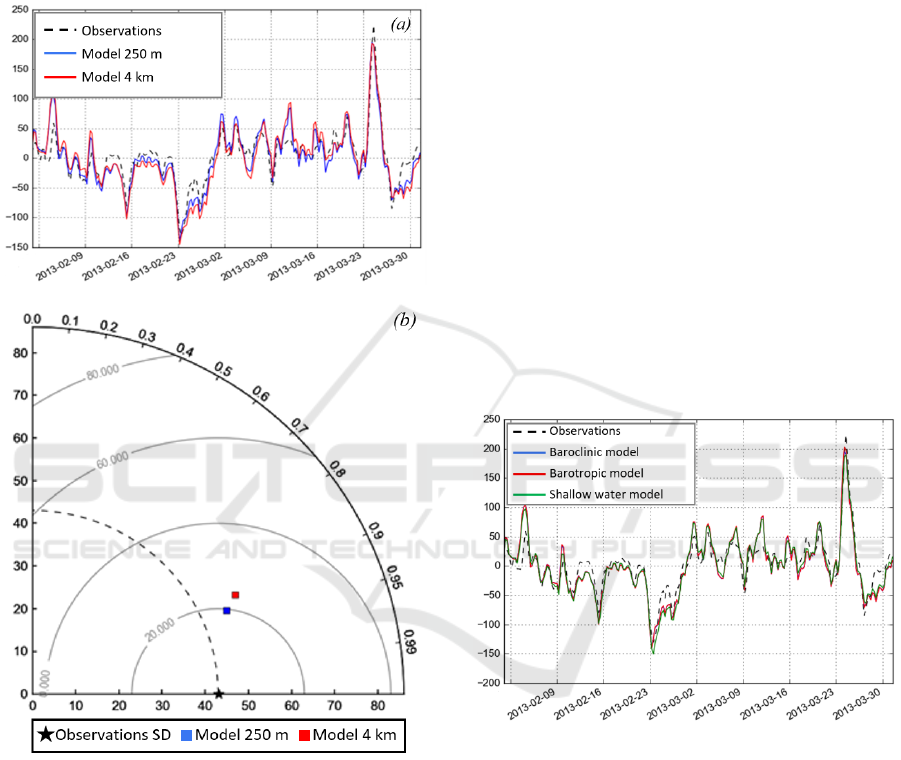
models) was carried out using meteorological
parameters from the WRF model. Results of the
verification of the simulated data with observation
data showed that the AS model with horizontal
resolution of 250 m reproduced sea level slightly
better (Figure 2).
Figure 2: a) Comparison between the sea level observations
from the Taganrog station (black line) and sea level
simulated by the AS model (blue line) and by the BAMS
model (red line); b) the Taylor diagram for the considered
experiments. Black star corresponds to the standard
deviation for measurement data; blue square –for the AS
model; red square – for the BAMS model.
3.2 Effects of the INMOM
Configuration on the Azov Sea
Circulation
One more experiment was conducted in order to
estimate the influence of the INMOM model
configuration on the quality of simulated
hydrodynamical parameters.
We conducted a comparative analysis of the sea
level calculated for the period from February 1 until
March 31, 2013, using three methods of numerical
modelling: three-dimensional baroclinic version of
the INMOM model, three-dimensional barotropic
version of the INMOM model and shallow water
model implemented in the INMOM. In the barotropic
model prognostic variables included current velocity
and sea level. It was also assumed that the density
gradients did not vary.
Figure 3 shows the results of the sea level
calculations using three versions of the INMOM
model with a spatial resolution of 250 m.
Meteorological characteristics were taken from the
WRF model. According to the Figure 3, the results of
calculations were almost identical. All models
realistically described main trends in the sea level
variability. In general, the three model versions
adequately reproduced the sea levels. Although the
storm surge on the March 24, 2013 in the Taganrog
Bay was underestimated by all of them, the shallow
water model performed worse than other models.
Figure 3: Sea level calculated using baroclinic INMOM
model (blue line), barotropic INMOM model (red line) and
shallow water model (green lone) from 01.02.2013 till
31.03.2013 in the Taganrog Bay of the Sea of Azov.
The experiments’ results showed that the non-
hydrostatic WRF model calculations of the
atmospheric forcing allowed reproducing extreme
storm situations with higher accuracy than the Era-
Interim reanalysis. A comparison of the results with
observational data demonstrated that both the
meteorological characteristics, including wind speed
and direction, and the sea level variability were
reproduced well. Therefore, the proposed approach
can be used in the future to predict and prevent
emergencies in the studied area of the Sea of Azov.
Assessment of Extreme Surge Simulation Accuracy in the Sea of Azov for Various Types of Atmospheric Forcing and Ocean Model
Parameters
343

4 CONCLUSIONS
We examined the basic features of an extreme surge
in the Taganrog Gulf on March 24, 2013 using two
versions of the INMOM model with different spatial
resolutions of ~4 km and ~250 m. Two types of
meteorological parameters were used to study the
impact of the atmospheric forcing on the Sea of Azov
dynamics: Era-Interim reanalysis with horizontal
resolution of 80 km and WRF model data with
horizontal resolution of 10 km.
We demonstrated that the simulation based on
the WRF atmospheric forcing with a higher spatial
resolution reproduced the extreme surge with higher
accuracy than the simulation based on the Era-
Interim reanalysis. At the same time, the results of
the sea level simulation during the non-extreme
period did not depend much on the type of
atmospheric forcing.
For the area of the Taganrog Gulf, increased
spatial resolution of the marine circulation model
slightly improved the quality of the extreme surge
reproduction, particularly in the coastal areas.
However, this improvement of the model amounted
to no more than 3-5%. Therefore, the formation of the
surge was mainly determined by the response of the
circulation in the entire Sea of Azov basin to the
atmospheric forcing.
Additionally, we carried out the experiments
with various configurations of the INMOM model to
study the effect of baroclinicity on the storm surge
reproduction in 2013. Three versions of the INMOM
model with spatial resolution of 250 m were used for
these experiments: the baroclinic model, the
barotropic model and shallow water model. As
expected, for such a shallow basin as the Sea of
Azov, the baroclinic factor had a negligible impact
on the storm surges reproduction. Thus, simplified
models would be suitable for calculating surge
levels only. However, if the task was to reproduce
the full hydrodynamics of the Sea of Azov,
including sea ice, then it was necessary to use
complex models of the sea circulation with high
quality atmospheric forcing.
ACKNOWLEDGEMENTS
This work was supported by the Russian Foundation
for Basic Research according to the research project
№17-05-41089.
REFERENCES
Brydon D., San S., Bleck R., 1999. A new approximation
of the equation of state for sea water, suitable for
numerical ocean models. J. Geophys. Res., 104(C1):
1537–1540.
Diansky, N. A., 2013. Modelling of the ocean circulation
and study of its response to short-term and long-term
atmospheric forcing. 1
st
ed. Physmatlit, Moscow. (in
Russian)
Diansky, N. A., Gusev A. V., Fomin V. V., 2012. The
Specific Features of Pollution Spread in the North west
Pacific Ocean. Izvestiya, Atmospheric and Oceanic
Physics, 48(2): 222-240.
Diansky, N. A., Fomin, V. V., Kabatchenko, I. M.,
Gruzinov, V. M., 2014. Simulation of Circulation in the
Kara and Pechora Seas with the System for Operational
Diagnosis and Forecasting of Marine Dynamics.Arctic:
Ecology and Economy, 1(13): 57-73. (in Russian)
Diansky, N. A., Kabatchenko, I. M., Fomin, V. V.,
Arkhipov, V. V., Tsvetsinskii, A. S., 2015. Simulation
of Hydrometeorological Characteristics in the Kara and
Pechora Seas and Computation of Sediments near the
Western Coast of the Yamal Peninsula. Vesti Gazovoi
Nauki, 2(22): 98-105. (in Russian)
Filippov, Yu. G, 2012. Natural fluctuations of the Sea of
Azov level. Russian meteorology and hydrology,-2:
126-129. doi: 10.3103/S1068373912020082
Fomin, V. V., Diansky, N. A., 2018. Simulation of Extreme
Surges in the Taganrog Bay with Atmosphere and
Ocean Circulation Models. Russian Meteorology and
Hydrology, 43(12): 843-851.
Gusev, A. V., Diansky, N. A, 2014. Numerical Simulation
of the World Ocean Circulation and Its Climatic
Variability for 1948–2007 Using the INMOM.
Izvestiya, Atmospheric and Oceanic Physics, 50: 1-12.
Popov, S. K., Lobov, A. L., 2016. Diagnosis and
Forecasting of the Flood in Taganrog Using an
Operational Hydrodynamic Model. Trudy
Gidromettsentra Rossii, 362: 92-108. (n Russian)
Stepanov, D. V., Diansky, N. A, Novotryasov, V. V., 2014.
Numerical Simulation of Water Circulation in the
Central Part of the Sea of Japan and Study of Its Long-
term Variability in 1958–2006. Izvestiya, Atmospheric
and Oceanic Physics, 50(1): 73-84.
Volodin, E. M., Diansky, N. A., Gusev, A. V., 2013.
Simulation and Prediction of Climate Changes in the
19th to 21st Centuries with the Institute of Numerical
Mathematics, Russian Academy of Sciences, Model of
the Earth’s Climate System. Izvestiya, Atmospheric and
Oceanic Physics, 49(4): 347-366.
Zakharchuk, E. A., Tikhonova, N. A, Gusev, A. V.,
Diansky, N. A., 2016. Comparison of Methods for
Numerical Hydrodynamic Modeling of the Baltic Sea
Level Fluctuations. Trudy GOIN, 217. (in Russian).
Zalesny, V. B., Diansky, N. A, Fomin, V. V., Moshonkin,
S.N., Demyshev, S.G., 2012. Numerical Model of the
Circulation of the Black Sea and the Sea of Azov. Russ.
J. Num. Anal. and Math. Model, 27(1): 95-112.
ONM-CozD 2019 - Special Session on Observations and Numerical Modeling of the Coastal Ocean Zone Dynamics
344
