
The Use of the Decision Support System to Control Bicycle
Transportation
Irina Makarova
1a
, Aleksey Boyko
1b
, Eduard Tsybunov
1
, Krzysztof Żabiński
2c
and Kuanysh Abeshev
3d
1
Kazan Federal University, Syuyumbike prosp., 10a, 423822 Naberezhnye Chelny, Russian Federation
2
Institute of Computer Science, University of Silesia, Katowice, Poland
3
School of Engineering Management, Almaty Management University, Rozybakiyeva st., 227, 050060, Almaty, Kazakhstan
Keywords: Bicycle Sharing System, Road Safety, Ecological Efficiency.
Abstract: City transport problems that today exist practically everywhere require from city authorities together with
scientists to develop new ways of ensuring transport system’s sustainability. One of such ways is promotion
of non-motorised transport among the population. However, such problems as the lack of necessary bicycle
infrastructure and the vulnerability of cyclists prevent population from shifting to non-motorised modes of
transport. Authors have considered existing positive experience of implementing bicycles into city transport
systems and came to the conclusion that the identified problems should be solved in a comprehensive manner.
For this, authors suggest the Decision Support System (DSS) that will help to plan the development of bicycle
infrastructure and to evaluate its efficiency and safety. Moreover, the proposed DSS allows building possible
cycling routes and choosing the best one on the base of their road and ecological safety calculation.
1 INTRODUCTION
The problems caused by the urbanization growth and
the need to ensure the population’s safe mobility and
the goods transportation have led to the strategies
emergence to improve the safety and sustainability of
the transport systems of cities and countries. These
strategies include measures both on the choice of
vehicles that meet safety requirements and on the
infrastructure development more friendly to traffic
participants. The measures indicated in these
strategies can be clustered according to various
criteria. According to the influence method, these are
technical measures, that is, those associated with
technical effects on systems, managerial, involving
effects on the management object, and socio-
psychological, associated with the human factor.
Digitalization and intellectualization of industries and
activity areas brings a decision-making new level in
the complex systems management. This provides
increased efficiency, safety and sustainability of such
a
https://orcid.org/0000-0002-6184-9900
b
https://orcid.org/0000-0002-5878-8342
c
https://orcid.org/0000-0001-5051-3531
d
https://orcid.org/0000-0003-1140-7431
systems. For these purposes, a decision support
system is created that allows using intelligent tools to
verify possible solutions to a problem and select the
optimal one among them.
The city’s population mobility is provided by
different transport types, among which motor
transport, in particular using gasoline and diesel fuel,
causes the greatest harm to the environment.
Therefore, among the measures to improve the
environmental situation in cities is the transition from
individual to public and non-motorized transport. At
the same time, public transport should become more
environmentally friendly, using cleaner fuels such as
natural gas or electricity. Cycle transport, in addition
to reducing the burden on the environment,
contributes to improving health, since physical
activity reduces the risk of diabetes, obesity and
cardiovascular diseases. Despite the obviousness of
such changes in the transport systems of cities and
megalopolis, there are problems that need to be
addressed in order for these changes to be effective.
Makarova, I., Boyko, A., Tsybunov, E., Å
˙
zabiÅ
ˇ
Dski, K. and Abeshev, K.
The Use of the Decision Support System to Control Bicycle Transportation.
DOI: 10.5220/0007899806490656
In Proceedings of the 5th International Conference on Vehicle Technology and Intelligent Transport Systems (VEHITS 2019), pages 649-656
ISBN: 978-989-758-374-2
Copyright
c
2019 by SCITEPRESS – Science and Technology Publications, Lda. All rights reserved
649
The first problem is that 8% of all road fatalities
in the European Union are cyclists, although there are
significant differences between countries. Cyclists
(like pedestrians) tend to be vulnerable in traffic, so
ensuring the safety of walking and cycling is a top
priority. Real and subjectively perceived safety can
have an impact on the modal choice. This largely
relates to such the most sustainable transportation
methods as walking and cycling, as well as the of
access to public transport possibility. At the same
time, the safety of both the route itself and the
interchange node for combined routes is considered.
The needs of pedestrians, cyclists and motorcyclists,
among whom, in total, 49% of all deaths due to road
accidents in the world occur, are not given enough
attention. Improving road safety in the world will be
possible only if all approaches to road safety are taken
into care the needs of all these road users. In Paris in
2016 at a special seminar on road safety of the
International Transport Forum (Road Safety Seminar,
2016) a scientific report was presented entitled “Zero
Road Deaths and Serious Injuries: Leading a
Paradigm Shift to a Safe System”. This report
describes a paradigm shift in road safety policy, in
accordance with the system safety principles. The
safe system is based on the assumption that traffic
accidents are predictable, they can be prevented, and
you can go to zero road deaths and avoid serious
injuries. This, however, requires a fundamental
rethinking of management and the road safety policy
implementation.
2 METHODS AND MEANS OF
IMPROVING THE URBANIZED
TERRITORIES’ TRANSPORT
SYSTEMS EFFICIENCY
2.1 Non-motorized Transport and
Conditions Extending its Use
The population will prefer cycling in the event that
the clear advantage of using it is ensured. Today, in
many European cities, such as Amsterdam,
Copenhagen, Oulu, cyclists make up two thirds of all
road users. In other words, most residents of big cities
can change from car to bike. However, not everyone
can ride a bike every day, so the bike is not a
competitor, but rather complements public transport
in urban mobility. Especially great potential for
bicycles is represented by regular trips to and from
work: in London such trips by bike account for about
2.5% of all trips to work, in Berlin - 13%, in Munich
- 15%, and in Copenhagen and Amsterdam 36% and
37% respectively.
Such a high proportion of cycling trips is ensured
by the Copenhagen politicians’ priority strategy, who,
in order to create more favourable conditions for life
in the city, have chosen the bicycle infrastructure
development (Bredal, 2014). This has helped reduce
the so-called carbon footprint, which in Copenhagen
is one of the smallest in the world — less than two
tons per person. However, the Denmark capital set a
goal to become neutral in terms of emissions by 2025.
The city has approved a project to equip bicycles with
special sensors that report pollution levels and real-
time traffic congestion (Smart City, 2017).
The study of Otero et al. (2019) is dedicated to
assessing the health effects of basic BSS in Europe.
The authors estimate the annual mortality dynamics
as a result of physical activity, deaths from traffic
accidents and air pollution, by analysing four
scenarios. A quantitative model was built using data
from transport and health surveys, as well as
environmental and road safety records. The study
involved BSS users aged 18 to 64 years. As a result,
it was found that the twelve basic bicycle sharing
systems (BSS) in Europe are beneficial for health and
economy. Stimulating vehicles drivers to use the BSS
can be used as a tool for disease prevention and health
promotion.
One of the most common counterarguments
against cycling are unfavourable climatic conditions.
However, it all depends on the attitude to the bike
lanes and on their priority when cleaning snow. This
confirms the Oulu example, where the majority of
residents move on bicycles, even at temperatures
below zero during the deep winter. This is ensured by
800 km of bicycle paths (4.3 m per inhabitant), 98%
of which work in winter, since the main bike tracks
maintenance is more important than the roadway
maintenance. The tracks parallel to the roadway are
separated by a green stripe, which is also used for
snow removal. Passages were built under the busiest
intersections, and you can get anywhere in the city by
bicycle (Tahkola, 2014).
There are technical problems to integration of
bicycle transport with public transport. For example,
among the companies of carriers is not well
developed transportation of bicycles in public
transport. Consider two options for transporting
bicycles: inside and outside the bus or other transport.
Most often, such methods are not available or not
designed for use by a large number of cyclists. This is
due to the introduction of additional changes in the
design of public transport and reduce the area inside
it, which leads to additional costs for carriers. As the
LogiTrans 4.0 2019 - Special Session on Logistics and Transport in the Industry 4.0
650
Copenhagen experience shows, the expansion of the
bicycles model range designed for different
population groups and different uses can increase the
attractiveness of bicycle transport. Here you can rent
not only bicycles of familiar designs, but also such
models as: velomobile, cargobike, recumbent,
electric-assist Long John, electric bicycle (Bicycle
innovation lab, 2018).
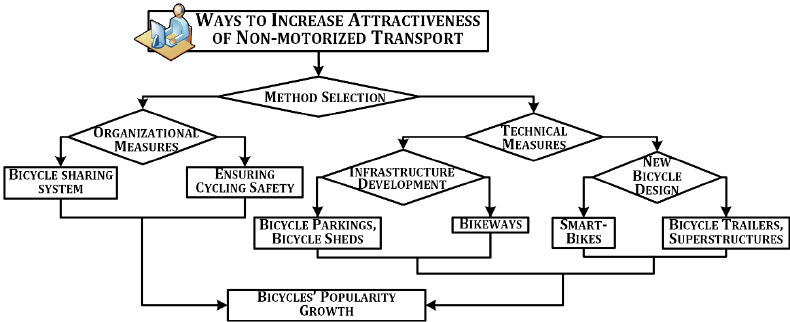
Ways to increase the attractiveness of non-
motorized transport are presented in Figure 1.
When planning a bicycle infrastructure, it is
necessary to provide for the creation of bicycle lanes,
the construction of parking areas and bicycle storage
places. It is important to take into account the area
features, as well as the population structure - the
potential cyclists’ part. Despite the large number of
reseaches in the bicycle lanes design (Parkin and
Rotheram, 2010; Larsen et al., 2013; Forsyth and
Krizek, 2011; Rybarczyk, 2014), determining the
terrain and modelling the topographic conditions for
the designed or upgraded network of bicycle paths
remains an urgent task. The most common method of
designing bicycle paths is the method of overhead
lines or shortest distances. Since, when designing a
cycle route, it is not always possible to avoid the hilly
terrain, the creation of bicycle lifts or electric drives
for a bicycle will help solve the problem of
overcoming steep ascents.
Currently, in many cities and countries where the
authorities and the population are interested in the
cycling development, strategies and development
plans for mobility are being created. Along with
technical solutions, such as the development and
expansion of the bicycle infrastructure, considerable
efforts are being made to improve the bicycle
transport management and its integration into the
general transport system of cities.
Ottomanelli et al. in their study (2019) propose an
optimization framework for planning and designing a
bicycle paths network in urban environments based
on the equity principles and taking into account the
set budget available. The novelty of the proposal lies
in the fact that the goal function is aimed at
minimizing the existing inequality between different
population groups in terms of bicycle lanes
accessibility. The proposed methodology is a reliable
DSS (Decision Support System) tool that can help
transport authorities / managers to select priority
areas for their future investments related to bicycle
infrastructure. This can help them identify cycle paths
sections with a higher priority for implementation,
especially with regard to preventing further inequality
among population groups.
For large cities, the use of bicycles is a good
solution to the last mile problem. This is one of the
options for integration into the city’s road network.
The opportunity to get to / from the public transport
stop should be provided on short sections of the path
through the development of bicycle infrastructure,
without which the integration of bicycle transport
with public transport is impossible. This will increase
the attractiveness of the bicycle as a means of
transportation for most of the population. Sharing a
bike reduces driving and increases cycling speed.
Martin and Shaheen (2014) evaluate survey data in
two US cities to find out who is moving to and from
public transport as a result of sharing bikes. The
authors analyse the socio-demographic situation
associated with the modal shift through cross tables
and four ordinal regression models. Common signs
associated with switching to public transport include
an increase in age, males, residence in areas of lower
density and longer trips to work.
The identified problems should be solved in a
comprehensive manner. In order to calculate the
effectiveness proposed options at the design stage, as
Figure 1: Measures to increase the attractiveness of non-motorized transport.
The Use of the Decision Support System to Control Bicycle Transportation
651
well as to verify the proposed solutions adequacy, it
is necessary to create a DSS, the intelligent heart of
which will be a modules’ set to solve the
abovementioned problems. Such DSS will create a
unified information space and integrate positive
experience and scientific research to optimally solve
managerial problems of the city transport system.
2.2 Bicycle Sharing Systems: Problems
and Solutions
More than 400 cities around the world have deployed
or are planning to implement BSS. However, the
factors that determine their use, and the degree of
their rebalancing, are not precisely known.
Knowledge of these factors would allow cities to
design or modify their systems for increased use
while reducing the cost of restoring balance.
Ahmadreza et al. (2017) deal with usage data
collected with the help of scenarios that record the
bicycles availability at the station level every few
minutes in urban areas of Barcelona and Seville.
These data were aggregated to the county level, and
the time dimension was aggregated to the hourly
value. This allows us to calculate indicators of arrival
and departure on a bicycle, as well as regional
rebalancing factors.
The calculations results using real BSS data in
Palma de Mallorca (Spain) are given in article of
Alvarez-Valdes et al. (2016). Authors believe that
despite the differences in systems, each has two main
components: forecasting stochastic demand and
routing, which must realize the forecast requirements
in order to ensure user satisfaction. The authors,
based on a joint analysis of these components, have
developed a procedure that automatically reads the
information in the system, predicts the requirements
for withdrawal and return at each station for a specific
time period. The proposed procedure was tested on a
real BSS in Spain, and the results show its usefulness
for solving everyday problems, as well as a planning
tool that allows the user to evaluate alternative
configurations.
Mingshu and Xiaolu (2017) have studied the BSS
effect on reducing congestion in the city. The results
showed that the BSSs characteristics depended on the
city type. Compared to smaller cities, larger cities
tend to have more sustainable public transportation.
Since many of the docking stations are located close
to public transport, the BSS encourages multimodal
transport by connecting to public transport systems.
Therefore, in larger cities, BSS can help replace
short-distance road trips with cycling. During peak
hours, this can reduce traffic congestion. Conversely,
in smaller cities where there are fewer routes, the BSS
can serve as an addition to public transport, providing
links between various transit stops. The purpose of
Kayleigh’s study (2017) is to quantify the impact that
the BSS has on passenger traffic. Understanding how
the BSS and public transport are interconnected is
vital for planning a mutually supportive sustainable
transport network.
Ahmadreza et al. (2014) have examined factors
affecting BSS use in Canada. Established in 2009,
BIXI is the first major public BSS in Montreal. Using
data collected in the form of per-minute readings of
the bicycles availability at all stations of the BIXI
system from April to August 2012, this study
complements the literature on the bicycles sharing.
The authors examined the meteorological data
effects, time characteristics, bicycle infrastructure,
land use, and attributes of the built environment on
the station-level arrival and departure flows using a
multi-level approach to statistical modelling that can
be applied to other regions. The data obtained allow
to identify the factors contributing to the increase in
the use of the BSS in Montreal, and to provide
recommendations regarding the station size and
location decisions. The developed methodology and
study's results can be useful for urban planners and
engineers who design or modify BSSs for maximum
utilization and accessibility.
Brian et al. (2017) argue that BSS changes
attitudes towards cycling and sharing transport
infrastructure. The article presents the using details
one of the newest BSS in Ireland. The results show
that, although Cork is a city without a strong cycling
culture, BSS is often used. The results show that most
trips were short and in most cases frequent. Frequent
BSS users had the shortest travel time, including daily
(or weekly) trips. The strong influence of weather
conditions on the use of the BSS was also found.
Under good weather conditions, the number of trips
and their duration increase. The results of this article
provide valuable insight into how a BSS works in a
small city. According to the authors, more research is
needed to understand the differences in smaller and
larger cities, such as New York and London.
3 RESULTS AND DISCUSSION
Since the bicycle infrastructure development is a
promising direction, which will require a roads
situation periodic analysis, a DSS conceptual scheme
was developed, containing data collection and
analysis modules, simulation models (SM) and
advice development module. AnyLogic 7.3.3 was
LogiTrans 4.0 2019 - Special Session on Logistics and Transport in the Industry 4.0
652
used for the development of SM. Modules for data
analysis and recommendation justification are
implemented in Delphi 7.
3.1 Designing DSS for Managing the
Bicycle Traffic Development
The qualitative integration of the bicycle
infrastructure with the city’s public transport system
can be achieved through system solutions. One of
such modules is designed to justify the effectiveness
and economy of such integration and should provide
the possibility of both strategic and operational
management. Strategic objectives are defined for the
long term. Criteria for the quality of integration will
be increased safety, capacity and passenger traffic, as
well as reducing the time to overcome the cycling
route. Correctness of such information system is
largely determined by the source information quality
and the adequacy of the its processing method. This
is ensured by following modules:
collecting, storing and administering monitoring
data for cycling and pedestrian flow parameters,
quantitative and qualitative properties of bicycle
infrastructure, transport system parameters;
analysis of statistical and dynamic data;
simulation models development and carrying out
computational experiments in before / after
situations (before - with parameters of the existing
infrastructure, after - with changes in accordance
with the recommendations received).
making decisions for analysing and evaluating
data and then developing recommendations
(calculating the track width based on passenger
traffic and the existing bicycle infrastructure
capacity; calculation of the need to create
recreation and repair areas, their number and
parameters, etc.).
The conceptual DSS scheme is shown in Figure 2.
The database is formed from:
reference information, which is conditionally
constant, as it is updated quite rarely, at specified
intervals, or as needed.
operational information - monitoring data of
objects that change dynamically and characterize
the transport system state over time;
positive decisions that characterize the system's
optimal state with certain parameters. These
decisions are formed after the analysis performed
in the intellectual module after computer
experiments and after the verification appropriate
results adequacy by the decision maker.
For data input, a user interface has been
developed, including information input and
adjustment windows (Figure 3).
3.2 Development of Intelligent Modules
for Evaluating the Efficiency and
Safety of Bicycle Infrastructure
The designed DSS is built according to a modular
principle, which allows it to expand its capabilities
using a single information base. Now, modules have
been developed for assessing environmental
performance and route safety. As an example, to test
the methodology adequacy, the Naberezhnye Chelny
city street-road network was used. The city specificity
is in the separation of industrial and residential areas.
Regular public transport routes between these zones
do not exist due to inefficiency. Therefore, most
industrial staffs prefer to use personal transport. In
this regard, there are significant difficulties in
delivering the population to the main city’s employer
– PC KAMAZ: despite the alternative routes
availability, congestion and traffic jams occur at rush
hours. Cycling routes integrated with public transport
routes to solve the “last mile” problem could improve
the situation.
3.2.1 Calculation of Route’s Ecological
Efficiency
According to numerous studies, emissions and noise
are the most dangerous pernicious effects of the
vehicles operation. To study the potential for
reducing the vehicles negative impact due to the
cycling growing share, we examined the emissions
and noise level at one of the Naberezhnye Chelny
road network's critical sections. At the first stage, this
areas simulation model was built with available
transport routes and cycle paths in AnyLogic
simulation modelling environment based on a
discrete-event approach using a traffic library (Figure
4). Here red areas are marked with high traffic
intensity. Then a survey of PC KAMAZ employees
was conducted, which constitute the main flow of
traffic participants in this sector. The results showed
that only about 2% of respondents use bicycle
transport. 24% of respondents are ready to use a
bicycle instead of individual cars and as an addition
to public transport while improving bicycle
infrastructure (bicycle lanes, safe crossings at the
intersection with roads, recreation and repair areas,
self-service stations, secure indoor parking, rental
centres at affordable prices).
Simulation with predictive parameters, reflecting
The Use of the Decision Support System to Control Bicycle Transportation
653
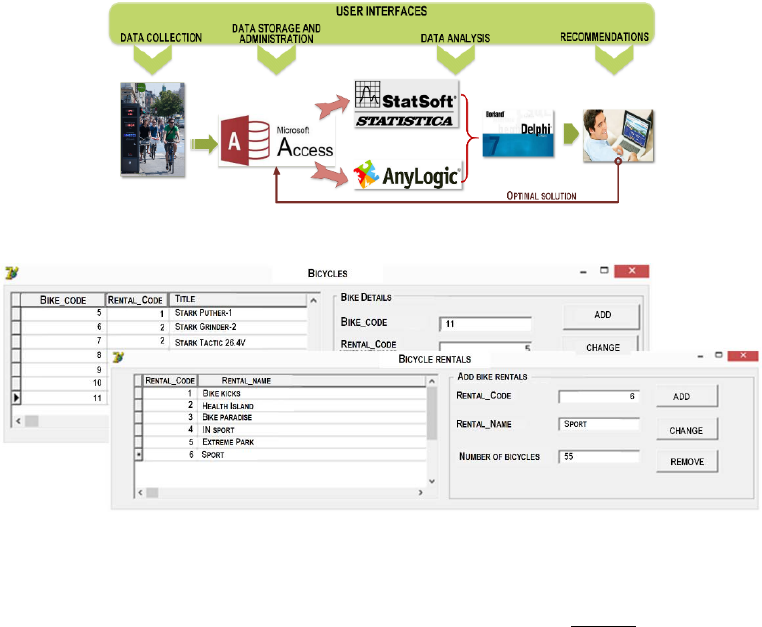
Figure 2: The conceptual DSS scheme.
Figure 3: Information input and adjustment windows.
a decrease in the motorist’s number in favor of an
increase in the cyclist’s number, showed a decrease in
the vehicular traffic intensity, which will lead to a
reduction in the negative traffic impact on the
environment.
As a result, this will lead to a reduction in CO
emissions by 20.0%, NOX by 20.7%, hydrocarbons
by 8.9%, SO2 by 14.1%, the equivalent sound level
by 9.1%.
3.2.2 Cycling Route Safety Calculation
When drawing up routes for urban movements, it is
necessary to choose the safest of the possible routes,
taking into account the traffic participant
characteristics. Categorizing the route can be
performed depending on various factors complicating
traffic conditions. Depending on the movement type,
routes in the city can be road, pedestrian, cycling and
combined. The combined route, as a rule, includes the
areas where the movement takes place on public
transport, and the movement between the starting
(end) point and the stop of public transport - on foot
or by bicycle. These plots are estimated using
criteria’s different groups, since they may differ as
traffic conditions on the plots, and priorities for
different population categories.
Therefore, we propose a methodology for multi-
criteria route safety assessment. Route assessment
can be performed using a complex indicator, which is
calculated by the formula:
∑
∙
∑
→ (1)
Factors that determine the safety of the route can be
both objective (e.g., terrain, presence of unregulated
intersections, etc.), and subjective due to the features
and physical condition of the road user (age, health
condition, etc.). Adequacy of the assessment will
depend on the correctness of the selected factors and
their combined inclusion. For example, the same
route can be safer in the daylight than in the dark, in
the summer than in the winter, etc.
Possible routes are evaluated on the base of this
information. To do this a matrix of the given route
options is constructed and then the overall routes’
performance indicators are calculated (Figure 6). The
value of the route safety indicator is calculated with
provision for correction factors that depend on the
physical condition and characteristics of the user.
Using the simulation models described above, a
route safety assessment can be performed at the
design or reconstruction stage. In addition, when
changing the transport system parameters, such
models can be used to assess the effectiveness of the
route in terms of the infrastructure facilities use.
LogiTrans 4.0 2019 - Special Session on Logistics and Transport in the Industry 4.0
654
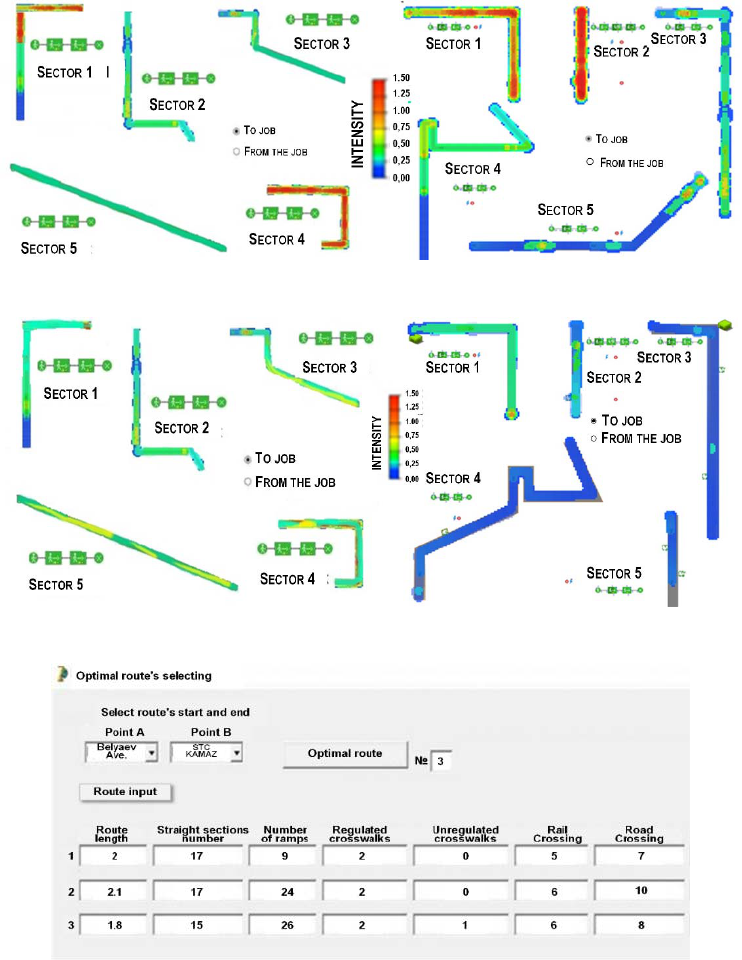
Figure 4: Simulation model of routes with current traffic flow parameters.
Figure 5: Simulation model of routes using cycling.
Figure 6: View of the developed module.
4 CONCLUSION
The qualitative integration of the bicycle
infrastructure with the urban public transport system
can be achieved through the implementation of
complex projects, so one of the DSS subsystems will
become a module to justify such integration. DSS
must provide both strategic and operational
management capabilities. At the same time, the
criteria for the integration quality will be increased
environmental efficiency, safety, throughput and
passenger traffic, as well as reducing the time to
overcome the last mile. To ensure dynamic data
collection for the information system, we need to use
counters for cyclists and pedestrians. Such systems
are widely used in different countries, as well as in
different cities of Russia: for example, in Moscow,
Kazan and Almetyevsk.
The Use of the Decision Support System to Control Bicycle Transportation
655
ACKNOWLEDGEMENTS
Research is partially funded by national grant No.
BR05236644.
REFERENCES
Ahmadreza F., Naveen E., Ahmed M. El-G., Michael R.,
Usama H., 2014. How land-use and urban form impact
bicycle flows: evidence from the bicycle-sharing
system (BIXI) in Montreal. Journal of Transport
Geography 41, 306–314.
Ahmadreza F., Robert H., Lavanya M., Naveen E., 2017.
An empirical analysis of bike sharing usage and
rebalancing: Evidence from Barcelona and Seville.
Transportation Research Part A 97, 177–191.
Alvarez-Valdes, R., Belenguer, J.M., Benavent, E. et al.,
2016. Optimizing the level of service quality of a bike-
sharing system. Omega 62. 163–175.
Bicycle innovation lab, 2018, http://
www.bicycleinnovationlab.dk/activities/data-popular-
bikes?show=lgg
Bredal, F., 2014. The Case of Copenhagen. In: Changing
urban traffic and the role of bicycles: Russian and
International Experiences, 24–28.
Brian C., Margaret O’M., William B., Peter W., 2017.
Examining usage patterns of a bike-sharing scheme in
a medium sized city. Transportation Research Part A
100. 152–161.
Forsyth, A., Krizek, K., 2011. Urban Design: Is there a
Distinctive View from the Bicycle? Journal of Urban
Design 16, 531 – 549.
Kayleigh, B.C., 2017. Candace Brakewood. Sharing riders:
How bikesharing impacts bus ridership in New York
City. Transportation Research Part A 100, 264–282.
Larsen, J., Patterson, Z., El-Geneidy, A., 2013. Build It. But
Where? The Use of Geographic Information Systems in
Identifying Locations for New Cycling Infrastructure.
International Journal of Sustainable Transportation 7,
299–317.
Martin, E.W., Shaheen, S.A., 2014. Evaluating public
transit modal shift dynamics in response to bikesharing:
a tale of two U.S. cities. Journal of Transport
Geography 41, 315–324.
Mingshu W., Xiaolu, Zh., 2017. Bike-sharing systems and
congestion: Evidence from US cities. Journal of
Transport Geography 65, 147–154.
Otero, I., Nieuwenhuijsen, M.J., Rojas-Rueda, D., 2019.
Health impacts of bike sharing systems in Europe.
Environment International 115, 387–394.
Ottomanelli, M., Caggiani, L., Binetti, M., Camporeale, R.,
2019. An urban bikeway network design model for
inclusive and equitable transport policies.
Transportation Research Procedia 37, 59–66.
Parkin, J., Rotheram, J., 2010. Design speeds and
acceleration characteristics of bicycle traffic for use in
planning, design and appraisal. Transport Policy, 17,
335–341.
Road Safety Seminar “Zero Road Deaths and Serious
Injuries: Leading a Paradigm Shift to a Safe System”,
2016, http://www.itf-oecd.org/road-safety-seminar-
safe-system.
Rybarczyk, G., 2014. Simulating bicycle wayfinding
mechanisms in an urban environment. Urban, Planning
and Transport Research: An Open Access Journal 2,
89–104.
Smart City, 2017, http://city-smart.ru/info/125.html
Tahkola, P., 2014. The Case of Oulu. In: Changing urban
traffic and the role of bicycles: Russian and
International Experiences
, 29–43.
LogiTrans 4.0 2019 - Special Session on Logistics and Transport in the Industry 4.0
656
