
Towards Extracting the Role and Behavior of Contributors in
Open-source Projects
Michail D. Papamichail, Themistoklis Diamantopoulos, Vasileios Matsoukas, Christos Athanasiadis
and Andreas L. Symeonidis
Electrical and Computer Engineering Dept., Aristotle University of Thessaloniki, Thessaloniki, Greece
Keywords:
DevOps, Developer Role Identification, Developer Behavior Extraction, GitHub Contributions, Agile.
Abstract:
Lately, the popular open source paradigm and the adoption of agile methodologies have changed the way soft-
ware is developed. Effective collaboration within software teams has become crucial for building successful
products. In this context, harnessing the data available in online code hosting facilities can help towards un-
derstanding how teams work and optimizing the development process. Although there are several approaches
that mine contributions’ data, they usually view contributors as a uniform body of engineers, and focus mainly
on the aspect of productivity while neglecting the quality of the work performed. In this work, we design a
methodology for identifying engineer roles in development teams and determine the behaviors that prevail for
each role. Using a dataset of GitHub projects, we perform clustering against the DevOps axis, thus identifying
three roles: developers that are mainly preoccupied with code commits, operations engineers that focus on task
assignment and acceptance testing, and the lately popular role of DevOps engineers that are a mix of both.
Our analysis further extracts behavioral patterns for each role, this way assisting team leaders in knowing their
team and effectively directing responsibilities to achieve optimal workload balancing and task allocation.
1 INTRODUCTION
Unlike traditional methodologies (e.g. waterfall),
where development was a structured process involv-
ing strictly bounded steps, the current state-of-the-
practice dictates agile approaches with fast release cy-
cles. In this context, software development has grown
to be a collaborative process, and often takes place in
online code hosting facilities, such as GitHub.
This new collaborative environment poses a se-
ries of challenges, including managing the numerous
workflows or dealing with technical debt (LaToza and
van der Hoek, 2016). However, it also provides sev-
eral opportunities, which originate from the deluge of
produced data that enable observing software devel-
opment transparently and at a massive scale. Indica-
tively, GitHub at the time of the writing hosts more
than 96M repositories from over 31M developers
1
.
In this context, software projects can be consid-
ered as the summation of different contributions that
include not only writing code, but also augmenting
documentation, determining the development of new
features, discussing any issues raised by end-users,
1
https://octoverse.github.com/
etc. The information about these axes, which is avail-
able in different formats (commits, issues, comments,
etc.), can be harnessed to effectively monitor and/or
quantify the software development process and thus
enable data-driven solutions to common problems.
Several researchers employ data residing in soft-
ware repositories in order to compute metrics that
quantify the software development process (Gousios
et al., 2008; Lima et al., 2015), while others assess
productivity (Maxwell and Forselius, 2000), or even
construct personalized profiles (Greene and Fischer,
2016). Though effective in certain scenarios, most
approaches focus only on engineers that contribute at
source code level, without accounting for contribu-
tors focusing on operations or ones having multiple
duties. Given this multifaceted presence of contribu-
tors, the lack of tools for exploring potential engineer
roles leads to an incomplete view of the software de-
velopment process. Thus, while a lot of attention is
directed towards evaluating developer contribution in
terms of performance, the focus on the qualitative as-
pect of contributions (code quality, compliance with
coding practices, etc.) is often limited.
In this work, we design a methodology for iden-
tifying the role and the behavior of each contributor
536
Papamichail, M., Diamantopoulos, T., Matsoukas, V., Athanasiadis, C. and Symeonidis, A.
Towards Extracting the Role and Behavior of Contributors in Open-source Projects.
DOI: 10.5220/0007966505360543
In Proceedings of the 14th International Conference on Software Technologies (ICSOFT 2019), pages 536-543
ISBN: 978-989-758-379-7
Copyright
c
2019 by SCITEPRESS – Science and Technology Publications, Lda. All rights reserved

that takes part in a software project. To this end, we
analyze the contributions of popular GitHub projects
(as determined by the number of stars). We focus not
only on process metrics (e.g. measuring productivity),
but also on quality metrics, in order to also verify the
quality of the contributions. By employing clustering,
we are able to identify the roles of individual contrib-
utors in the DevOps axis (Bass et al., 2015), there-
after splitting them to pure developers, operations en-
gineers, and DevOps engineers. Moreover, we pro-
pose a behavior identification scheme that determines
the characteristics that are relevant to each class.
The results of our analysis can be used to address
several challenges. The extracted roles reveal valu-
able information regarding the assignments (as well
as the potential) of different team members, and thus
can be used to fine-tune the software development
process in terms of workload balancing and task allo-
cation. Furthermore, the identification of certain char-
acteristics of individual contributors (e.g. their degree
of commitment and responsiveness or the quality of
their contributions) can be used to optimize team for-
mulation, which is vital for the success of the project.
2 RELATED WORK
As already mentioned, there are several efforts to-
wards quantifying software development. In terms of
project management, current approaches aspire to op-
timize the time (and, hence, man-effort) required for
development. Liao et al. (2018) focus on issue labels
(e.g. bug, gui, etc.) and explore how effective labeling
can lead to faster issue resolution. Cabot et al. (2015)
perform statistical analysis to determine the optimal
time to resolve an issue. Their analysis suggests that
resolving issues as early as possible is usually most
beneficial for the project. Commits have also been an-
alyzed in a similar context, using metrics such as the
time between consecutive commits or the modifica-
tions between releases (Biazzini and Baudry, 2014).
The challenge of determining which developer is
best “fit” for the task at hand has also drawn the atten-
tion of several researchers. The task can be a bug that
has to be resolved (Anvik et al., 2006; Bhattacharya
et al., 2012) or even a feature that has to be devel-
oped (Christidis et al., 2012). Most approaches focus
on issues (or bug reports) and employ techniques like
keyword-based matching (Anvik et al., 2006) and text
classification (Bhattacharya et al., 2012). An interest-
ing alternative is proposed by Christidis et al. (2012)
that aspire to combine activity and contribution met-
rics from different sources (commits, communication
archives) to perform effective feature assignment.
Although the aforementioned approaches can be
effective, their scope lies mostly on the practical chal-
lenge of task assignment, and they do not generalize
to team understanding and management as a whole.
In an effort to bridge this gap, recent approaches have
also focused on determining the roles of engineers
within a team. In this context Onoue et al. (2013) em-
ploy GitHub commits and issues to distinguish among
“full-time” contributors and volunteers in open source
repositories. Li et al. (2016) further identify the duties
of developers by determining the source code com-
ponents that are built/maintained by each developer
(e.g. front-end/back-end engineer). Finally, there are
also approaches that focus on extracting the areas of
expertise for each developer and create personalized
profiles (Greene and Fischer, 2016).
In this work, we identify the roles and behaviors of
engineers in a development team. Unlike current ap-
proaches, which focus on developer roles and/or their
practical challenges, we analyze the roles of all engi-
neers. In specific, we identify the engineers of a team
that are purely developers, those that are mainly fo-
cused on operations, and finally those that occupy the
often desired DevOps post. Moreover, we distinguish
among the behavior of each engineer, in an effort to
find out which are the characteristics that are common
for each role. Our methodology can therefore be used
to provide an overview of a software team, to opti-
mize the available resources, and even to build a team
that would be an effective match.
3 BENCHMARK DATASET
For our contributions’ dataset, we downloaded the
data of the 1000 most popular GitHub Java projects
2
(as determined by the number of stargazers), offered
by the GitHub API. We select popular repositories, as
these usually have high traction, and thus are updated
on a regular basis. Furthermore, repository popular-
ity has shown to be an indicative criterion of quality in
use (Papamichail et al., 2016; Dimaridou et al., 2017).
Our primary target was to analyze collaborative
projects that follow the agile paradigm. To that end,
we kept only the repositories that have at least 5 and
at most 10 “major” contributors. We consider a con-
tributor as major if he/she has made at least 3% of the
total contributions in a repository. In other words, we
keep repositories of small teams, which may of course
have contributions by a larger pool of GitHub users.
Upon filtering, our dataset has 240 projects with
8,010 contributors in total. Our next step was to ex-
2
Our analysis is mostly language agnostic, however we
focus on Java projects to use consistent quality metrics.
Towards Extracting the Role and Behavior of Contributors in Open-source Projects
537

Table 1: Overview of the Computed Metrics.
Metric Description
Category
Dev Ops
commits authored The total number of commits ×
av issues comments length The average length (in characters) of comments in all issues ×
issues {opened,closed} Number of issues {opened,closed} by the contributor ×
issues participated Number of issues the contributor has participated in ×
issues closed per day Average number of issues closed per day ×
av comments per issue Average number of comments per issue ×
activity period in days Activity period in days × ×
inactive period pct The percentage of the activity period with no contributions × ×
change bursts The number of change bursts × ×
biggest burst length The length (in days) of the biggest burst × ×
tot file {additions,deletions} Number of source code files {added,deleted} ×
tot file modifications The total number of files modified by the contributor ×
tot file changes The total number of files updated by the contributor ×
tot loc changed The total lines of source code changed ×
violations added The total number of violations added by the contributor ×
violations eliminated The total number of violations eliminated by the contributor ×
tract a series of metrics. Table 1 shows the metrics
with their description and categories. We define two
categories of metrics: Dev and Ops. There are met-
rics relevant to development (Dev), such as the num-
ber of commits (commits authored), others relevant
to operations (Ops), such as the average number of
comments per issue (average comments per issue),
and others relevant to both, such as the bursts
(change bursts), which signify consecutive days of
contributions (Nagappan et al., 2010). Finally, we fo-
cus also on quality, by including the number of code
violations added/eliminated per contributor (viola-
tions added/violations eliminated), computed by an-
alyzing the source code of each commit using PMD
3
.
4 SYSTEM DESIGN
4.1 Methodology Overview
Our methodology involves four steps: (1) dataset con-
struction, (2) preprocessing, (3) role identification,
and (4) behavior identification. We first inspect our
dataset to discover missing and/or corrupt values and
eliminate extreme values by applying outlier detec-
tion. Then, we evaluate the importance of the metrics
and eliminate excess information by applying correla-
tion analysis. Given the different nature of the metrics
(as reflected by their absolute values), we normalize
the data so as not to favor any metric. Finally, we ap-
ply clustering at two levels, first to define the role of
3
https://pmd.github.io/
each contributor (role identification) and then to dis-
tinguish the contributors of each role based on their
individual characteristics (behavior identification).
4.2 Data Preprocessing
4.2.1 Handling Missing Values/Irregularities
The dataset consists of 20 attributes: the 18 metrics
of Table 1, the contributor login, and the name of the
repository. The attributes av issues comments length
and av comments per issue contain missing values,
which correspond to contributors that have not made
any comments and thus they are replaced with zeros.
Upon examining the dataset, we also decided to
remove contributors with inactive period greater than
97% and/or activity period less than two days. We
argue that these contributors had minor participation
and thus may negatively affect the results. The same
applies for contributors with less than five commits
and at the same time less than five issues participated.
4.2.2 Outliers Removal
Given that there are records with extreme values that
do not conform to the general behavior of the dataset,
we compute for each attribute the mean value µ and
the standard deviation σ. Upon applying outlier de-
tection based on the normal distribution principles,
every value outside the interval [µ − 3 · σ, µ + 3 · σ]
is considered an outlier. All records having at least
one attribute value marked as outlier are removed.
ICSOFT 2019 - 14th International Conference on Software Technologies
538
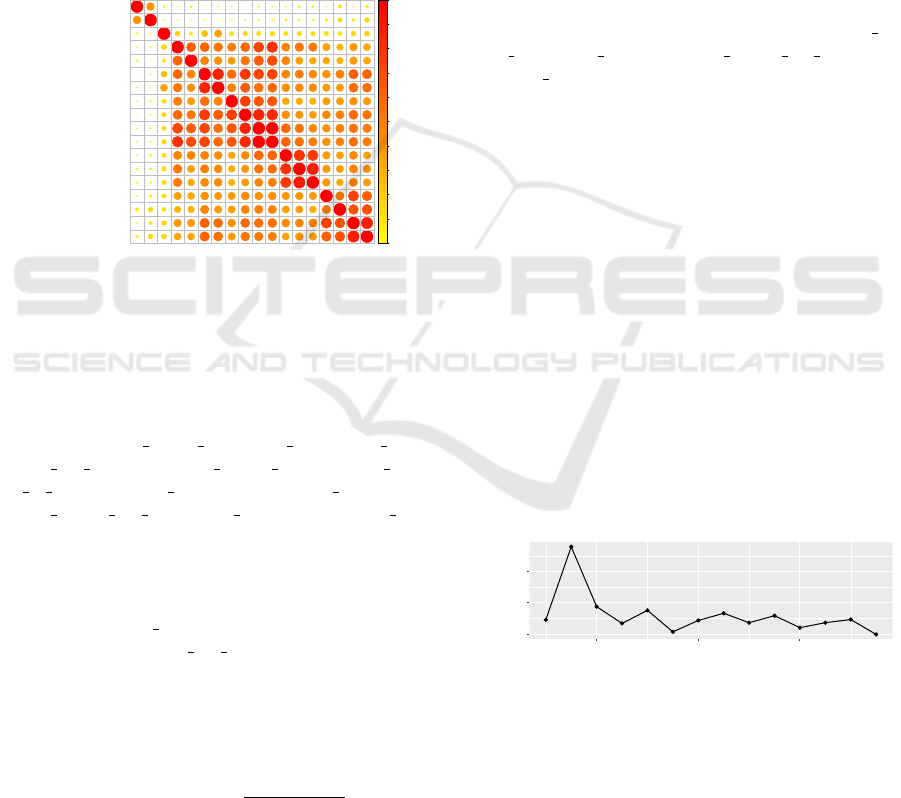
4.2.3 Correlation Analysis
We apply correlation analysis to eliminate metrics
that appear to be interdependent and reduce the di-
mensions of the dataset. For this purpose, we com-
pute the pairwise correlations among all metrics. The
results (for a subset of the metrics) are shown in the
heatmap of Figure 1. The radius and the color of each
circle indicate the value of the correlation between the
two respective metrics.
0
0.1
0.2
0.3
0.4
0.5
0.6
0.7
0.8
0.9
1
av_issues_comments_length
av_comments_per_issue
inactive_period_pct
tot_file_additions
tot_file_deletions
change_bursts
activity_period_in_days
biggest_burst_length
commits_authored
tot_file_modifications
tot_file_changes
violations_eliminated
tot_loc_changed
violations_added
issues_closed_per_day
issues_opened
issues_closed
issues_participated
Figure 1: Heatmap representation of correlation analysis.
There are many metrics that appear to be sig-
nificantly correlated. In our analysis, we con-
sider a strong correlation if it exceeds the thresh-
old of 0.7 (determined by manual inspection).
Upon keeping one metric for each group of highly
correlated metrics, the final dataset consists of
9 attributes: av issues comments length, av com-
ments per issue, inactive period pct, activity peri-
od in days, commits authored, violations eliminated,
issues closed per day, issues opened, and issues par-
ticipated. The results seem quite reasonable from a
software engineering perspective. For instance, a de-
veloper with many commits has a high probability to
also exhibit a large number of file modifications. In-
deed, the commits authored metric has a correlation
value of 0.86 with total file modifications.
4.2.4 Normalization
Finally, the dataset is normalized through scaling the
values of each metric using the following formula:
value
normalized
(i) =
value(i) − µ
i
σ
i
(1)
where i refers to the index of the metric, µ
i
to the
mean value and σ
i
to the standard deviation. This nor-
malization step is of utmost importance as the dataset
comprises metrics of different magnitudes and ranges.
4.3 Model Construction
4.3.1 Role Identification
As already mentioned, we expect contributors to be
categorized into three roles: Dev, Ops, and DevOps.
Devs are the pure developers who mainly contribute
to the source code of the project, Ops are the ones
responsible for operations and usually have minimal
or even no involvement in the code, and DevOps
undertake tasks that refer to both development and
operations-related activities. This categorization de-
pends on the metrics’ values, which quantify the con-
tributions on both development and operations axes.
As for the role identification/clustering step, three
out of the remaining nine metrics were chosen: av is-
sues comments length, issues closed per day, and
commits authored. These metrics were selected as
they are the most representative and distinguishable
for the three roles. The remaining metrics will be used
for behavior identification, since they actually reveal
the virtues of each contributor and not the role itself.
Before performing clustering using k-means, we
observed that in certain metrics, despite the almost
normal distribution, there are some large values that
create a tail in the distribution. As a result, we ap-
plied an arcsinh transformation to suppress these high
values and make the distribution less skewed. In or-
der to select the optimal number of clusters, we used
the mean silhouette value, which ranges from -1 to +1
and reflects the similarity of the contributors assigned
in each cluster compared to their similarity with con-
tributors of other clusters. A positive silhouette value
denotes that the contributor is properly categorized.
Figure 2 depicts the results for different number of
clusters. The optimal number is 3 as it exhibits the
highest mean silhouette value, which is around 0.49.
0.35
0.40
0.45
4 8 12
Clusters
Mean Silhouette
Figure 2: Mean Silhouette over different number of clusters.
4.3.2 Behavior Identification
Upon having identified the role of each contributor,
we perform a second clustering inside each group in
order to model their behaviors. To effectively iden-
tify the behaviors in each category of contributors,
we once again manually examined the metrics and se-
lected the ones that appear to best fit each case.
Towards Extracting the Role and Behavior of Contributors in Open-source Projects
539
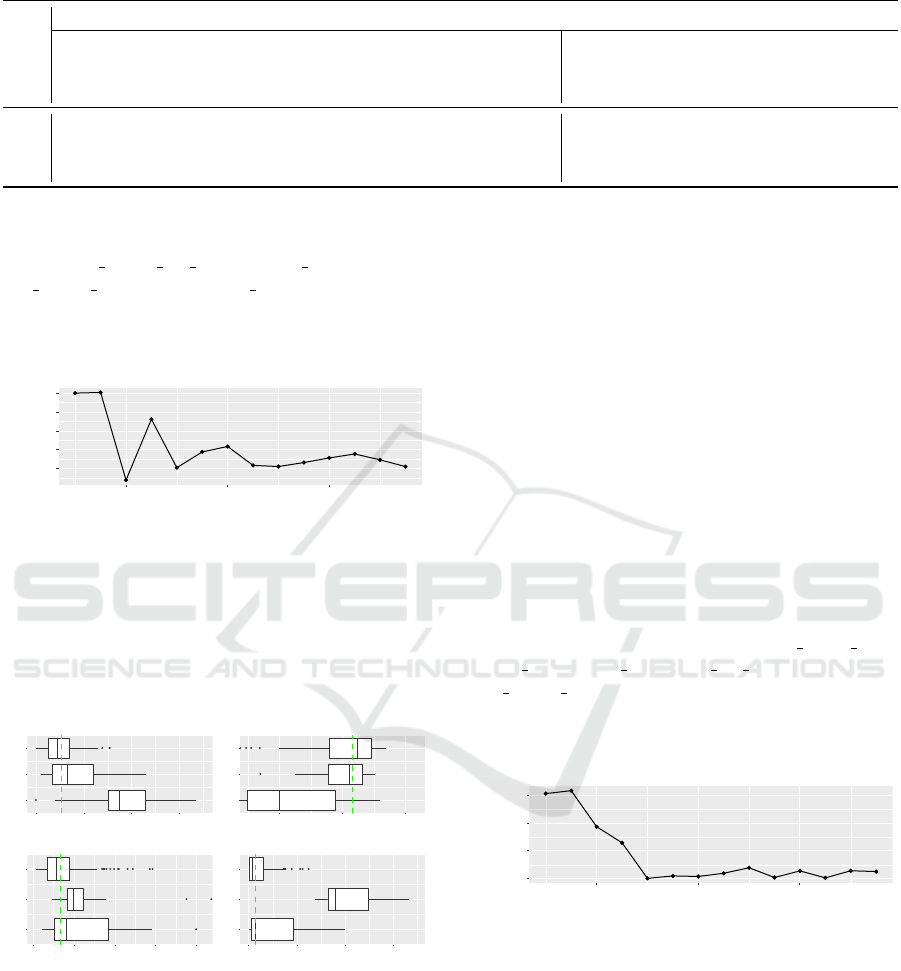
Table 2: Overview of Dev Profiles.
Cluster
Metrics Profile
Issues closed
per day
Commits
authored
Inactive
period
Violations
eliminated
Efficient
Consistent
Coder
Devoted
# 1 [0.079, 0.67] [55, 997] [71.5%, 96%] [0, 2002] X X X X
# 2 [0.02, 0.462] [119, 448] [82.5%, 95.3%] [1367, 3323] X X × X
# 3 [0.0, 0.26] [18, 392] [80%, 96.9%] [0, 713] × × × ×
Dev Behavior. The metrics used to analyze the be-
havior of development-oriented engineers (Dev) in-
clude issues closed per day, commits authored, inac-
tive period pct, and violations eliminated. Figure 3
depicts the mean silhouette for different number of
clusters using k-means. The optimal is found for 3
clusters with mean silhouette value equal to 0.502.
0.30
0.35
0.40
0.45
0.50
4 8 12
Clusters
Mean Silhouette
Figure 3: Mean Silhouette regarding Dev engineers.
To analyze the profiles of Dev engineers, we for-
mulated for each cluster the boxplot of each metric.
Figure 4 depicts the boxplots of the metrics that par-
ticipated in the analysis for the clusters. Each metric’s
median value is depicted as a dashed line to evaluate
cluster behavior with respect to the metrics’ values.
1
2
3
0.0 0.2 0.4 0.6
issues_closed_per_day
Cluster
1
2
3
0 250 500 750 1000
commits_authored
Cluster
1
2
3
0.8 0.9 1.0
inactive_period_pct
Cluster
1
2
3
0 1000 2000 3000
violations_eliminated
Cluster
Figure 4: Boxplots for Dev behavior identification.
The first cluster mainly consists of contributors
devoted to closing many issues, making several com-
mits, and following good coding practices, as re-
flected in the number of eliminated violations. The
second cluster represents contributors with lower
rates of closed issues and number of commits, but
with a strong orientation towards code quality. The
third cluster includes contributors that make some
commits, close a few issues and show less care about
code integrity. Thus, we could argue that this clus-
ter represents Junior Developers, due to the relatively
lower activity. Regarding activity period, we could
characterize the contributors of the first group as more
devoted, while the others seem to work in bursts.
We further labeled the behaviors to translate the
values of the metrics into profile characteristics. The
clusters along with the metrics’ values and the formu-
lated profiles are summarized in Table 2. We consider
that the degree to which a developer is “efficient” de-
pends on the number of closed issues, while the num-
ber of commits characterizes a Dev engineer as (high-
performance) “coder”. Moreover, the number of elim-
inated coding violations measure the extent to which
a Dev engineer is “consistent”, while a rather high ac-
tivity period characterizes the engineer as “devoted”.
Ops Behavior. The metrics for analyzing op-
erations engineers (Ops) include av issues com-
ments length, av comments per issue, and inac-
tive period pct. Figure 5 depicts the mean silhouette
values for different clusterings. The optimal number
of clusters is 3 with mean silhouette value equal to
0.41.
0.25
0.30
0.35
0.40
4 8 12
Clusters
Mean Silhouette
Figure 5: Mean Silhouette regarding Ops engineers.
Figure 6 depicts the boxplots for the three clusters.
The first cluster contains engineers that participate in
many issues, write comments of typical length, and
are less active than contributors of the other clusters
(the percentage of inactive period is high). From an
engineering point of view, these contributors corre-
spond to supervisors involved in many projects. The
second cluster represents engineers that are quite de-
voted and active, and seem to write comments with
short length. Thus, they are actively involved in var-
ious tasks, give short and straightforward directions,
ICSOFT 2019 - 14th International Conference on Software Technologies
540
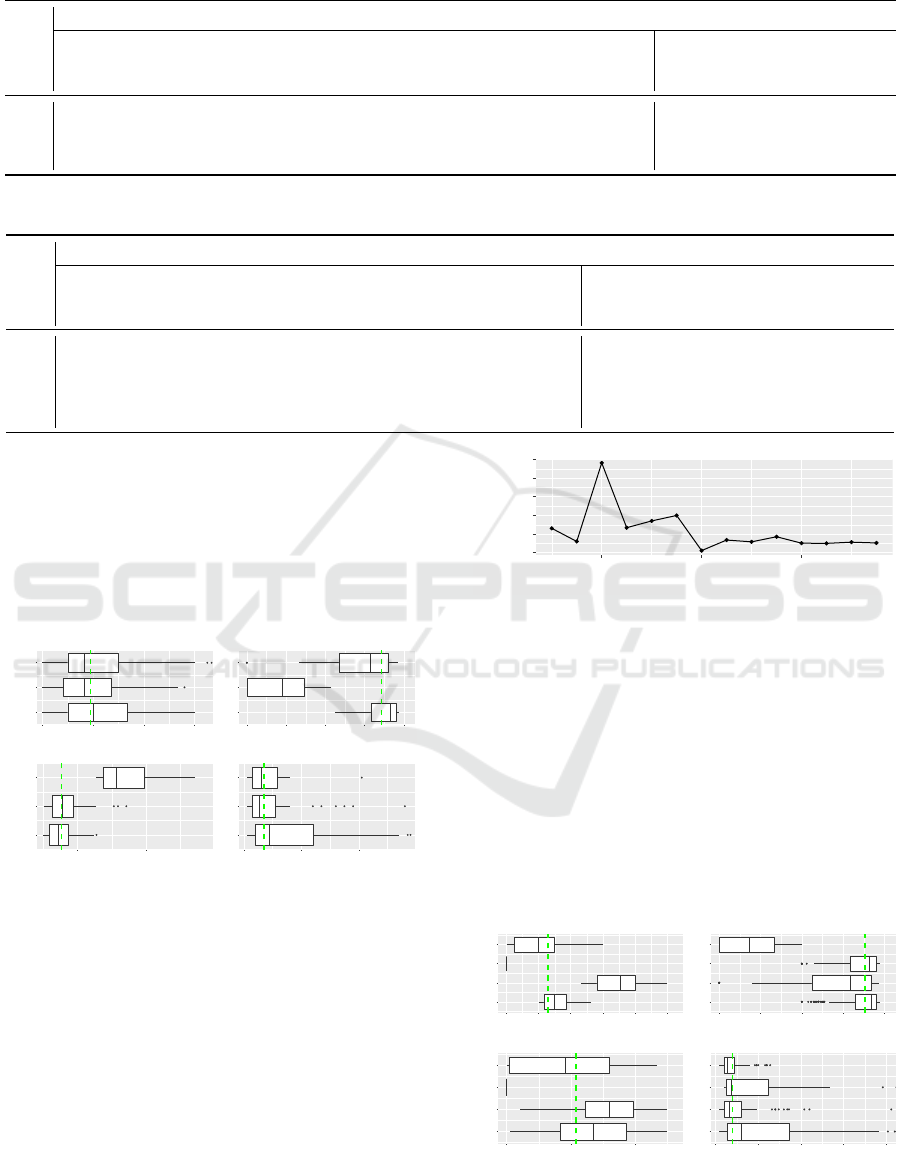
Table 3: Overview of Ops Profiles.
Cluster
Metrics Profile
Av. comments
per issue
Av. comments
length
Inactive
period
Issues
participated
Verbal
Involved
Devoted
# 1 [1, 4] [251.847, 621.25] [56.25%, 96.9%] [1, 54] X X ×
# 2 [1, 3.8] [255.72, 639.5] [0%, 54%] [1, 16] X X X
# 3 [1, 4] [634.5, 1358.8] [33.3%, 96%] [1, 16] X X ×
Table 4: Overview of DevOps Profiles.
Cluster
Metrics Profile
Av. comments
per issue
Av. comments
length
Commits
authored
Inactive
period
Verbal
Involved
Coder
Devoted
# 1 [1, 2.632] [5, 249.84] [2, 96] [66.6%, 97%] X X X ×
# 2 [2.333, 5] [21, 249.898] [2, 24] [20%, 96.8%] X X X X
# 3 [0, 0] [0, 0] [5, 67] [57.1%, 97%] × × X ×
# 4 [0, 3] [0, 233.75] [2, 20] [0%, 50%] X X × X
and are always present to supervise project progress.
The last cluster consists of engineers with significant
comments’ length that participate in few issues and
have rather extended periods of inactivity. This cat-
egory best describes Ops having the role of Project
Manager, giving extended directions about the project
plan. As expected, all clusters exhibit high average
comments per issue values.
1
2
3
1 2 3 4
av_comments_per_issue
Cluster
1
2
3
500 1000
av_issues_comments_length
Cluster
1
2
3
0.00 0.25 0.50 0.75 1.00
inactive_period_pct
Cluster
1
2
3
0 20 40
issues_participated
Cluster
Figure 6: Boxplot for Ops behavior identification.
We also designed profiles for the Ops engineers,
shown in Table 3. Ops engineers are “verbal” when
they tend to make comments with significant length.
Moreover, “involved” denotes the active participation
in a large number of issues, while “devoted” describes
engineers with high activity during the project.
DevOps Behavior. As for DevOps behavior identi-
fication, we used a combination of Dev and Ops met-
rics. Figure 7 depicts the mean silhouette for different
number of clusters. The optimal number of clusters is
4 with mean silhouette value equal to 0.446. Figure 8
depicts the boxplots for the clusters.
0.325
0.350
0.375
0.400
0.425
0.450
4 8 12
Clusters
Mean Silhouette
Figure 7: Mean Silhouette regarding DevOps engineers.
The first cluster is typical of DevOps engineers
with commentary skills and high activity (i.e. num-
ber of commits). The second is more Ops-oriented as
it involves high values in number of comments and
their length, but few commits authored. The third
cluster includes more Dev-oriented engineers that are
not involved in commenting, but have many commits.
The fourth cluster shares similar features with the sec-
ond one, such as the high commenting activity or the
low number of commits, however its contributors are
more involved in the project (in terms of activity pe-
riod), indicating their more managerial role.
1
2
3
4
0 1 2 3 4 5
av_comments_per_issue
Cluster
1
2
3
4
0 100 200
av_issues_comments_length
Cluster
1
2
3
4
0.00 0.25 0.50 0.75 1.00
inactive_period_pct
Cluster
1
2
3
4
0 25 50 75 100
commits_authored
Cluster
Figure 8: Boxplot for DevOps behavior identification.
Towards Extracting the Role and Behavior of Contributors in Open-source Projects
541

Table 5: Overview of the Computed Metrics for 8 Contributors belonging in 2 different Projects.
Contributor
Role
Contributions Metrics
Profiles
Index
Issues
participated
Comments
length
Commits
authored
Activity
period
Violations
eliminated
Project # 1
# 1 Dev 104 164.8 311 557 1792
efficient
coder
# 2 Ops 98 272 14 151 0
non verbal
devoted
# 3 Ops 34 583.0 5 82 0
verbal
non devoted
# 4 DevOps 394 367.4 209 499 10
involved
devoted
Project # 2
# 5 Dev 42 97.7 731 955 0
coder
involved
# 6 Dev 121 183.9 307 276 2381
coder
consistent
# 7 DevOps 10 204.0 44 107 0
verbal
non devoted
# 8 DevOps 3 114.6 2 7 16
non verbal
not involved
5 EVALUATION
We have already provided quantitative means of as-
sessing our methodology (via silhouette), therefore in
this section we perform qualitative evaluation to con-
firm that the results can be practically useful. We ex-
amine the metrics along with the assigned roles and
behaviors for 8 different contributors that have taken
part in the development of 2 different projects. The
projects are CellularPrivacy/Android-IMSI-Catcher-
Detector and TeamAmaze/AmazeFileManager, here-
after named Project 1 and Project 2. These projects
were selected for comparison reasons, as they ex-
hibit similar characteristics in terms of the length of
their lifecycle (both projects started at early 2014),
the number of total contributors (both projects have
around 90 contributors), and the effort they involve
(both projects have around 2,500 commits). The re-
sults of our analysis are shown in Table 5, where for
each project we keep the 4 most major contributors.
In the first project there is a clear distinction be-
tween contributors focusing on operations and those
focusing on development. In the second project the
pure operations role appears to be missing and instead
the dominant role is the DevOps. To further elaborate
on this difference, we investigated the progression of
the contributions of the projects (shown in Figure 9).
It seems that that the first project is in maintenance (as
the main batch of contributions has already been per-
formed at an earlier point in time), whereas the sec-
40
30
20
10
0
March 2014 March 2015 March 2016 March 2017 March 2018 March 2019
Project #1
Contributions
40
30
20
10
0
Project #2
Contributions
June 2014 June 2015 June 2016 June 2017 June 2018 April 2019
Figure 9: Contributions density for the two projects.
ond is under active development. Hence, the behav-
iors seem reasonable from a development perspective.
During maintenance the effort is typically directed to
operations (i.e. support, bug resolution, etc.), while
during active development it is common for all engi-
neers to take part in both development and operations.
The roles and behaviors seem also rational with
respect to the metrics. Dev contributors focus more on
the source code, which is reflected in the large num-
ber of commits (commits authored) and their rather
limited participation in issues (issues participated).
In addition, by considering code quality as reflected
in the values of the violations eliminated metric, our
approach can successfully identify contributors with
better coding skills and thus improve the quality of
ICSOFT 2019 - 14th International Conference on Software Technologies
542

the codebase. Reasonable results are also obtained
for the Ops contributors; the low number of commits
combined with their high participation in issues indi-
cate focus on operations. Further assessing their be-
haviors, we are also able to identify the ones that seem
more descriptive (verbal), as inferred by the number
and length of their comments. Finally, concerning the
DevOps contributors, they seem to participate both in
development and in operations’ activities, exhibiting
rather high values in all aforementioned metrics.
6 CONCLUSIONS
In this work, we proposed a data-driven methodology
and, by applying clustering, we were able to identify
the roles of contributors that take part in a software
project as well as the special characteristics of their
behavior. Future work lies in several directions. At
first, we can add more metrics to provide an analy-
sis that covers additional development scenarios and
roles. Moreover, we can expand our dataset by adding
projects with different characteristics. Finally, an in-
teresting direction would be to build a recommenda-
tions engine able to provide recommendations regard-
ing optimal team formulation and/or task allocation
based on the characteristics of each contributor.
ACKNOWLEDGEMENTS
This research has been co-financed by the European
Regional Development Fund of the European Union
and Greek national funds through the Operational
Program Competitiveness, Entrepreneurship and In-
novation, under the call RESEARCH – CREATE –
INNOVATE (project code: T1EDK-02347).
REFERENCES
Anvik, J., Hiew, L., and Murphy, G. C. (2006). Who Should
Fix This Bug? In Proceedings of the 28th Inter-
national Conference on Software Engineering (ICSE
’06), pages 361–370, New York, NY, USA. ACM.
Bass, L., Weber, I., and Zhu, L. (2015). DevOps: A Soft-
ware Architect’s Perspective. Addison-Wesley Profes-
sional, 1st edition.
Bhattacharya, P., Neamtiu, I., and Shelton, C. R. (2012).
Automated, Highly-accurate, Bug Assignment Using
Machine Learning and Tossing Graphs. J. Syst. Softw.,
85(10):2275–2292.
Biazzini, M. and Baudry, B. (2014). “May the Fork Be
with You”: Novel Metrics to Analyze Collaboration
on GitHub. In Proc. of the 5th International Workshop
on Emerging Trends in Software Metrics (WETSoM
2014), pages 37–43, New York, NY, USA. ACM.
Cabot, J., Izquierdo, J. L. C., Cosentino, V., and Rolandi,
B. (2015). Exploring the use of labels to categorize is-
sues in Open-Source Software projects. In Proc. of the
22nd International Conference on Software Analysis,
Evolution, and Reengineering, pages 550–554.
Christidis, K., Paraskevopoulos, F., Panagiotou, D., and
Mentzas, G. (2012). Combining Activity Metrics
and Contribution Topics for Software Recommenda-
tions. In Proc. of the Third International Workshop on
Recommendation Systems for Software Engineering,
pages 43–46, Piscataway, NJ, USA. IEEE Press.
Dimaridou, V., Kyprianidis, A.-C., Papamichail, M., Dia-
mantopoulos, T., and Symeonidis, A. (2017). Towards
Modeling the User-Perceived Quality of Source Code
using Static Analysis Metrics. In Proc. of the 12th Int.
Conference on Software Technologies, pages 73–84.
Gousios, G., Kalliamvakou, E., and Spinellis, D. (2008).
Measuring developer contribution from software
repository data. In Proc. of the 2008 International
Working Conference on Mining Software Reposito-
ries, MSR ’08, pages 129–132, NY, USA. ACM.
Greene, G. J. and Fischer, B. (2016). CVExplorer: Identi-
fying Candidate Developers by Mining and Exploring
Their Open Source Contributions. In Proc. of the 31st
International Conference on Automated Software En-
gineering (ASE), pages 804–809, NY, USA. ACM.
LaToza, T. D. and van der Hoek, A. (2016). Crowdsourc-
ing in software engineering: Models, motivations, and
challenges. IEEE Softw., 33(1):74–80.
Li, S., Tsukiji, H., and Takano, K. (2016). Analysis of
Software Developer Activity on a Distributed Version
Control System. In Proc. of the 30th International
Conference on Advanced Information Networking and
Applications Workshops (WAINA), pages 701–707.
Liao, Z., He, D., Chen, Z., Fan, X., Zhang, Y., and Liu, S.
(2018). Exploring the Characteristics of Issue-Related
Behaviors in GitHub Using Visualization Techniques.
IEEE Access, 6:24003–24015.
Lima, J., Treude, C., Filho, F. F., and Kulesza, U.
(2015). Assessing developer contribution with reposi-
tory mining-based metrics. In Proc. of the 2015 IEEE
International Conference on Software Maintenance
and Evolution (ICSME), pages 536–540, USA. IEEE.
Maxwell, K. D. and Forselius, P. (2000). Benchmark-
ing software-development productivity. IEEE Softw.,
17(1):80–88.
Nagappan, N., Zeller, A., Zimmermann, T., Herzig, K., and
Murphy, B. (2010). Change bursts as defect predic-
tors. In Proc. of the 21st Int. Symposium on Software
Reliability Engineering, pages 309–318. IEEE.
Onoue, S., Hata, H., and Matsumoto, K.-i. (2013). A
Study of the Characteristics of Developers’ Activities
in GitHub. In Proc. of the 20th Asia-Pacific Software
Engineering Conference, pages 7–12, USA. IEEE.
Papamichail, M., Diamantopoulos, T., and Symeonidis,
A. L. (2016). User-Perceived Source Code Quality Es-
timation based on Static Analysis Metrics. In Proc. of
the IEEE International Conference on Software Qual-
ity, Reliability and Security, pages 100–107, Austria.
Towards Extracting the Role and Behavior of Contributors in Open-source Projects
543
