
Determining the Required Size of a Military Training Pipeline
Etienne Vincent
a
and Michelle Straver
b
Director General Military Personnel Research and Analysis, Department of National Defence,
101Colonel By Drive, Ottawa, Canada
Keywords: Markov Manpower Model, Monte Carlo Simulation, Training Pipeline, Military Establishment, Personnel
Operations Research, Workforce Analytics.
Abstract: This paper addresses the problem of deciding how many positions to set aside, in a military establishment,
for recruits undergoing training. We assume a cap on total strength, and thus must select a ratio between
positions in the force’s training pipeline versus its trained establishment. We develop a Markovian model of
the training pipeline, with parameters derived from historical Human Resources data. Through Monte Carlo
simulation we may then predict how often a given ratio will be sufficient to generate the required trained force,
as well as how much surplus trained personnel it is expected to generate. Our modelling results have informed
ongoing initiatives to optimize the force mix and structure of the Canadian Armed Forces.
1 INTRODUCTION
This paper describes the approach taken to solve a
challenging Human Resource problem faced by the
Canadian Armed Forces. This problem concerns how
many positions must be set aside for Regular Force
recruits undergoing their training. We present a
solution based on a stochastic simulation of the
training pipeline. Through simulation, we estimated
how often a given number of positions reserved for
trainees will be sufficient to generate the desired
trained force. Simulation also gives us an estimate of
the number of surplus trained personnel that is to be
expected. Armed with these results, departmental
decision makers will be able to select a training
structure that balances the risk of not meeting
operational requirements against the costs from
pipeline overcapacity.
The scheme presented in this paper is simple and
effective. It is presented in the hope that it will be
appreciated as a practical application of military
Operations Research. Our solution was developed in
the context of designing a future fighting force, but is
also relevant to examining the current force structure.
Regularly revisiting the ratio of trainee-to-trained
positions will be necessary to preserve a force where
a
https://orcid.org/0000-0002-6877-2379
b
https://orcid.org/0000-0002-4130-9376
all units can be sufficiently manned. Our model offers
a way to inform this rebalancing.
2 BACKGROUND
In 2017, the Government of Canada issued Strong
Secure and Engaged, the latest Canadian Defence
Policy. Notably, this policy mandates the capability
to conduct a defined set of concurrent operations,
including both emergency responses and planned
deployments, and ranging from limited to sustained
commitments. To ensure that the Canadian Armed
Forces have the right mix of military personnel to
satisfy these requirements, the Force Mix and
Structure Design initiative was launched. This
initiative is in the process of designing, from the
ground up, the required military establishment.
Operations Research analyses in support of the
Force Mix and Structure Design initiative are not the
first to be conducted in support of establishment
reviews. For example, both Bender (2005) and
Couillard et al (2015) present stochastic simulations
that quantify to what extent given force mixes (mixes
of military personnel from various occupation
categories) meet contingent operational
358
Vincent, E. and Straver, M.
Determining the Required Size of a Military Training Pipeline.
DOI: 10.5220/0010249503580365
In Proceedings of the 10th International Conference on Operations Research and Enterprise Systems (ICORES 2021), pages 358-365
ISBN: 978-989-758-485-5
Copyright
c
2021 by SCITEPRESS – Science and Technology Publications, Lda. All rights reserved

requirements. Filinkov et al (2011) similarly present
a model designed to study the Australian Army.
A first phase of Force Mix and Structure Design
strived to determine the Force Employment
requirement – the required number of “boots on the
ground” conducting operations. The second phase
then looked at supporting elements involved in force
generation and the institution of the Canadian Armed
Forces. It is in this context that the required size of the
combined Basic Training List (recruits in their initial
phases of training) and Supplementary University
Training List (recruits requiring training in higher
education institutions) had to be determined. For
simplicity, we will thereafter refer to the positions
reserved for members on these lists as the training
pipeline. Regular Force recruits remain in this
pipeline until they reach an Operationally Functional
Point – at which point they are considered trained and
can occupy trained effective positions.
Straver and Christopher (2015) have conducted a
study based on stochastic simulation to determine the
sustainable composition of the Regular Force,
including the size of the training pipeline.
Nevertheless, it is now understood that the data
underpinning that study were problematic. As such,
our model is a successor to Straver and Christopher’s
that now focuses exclusively on the training pipeline,
and that was built to work with new and improved data.
3 MARKOV MANPOWER
MODELS
Many approaches have been used to model personnel
systems. For example, Wang (2005) categorizes these
approaches into Markov Chain models, Computer
Simulation models, Optimisation models and System
Dynamics. The approach that we describe is a hybrid
of the first two categories, being a discrete-time
Markovian model serving as a basis for stochastic
simulation.
The earliest described application of Markov
Chains to a personnel systems is found in (Seal,
1945), whereas a general overview of their use in this
context is found in (Guerry and De Feyter, 2009).
Guerry and De Feyter define Markov Manpower
models as satisfying four assumptions:
They are memory-less (the usual Markovian
assumption);
Their flow rates are time-independent;
1
We used 14 years of historical data. This goes beyond the
maximum length of training, but excludes earlier years,
when the system may have behaved differently.
They are discrete-time, with fixed-increment
intervals;
Their stocks describe homogeneous populations.
Models developed to study the Canadian Armed
Forces have generally obeyed the first two of these
assumptions, but not always the last two. In fact,
Discrete Event Simulation has been the most-
employed paradigm (Okazawa, 2013), but is based on
next-event time progression rather than fixed
increments.
The homogeneous stocks assumption requires that
populations be broken down into homogeneously
behaving subsets. To do this, regression is often used
to identify the variables that most-affect behaviour. In
our case, this would pose a problem. The Regular
Force employs members of various ranks, and who
have completed different periods of service – factors
that are closely tied to the propensity to release (to
leave the forces). Also, they belong to many different
occupations, and are recruited through a number of
different entry plans, implying widely different
durations of training. Given this wide spectrum of
factors, and given the need to use data that remain
representative of the current system,
1
we would not
have sufficient data available to accurately estimate
all the parameters that would be associated with the
multiple resulting homogeneously behaving subsets
(groups of members of similar ranks, years of service,
occupations and entry plans).
We thus build a model that diverges from Markov
Manpower models with respect to the homogeneous
stock assumption. We group in our stocks cohorts of
members who behave diversely, but who when taken
collectively, have aggregate flow probabilities that are
nevertheless fairly consistent from year to year.
Therefore, the historically observed proportion of
members from a stock who flow in a given direction
cannot be interpreted as a probability applying to
individuals, but it can still be interpreted as the
expected proportion of individuals who will transition.
4 TRANSITION PROBABILITIES
For Markov Manpower models, Anderson and
Goodman (1957) demonstrate that the maximum
likelihood estimator for transition probabilities is given
by the numbers of employees that underwent that
transition divided by the total number of eligible
employees in the relevant sub-periods (e.g. each year,
Determining the Required Size of a Military Training Pipeline
359
if looking for an annual probability). Under the
homogeneous stock assumption, the probability for the
total number of employees undergoing that transition
is then binomial. Binomial distributions are thus
commonly used in stochastic interpretations of Markov
Manpower models, but this would be inappropriate in
our case, as our stocks are not homogeneous.
In the absence of a priori knowledge of the shape
of the flow probabilities in our model, we fit Gaussian
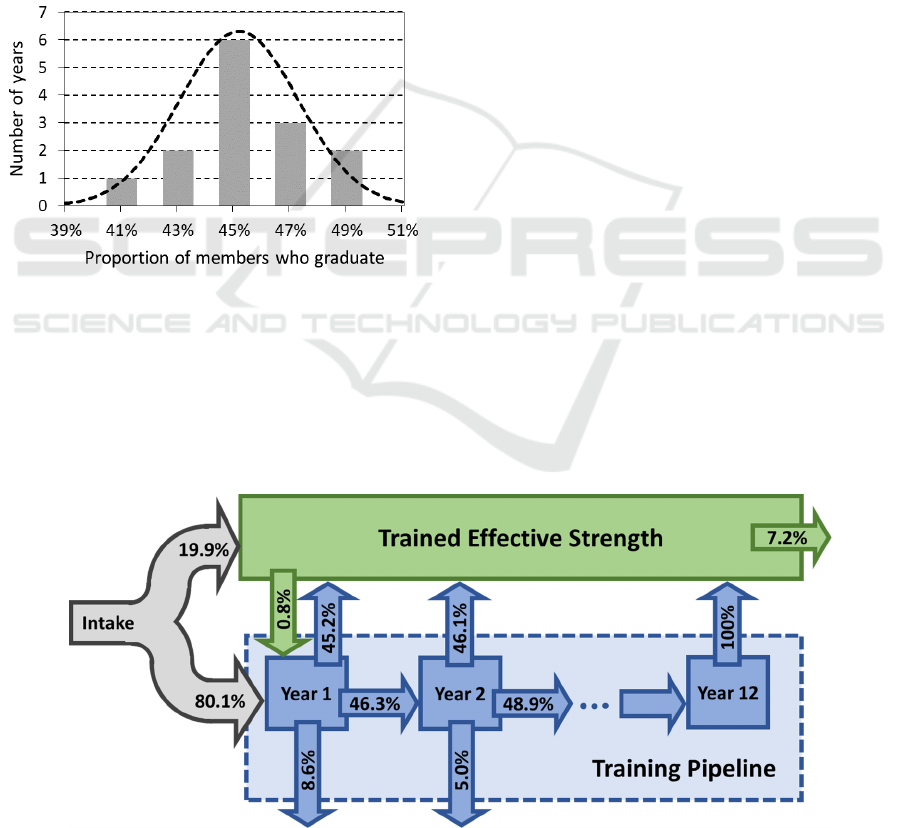
distributions. For example, Figure 1 shows the
distribution used for members graduating from the
training pipeline within the year after they had first
appeared in it. The 14 years of available annual
observations are shown as a bar histogram. The
Gaussian that was fit, with mean 45.2% and standard
deviation 2.1% is shown as the dashed line.
Figure 1: Distribution for the proportion of members who
graduate within the next year, among members who first
appeared in the training pipeline, 2006-2020. A Gaussian
fit is also shown as the dashed line.
When we get to our simulation, the proportion of
members who graduate from the training pipeline in
a given year will thus be drawn from this and similar
distributions in each annual iteration. In order to
avoid unrealistically extreme outcomes, we only draw
within three standard deviations of the mean.
Previous efforts to model the Regular Force
training pipeline, such as (Bender, 2005) and (Straver
and Christopher, 2015) have sought to explicitly
model the main specific processes of the human
resources system. For example, graduation from the
training pipeline would be modelled as the result of
separately considering graduations of Officers and
Non-Commissioned Members, further split according
to their entry plan, as various categories of trained,
semi-trained and untrained recruits. Instead, our
approach considers no more than a single flow
between each model stock, consolidating a number of
sub-flows. This greatly simplified our task of
historical data analysis for estimating model
parameters, as we did not need to categorize the data
associated with past recruits. We also expect the
resulting model to be more reliable, as covariance
between sub-flows would have been impossible to
determine from our limited data, but is avoided by
directly estimating the aggregate flows.
5 THE MODEL
Figure 2 depicts our model. The percentages shown
on arrows correspond to the mean proportions for
certain modelled flows. The model has two parts: A
stock for the Trained Effective Strength (TES), and a
set of stocks for the training pipeline. The TES
encompasses all members who have completed their
training up to the Occupationally Functional Point,
and are not in certain operationally unavailable
categories. Members who change occupation
generally require re-training – these correspond to the
0.8%
arrow
flowing
toward
the
training
pipeline.
Figure 2: Illustration of our model of the Canadian Armed Forces training pipeline.
ICORES 2021 - 10th International Conference on Operations Research and Enterprise Systems
360

Others leave the system, corresponding to the 7.2%
arrow. These leaving members may be leaving the
forces completely through release or death, but could
also be moving to the Reserve Force, or to a non-
effective status (ill, injured or pre-release).
The training pipeline is divided into cohorts. After
having first appeared in the pipeline, members may
graduate (45.2%), remain for at least another year
(46.3%), or leave the system (8.6%). A total of 12
such similar stocks are modelled, with any remaining
trainees graduating after the twelfth year. In our
historical record, only one member was in the training
pipeline for 12 consecutive years. No occupation
requires this much training, but delays can result from
changes in occupation, or pauses in training. The
most frequent type of pause is parental leave – an
entitlement for new parents.
The remaining important flow is intake, which
here includes recruitment, but also return from ill or
injured status. On average, 19.9% of intake go
straight to the TES. This includes trained recruits (re-
hires or transfers from the Reserve Force), but also
recruits requiring less than a year of training, who
joined the Regular Force and move on to the TES
within the year (our model being based on annual
iterations).
Markov Chains can be treated as deterministic or
stochastic. Davies (1982) introduced a partially
stochastic Markov model. In that model, attrition is
considered an uncontrollable flow, and treated as
stochastic, whereas promotions are decided by
management, and thus treated as deterministic. Our
model does not consider promotions, but does treat
the magnitude of total intake deterministically, and is
thus also partially stochastic. Intake is set to re-fill the
training pipeline each year (with a hard cap on total
strength, i.e. the total Regular Force population)
rather than varying stochastically. This intake is also
the only pull flow in our model. It is generated by
vacancies in the destination (pull), rather than arising
spontaneously from the source (push), as defined by
Bartholomew et al (1991).
Although we set the magnitude of intake
deterministically, we vary the proportion going to the
TES versus the training pipeline stochastically. This
treatment of TES intake as a direct proportion of total
intake resembles the proportionality constraint
introduced by Nilakantan and Raghavendra (2005).
Their constraint requires that a fixed proportion of
vacancies in a given grade be filled externally. Our
model is however different in that our proportion
varies according to the observed historical
distribution.
6 MODEL LIMITATIONS
We will now highlight three limitations of our model.
We do not believe that these limitations invalidate our
results, but they should be kept in mind when
interpreting them. A first limitation has to do with
using historical data to estimate the rates of flow out
of the training pipeline. Currently, delays result from
limitations on training institution capacity or from
their sub-optimal organisation. However, our results
are meant to be applicable to future force structures,
where sources of delay will hopefully have been
reduced. Historical observation could therefore
overestimate future training durations, and
consequently, over-estimate the number of required
training pipeline positions.
A second limitation of our model is that it is based
on annual-duration iterations (taken at fiscal year-
end: 31 March). However, that day does not
correspond to the annual peak for the training
pipeline. Typically, the peak will be in summer, when
more recruits begin their training. As such, slightly
more training pipeline positions are likely to be
required than is determined by our model. It would
however be possible to introduce a correction factor
for our results based on the historical differences
between end fiscal year and annual peaks. Finally, our
model’s last important limitation is that it only
considers an overall TES target, ignoring its
composition in terms of ranks and occupations. This
will mask specific gaps in trained personnel. In the
normal course of business, retention encounters ups
and downs at various ranks and occupations, leading
to local gaps. Certain positions can be filled from a
range of different ranks and occupations, but others
cannot, and a larger training pipeline cannot address
gaps in senior or specialized positions in the short
term. It should therefore be understood that some
vacancies in the establishment are to be expected,
even when the pipeline trains enough members to
counter the raw number of departures.
Fully addressing these three limitations with an
enhanced model is likely impossible, given data
constraints. For example, given that there are only so
many members in each occupation, and that it is only
relevant to look back so many years in the data record,
accurately estimating occupation-specific training
and attrition model parameters would not be feasible.
However, decision makers can appreciate the
constraints’ impact on our modelling results, and
consider them in developing policy. Overall, our
model outputs remain informative, especially if
interpreted as slightly under-estimating true training
pipeline requirements.
Determining the Required Size of a Military Training Pipeline
361
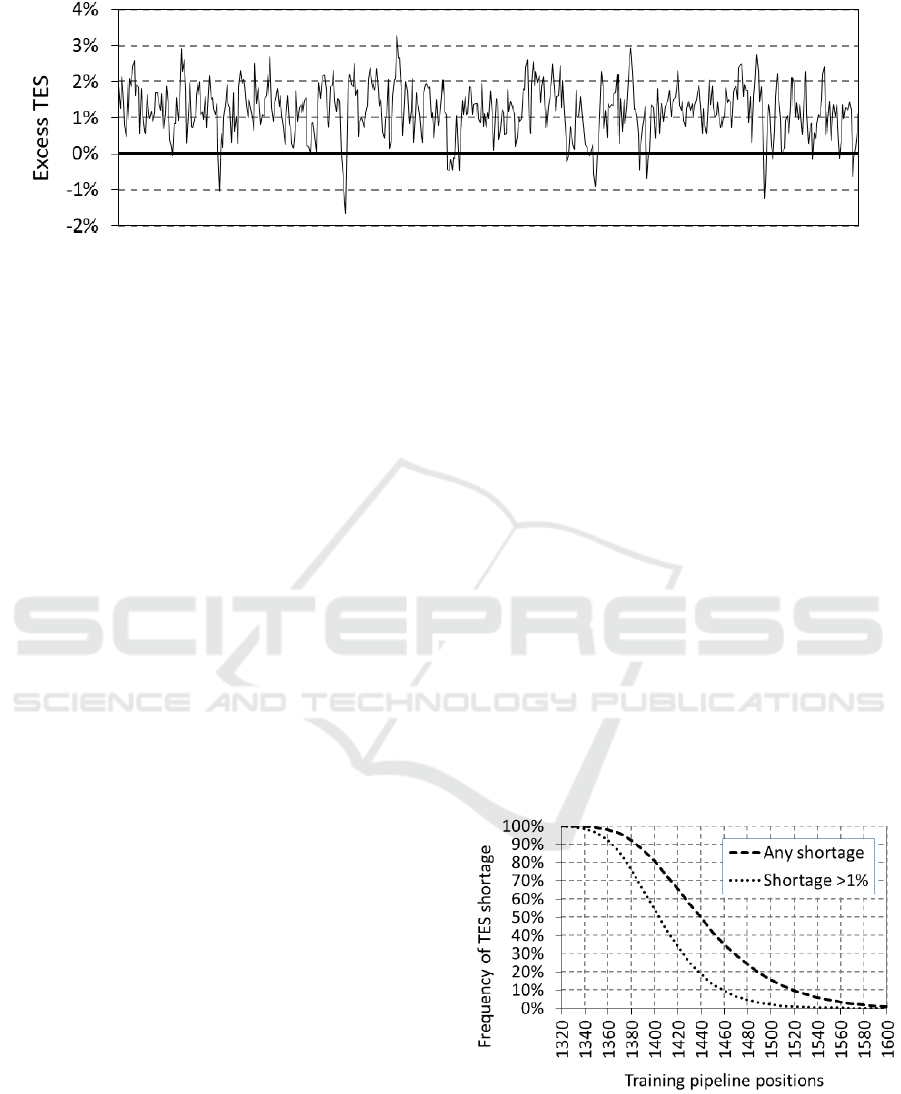
Figure 3: Five hundred years of simulation result showing excess TES – trained effective personnel generated above the set
requirement.
7 SIMULATION
We derived Monte Carlo simulation results using a
spreadsheet. Each line of the spreadsheet recorded the
state of the stocks in a given year. Subsequent years
were then computed from the line above, with the
annual flows drawn from specified Gaussian
distributions. The number of lines in the spreadsheet
then corresponds to the number of simulated years.
Our goal was to assess the adequacy of various
force structures by considering ratios of the number
of positions allocated to the TES versus the training
pipeline. From year to year, the simulated TES varied
with the simulated stochastic flows, and could either
be driven above or below the set objective. Each year,
the intake was set to re-fill the training pipeline, but
subject to a cap of total strength, which came into play
when the number of trained personnel exceeded the
target TES.
Each simulation began with a fully manned TES,
and a training pipeline full of fresh recruits. We
would then simulate 200 years, in order to allow the
composition of the pipeline to stabilize. Each
subsequent year was then captured toward the output.
As an example, Figure 3 shows 500 years of
simulation, with a ratio of 1,547 training pipeline
positions to 10,000 required TES. The graph shows
the resulting annual variation in excess TES. We see
that the excess TES tends to vary within a set range.
Whenever the excess is too great, the cap on total
strength means that the training pipeline cannot be
filled to capacity, eventually leading to fewer
graduations into the TES, and thereby eventually
reducing the excess. Conversely, when the excess is
negative, the training pipeline is filled to capacity,
allowing for eventual growth of the TES. For the ratio
of training pipeline positions to required TES used in
this example, we see that the TES meets (or exceeds)
the requirement approximately 95% of the time.
All other results presented in this paper are based
on 100,000 simulated years, which empirically
proved to be enough for very stable results.
8 RESULTS
The main consideration, in fixing the capacity of the
Regular Force’s training pipeline is ensuring that it is
sufficient to generate the required TES. Figure 4 was
obtained by simulating various ratios of training
pipeline positions to required TES. It shows how
often each ratio is expected to fail to yield the required
TES. The failure rate decreases as the capacity of the
training pipeline increases.
Because a small number of unfilled TES positions
might be a tolerable outcome, Figure 4 also shows an
alternative measure of effectiveness. This alternative
measure records how often the shortage is above 1%
of the required TES.
Figure 4: Fraction of simulated years where a TES shortage
is observed, as a function of the number of training pipeline
positions, given a 10,000 TES requirement.
However, there is a trade-off in increasing the
number of training pipeline positions. The larger
ICORES 2021 - 10th International Conference on Operations Research and Enterprise Systems
362
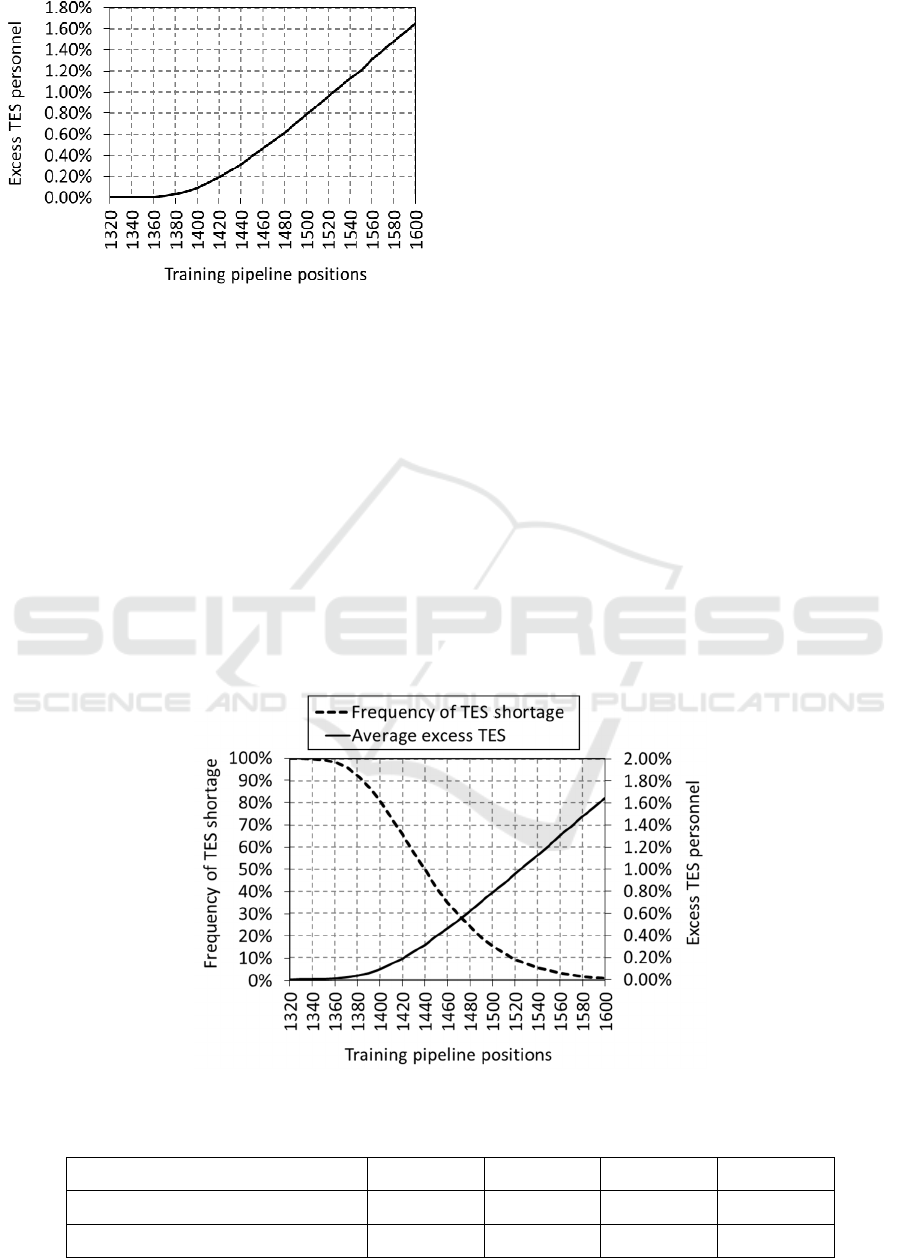
Figure 5: Mean TES above the requirement in those
simulated years when the TES requirement is met, as a
function of the number of training pipeline positions, given
a 10,000 TES requirement.
pipeline risks generating more TES than required.
This over-generation would be costly in and of itself,
but would also burden the forces with more trained
personnel than required, leading to persistent excess
costs. Figure 5 shows how this expected over-
generation increases with the size of the pipeline.
To highlight the interplay between the two metrics
shown in Figures 4 and 5, the results were combine
into Figure 6. This depiction of the results was
highlighted to departmental decision makers, as it
quantifies the trade-off involved in right-sizing the
training pipeline.
Finally, Table 1 was disseminated as our principal
deliverable. It essentially displays four scenarios from
Figure 6 corresponding to the TES requirement being
met 80%, 90%, 95% and 99% of the time. It was
obtained by manually adjusting the training pipeline
to TES ratio up or down until the simulation returned
round number frequencies of TES shortages. Table 1
can be used as a starting point on the way to settling
on a preferred training pipeline to required TES ratio,
while considering the limitations set out earlier in this
paper.
9 DISCUSSION OF MODELLING
ERROR
Guerry and De Feyter (2009) distinguish three types
of error that apply to Markov Manpower models:
statistical, estimation and specification. Statistical
error results from the stochastic nature of models and
may be reduced by increasing the number of
simulation iterations. In our case, we expect this error
to be small, given the 100,000 simulated years per
scenario, and because that increasing that number
minimally changes our results.
Estimation error is related to the accuracy to
which parameters are estimated. In our case, we relied
on 14 years of available Human Resources data to
estimate
parameters.
Older
data,
or
data
from
other
Figure 6: Combination of our two metrics into a single chart.
Table 1: Four potential choices of training pipeline to TES ratios, with corresponding metrics obtained from simulation.
Training pipeline to TES requirement 1,489:10,000 1,519:10,000 1,547:10,000 1,598:10,000
Frequency of TES shortage 80% 90% 95% 99%
Excess TES personnel 0.69% 0.95% 1.19% 1.64%
Determining the Required Size of a Military Training Pipeline
363

organisations would likely have been less
representative of the current system, and therefore of
little use in further reducing estimation error.
Therefore, although we expect our estimation error to
be substantial, there is no viable path to reducing it.
Lastly, specification error results from the model
being an inaccurate representation of reality.
Reducing specification error eventually involves
increasing the complexity of the model, thereby
increasing the number of parameters. This introduces
a trade-off with estimation error, since estimation
error increases with the number of parameters that
must be estimated. In our case, it would be
unadvisable to attempt reducing specification error by
introducing more parameters. We believe that our
model design strikes an appropriate balance between
estimation and specification error.
10 CONCLUSIONS
This paper described an application of Monte Carlo
simulation on a straightforward Markovian model of
the Canadian Armed Forces’ Regular Force training
pipeline. The results of this simulation were provided
to military staff tasked with redefining the
organization’s force mix. An advantage of the method
employed in deriving our results is that it was
straightforward and easy to follow. Despite the
complexity of the Canadian Armed Forces’ personnel
system, our modelling results were readily trusted and
appreciated.
Although the Regular Force training pipeline has
been undersized in recent years, efforts have been
directed to bringing awareness to the issue and to
improving the sustainability of the establishment. It is
hoped that our model will support this continuing
effort.
Under existing total strength caps, sustainability
can be improved by converting some TES positions
into positions for trainees, but this comes at the
expense of military capability. Alternatively, the
current TES requirement can be maintained if the
training pipeline (and by extension the total strength)
are increased.
Our model was nevertheless developed to support
the currently ongoing Force Mix and Structure
Design initiative. In that context, we have informed
the future force structure. Subject to the limitations
presented in this paper, our simulation results have
allowed initiative staff to foresee the range of possible
outcomes from different proposed force structures.
ACKNOWLEDGEMENTS
The authors would like to thank our colleague,
Dragos Calitoiu, for helpful modelling advice.
REFERENCES
Anderson T.W. and Goodman L.A., 1957. Statistical
Inferences about Markov Chains, Annals of
Mathematical Statistics, 28(1), pp. 89-110. Institute of
Mathematical Statistics. Available at: https://
projecteuclid.org/download/pdf_1/euclid.aoms/117770
7039
Bartholomew D.J., Forbes A.F. and McClean S.I., 1991.
Statistical Techniques for Manpower Planning, John
Wiley & Sons. Chichester.
Bender P., 2005. Towards a sustainable CF: A risk analysis
model (Centre for Operational Research and Analysis
Technical Memorandum DRDC CORA TM 2005-10).
Defence Research and Development Canada, Ottawa.
Couillard M., Arseneau L., Eisler C. and Taylor B., 2015.
Force Mix Analysis in the Context of the Canadian
Armed Forces, In: 32
nd
International Symposium on
Military Operational Research, Egham. ISMOR.
Available at: https://www.ismor.com/ismor_archives/
32ismor_archive/32ismor_index_shtml
Davies G.S., 1982. Control of Grade Size in Partially
Stochastic Markov Manpower Model, Journal of
Applied Probability, 19, pp. 439-443. Applied
Probability Trust.
Filinkov, A., Richmond, M., Nicholson, R., Alshansky, M.
and Stewien, J., 2011. Modelling Personnel
Sustainability: A tool for Military Force Structure
Analysis, Journal of the Operational Research Society,
62(8), pp. 1485-1497. Springer.
Guerry M.-A. and De Feyter T., 2009. Markovian
Approaches in Modeling Workforce Systems, Journal
of Current Issues in Finance, Business and Economics,
2(4), pp. 1-20. Nova Science Publishers. Available at:
https://www.researchgate.net/publication/285085602_
Markovian_approaches_in_modeling_workforce_syste
ms
Nilakantan K. and Raghavendra B.G., 2005. Control
Aspects in Proportionality Markov Manpower Systems,
Applied Mathematical Modelling, 29, pp. 85-116.
Elsevier. Available at: https://www.sciencedirect.com/
science/article/pii/S0307904X04000630
Okazawa, S., 2013. A Discrete Event Simulation
Environment tailored to the needs of Military Human
Resource Management, in WSC’13, 2013 Winter
Simulation Conference: Simulation: Making Decisions
in a Complex World, Washington, DC, USA. IEEE
Press, pp. 2784-2795. Available at:
https://ieeexplore.ieee.org/document/6721649/
Seal H. S., 1945. The Mathematics of a Population
Composed of K Strata each Recruited from the Stratum
Below and Supported at the Lowest Level by a Uniform
ICORES 2021 - 10th International Conference on Operations Research and Enterprise Systems
364

Annual Number of Entrants, Biometrica, 33(3), pp.226-
230. Oxford University Press.
Straver M. and Christopher G., 2015. Estimating the
Sustainable Canadian Armed Forces Trained Effective
Establishment (Director General Military Personnel
Research and Analysis Scientific Report DRDC-
RDDC-2015-R173). Defence Research and
Development Canada, Ottawa.
Wang J., 2005, A Review of Operations Research
Applications in Workforce Planning and Potential
Modelling of Military Training (Defence Science and
Technology Organisation Technical Report DSTO-TR-
1688). Australian Government Department of Defence.
Available at: https://www.researchgate.net/publication/
27254195_A_review_of_operations_research_applicat
ions_in_workforce_planning_and_potential_modellin
g_of_military_training
Determining the Required Size of a Military Training Pipeline
365
