
QUALITATIVE AND QUANTITATIVE PROBABILISTIC
TEMPORAL REASONING
for Industrial Applications
Gustavo Arroyo Figueroa
Electrical Power Research Institute, Reforma # 113, Cuernavaca, Morelos, México.
Keywords: Bayesian networks, temporal r
easoning, uncertainty, diagnosis, thermal power plants.
Abstract: Many real-world domains, such as industrial diagnosis, require an adequate representation that combines
uncertainty and time. Research in this field involves the development of new knowledge representation and
inference mechanisms to deal with uncertainty and time. Current temporal probabilistic models become too
complex when used for real world applications. In this paper, we propose a model, Temporal Events
Bayesian Networks (TEBN), based on a natural extension of a simple Bayesian network. TEBN tries to
make a balance between expressiveness and computational efficiency. Based on a temporal node definition,
causal-temporal dependencies are represented by qualitative and quantitative relations, using different time
intervals within each variable (multiple granularity). Qualitative knowledge about temporal relations
between variables is used to facilitate the acquisition of the quantitative parameters. The inference
mechanism combines qualitative and quantitative reasoning. The proposed approach is applied to a thermal
power plant through a detailed case study, with promising results.
1 INTRODUCTION
In the last years the operating conditions of thermal
power plants have changed. Today, the operation of
thermal power plants must be optimal considering
higher productions profits, safer operation and
stringent environment regulation. An additional
factor is the increment of the age of the plants. The
reliability and performance of the plants is affected
by its age. This means and increase in the number of
equipment failures, thus increasing the number of
diagnoses and control decisions which the human
operator must make. Under this conditions the
complexity of the operation of thermal power plants
have been increased significantly.
As a result of these changes, the computer and
i
nformation technology have been extensively used
in thermal plant process operation. Distributed
control systems (DCS) and information management
systems (IMS) have been playing an important role
to show the plant status. However, in nonroutine
operations such as equipment failures and extreme
operation (start up phase, changes in the load, etc.),
human operators have to rely on their own
experience. During disturbances, the operator must
determine the best recovery action according to the
type and sequence of the signals received. In a major
upset, the operator may be confronted with a large
number of signals and alarms, but very limited help
from the system, concerning the underlying plant
condition. Faced with vast amount of raw process
data, human operators find it hard to contribute a
timely and effective solutions.
The process industry demands new computer
integrate
d technologies the reduce operator´s
working burden by providing operation support
systems. Process operations are knowledge-intensive
work task because thermal plants are large, complex
and influenced by unexpected disturbances and
event over the time. Artificial Intelligent applications
and expert systems in particular, are recognized as
providing efficient solutions to wide range of
industrial problems.
Artificial intelligence applications are showing a
trend
toward to real world domains, such as medicine,
real-time diagnosis, communications, planning,
financial forecasting and scheduling. These
applications have revealed a great need for powerful
methods for knowledge representation. In particular,
the evolutionary nature of these domains requires a
representation that takes into account temporal
information. The exact timing information for things
like lab-test results, occurrence of symptoms,
151
Figueroa G. (2004).
QUALITATIVE AND QUANTITATIVE PROBABILISTIC TEMPORAL REASONING - for Industrial Applications.
In Proceedings of the First International Conference on Informatics in Control, Automation and Robotics, pages 151-156
DOI: 10.5220/0001133701510156
Copyright
c
SciTePress

observations, measures, as well as faults, can be
crucial in this kind of applications.
Aside from temporal considerations, the world
domain knowledge is imprecise, incomplete and not
deterministic. The temporal model must be able to
deal with uncertainty. Among the many formalism
proposed for dealing with uncertainty, one of the most
used techniques for the development of intelligent
systems are probabilistic networks, also known as
Bayesian Networks, causal networks or probabilistic
influence diagrams. Bayesian networks (BN) are a
robust and sound formalism to represent and handle
uncertainty in intelligent systems in a way that is
consistent with the axioms of probability theory (Pearl,
2000). Although BN were not designed to model
temporal aspects explicitly, recently Bayesian
networks have been applied to temporal reasoning
under uncertainty (Santos 1996; Arroyo and Sucar,
1999, Galan and Diez 2002). Prior temporal modeling
techniques have often made a trade-off in
expressiveness between semantics for time and
semantics for uncertainty. Therefore, to integrate
uncertainty and time, it’s necessary a combined
approach integrating strong probabilistic semantics for
representing uncertainty and expressive temporal
semantics for representing temporal relations.
In this paper, we present the definition and
application of an approach for dealing with
uncertainty and time called Temporal Event
Bayesian Network, based on a natural extension of a
simple Bayesian network. TEBN tries to make a
balance between expressiveness and computational
efficiency. Based on a temporal node definition,
causal-temporal dependencies are represented by
qualitative and quantitative relations, using different
time intervals within each variable (multiple
granularity. The inference mechanism combines
qualitative and quantitative reasoning. The proposed
approach is applied to the diagnosis and prediction
of events and disturbances (events sequence) to
assist the operator in real time assessment of plant
disturbances, and in this way contribute to the safe
and economic operation of thermal power plants.
2 DEFINITION OF A TEBN.
Temporal Event Bayesian Network (TEBN) allows the
representation of temporal and atemporal information
in a probabilistic framework. A TEBN is capable of
representing each variable with its interactions over
multiple points of time. The domain is defined over
time intervals. The state of the domain is represented
by a value at a given time interval. Santos (Santos
1996) use a similar concept, but they used the time
interval only as a temporal constraint. In our approach,
a time interval is an additional component of the
network.
TEBN make a balance between the robust
semantics of Bayesian Networks and the expressive
temporal semantics of the interval algebra. The
temporal expressiveness is defined by the time
intervals. The balance between the exactness and the
complexity of the temporal model is a function of
the numbers of time intervals.
Intuitively, a temporal node consists of a set of
states or values, e.g. {true, false}, {occur, does not
occur}, {high, normal, low}, that the variable or
event can take, and a set of temporal intervals
associated to each state or value of the variable or
event.
Definition 1. A Temporal Node (TN) is an
ordered pair (E, I) in which E is a set of states or
values of a random variable, and I is a set of time
intervals associated to each state or value of the
variable.
Definition 2. A causal-temporal relationship
(CTR) describes a relationship between two
temporal nodes A(Ea, Ia) and B(Eb, Ib), where A is
considered the “cause” and B is considered the
“effect”. Formally, the CTR is written as A(R, P)B
where R is the set of temporal qualitative
relationship between the time intervals, and P is the
causal-temporal quantitative relationship, defined as
a conditional probability matrix. Graphically, a CTR
is represented by a directed edge from the cause
node to the effect node, labeled with R, with a joint
probability distribution P.
A Temporal Event Bayesian Network is a
directed acyclic graph, which consists of finite set of
temporal nodes and a finite set of causal-temporal
relationships.
Definition 3. A TEBN is an ordered pair, (N, T),
where N is a set of temporal nodes and T is set of
causal-temporal relationships given by R and P. Then
EBN=(E, I, R, P) is called a Temporal Event Bayesian
Network.
The TEBN model has two reasoning
mechanisms: qualitative and quantitative temporal-
causal reasoning. Qualitative reasoning is based on
the interval algebra [Allen, 1983]. It is important to
know the qualitative information about the timing
relationships between the events. The qualitative
reasoning has two levels of abstraction. In a superior
level, we use a simplified temporal diagram of the
history of the process using Allen’s representation in
order to define the general relation between the
temporal range of occurrence of the events. In an
inferior level, we apply the transitivity algorithm to
get the temporal relations between each time interval
that defines the temporal node. Qualitative reasoning
permits an early diagnosis of the domain based on
the temporal consistency. This early diagnosis gives
ICINCO 2004 - INTELLIGENT CONTROL SYSTEMS AND OPTIMIZATION
152
a preliminary idea about state of domain. The
qualitative mechanism is explained in more detail in
the example of the next section.
The quantitative reasoning mechanism is based
on probability propagating. The method for
propagating probabilities of a TEBN is an extension
of the polytree and multiconnected algorithms
proposed in the literature (Pearl, 2000). For some
evidence e at the time interval u the posterior
probability of a variable B is as follows:
P(e,u
k ⏐
b
i
,o
j
) P(b
i
,o
j
)
P((b
i
o
j
) | (e,u
k
)) = ------------------------
P(e,u
k
)
where P((b
i
,o
j
) | (e,u
k
)) is the probability associated to
the value b
i
in time interval o
j
given the evidence e in
the time interval u
k
.
The reasoning in TEBN consists in instantiating the
input temporal variables (this can be any variable into
the network) and propagating their effect through the
network to update the probability of the hypothesis
variables (diagnosis and prediction). The reasoning
mechanism starts when a temporal variable is
instantiated, and the probability of all temporal nodes
is update. The quantitative reasoning gives the state of
the domain with some probability value.
The qualitative knowledge about temporal
relations between temporal nodes is relatively easy to
obtain from domain experts. With this knowledge is
possible to know the temporal relations between
events and this is used to facilitate the acquisition of
the quantitative parameters (conditional probabilities).
For instance, given a particular qualitative relation
between nodes A and B, some values in the
conditional probability matrix, P(B/A), are set to zero.
3 AN EXAMPLE OF
APPLICATION
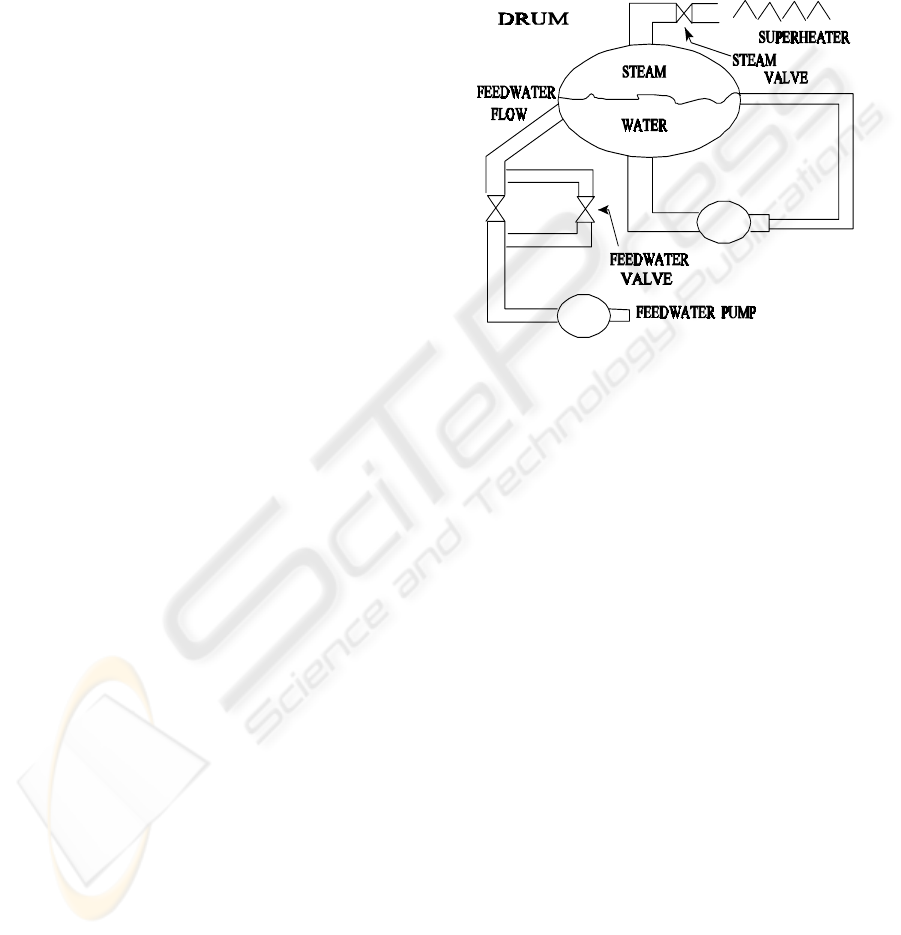
As an illustrative example, we present the drum level
disturbance when a power load increment occurs. The
drum is a subsystem of a thermal power plant. This
subsystem provides steam to the superheater and water
to the water wall of a steam generator. Figure 1 shows
a simplified diagram of a drum system in a thermal
power plant. For the proposes of demonstration,
assume the following hypothetical case.
"The drum is a tank with a steam valve at the
top, a feedwater valve at the bottom, a feedwater
pump which provides water to the drum and a level
control system. The drum level (DRL) can increase
by the increase of the feedwater flow (FWF). The
feedwater flow can increase by two main causes: the
augmentation in the current of feedwater pump
(FWP) and the increase of the opening of the
feedwater valve (FWV). This will lead to an increase
in drum level to a dangerous level. The operator
must open the steam valve in order to increase the
steam flow. This will lead to a reduction of the water
drum level in the drum tank so that the level will
decrease to safe levels. Both disturbance can lead to
down thermal power plant”.
Figure 1: Steam Generator Drum system.
In the process, a signal exceeding its specified limit
of normal functioning is called as an event, and a
sequence of events that have the same underlying
cause are considered as a disturbance. In the
example, the feedwater flow (FWF) can be caused
by two different disturbances: a power load
increment or a control system failure. These
disturbances are characterized respectively by the
feedwater current augmentation (+FWP) and
feedwater opening increase (+FWV).
To determine which of both disturbances are
present is a complicated task. We need additional
information to determine which it is the real cause.
One of these is the temporal information. We can
select the hypothesis of failure according to the time
interval in which the disturbance occurs. The
dynamic of the FWP is faster than the dynamic of
the FWV. In order to reason about the sequence of
facts and disturbances that occur, we require a
temporal representation.
The knowledge representation uses the Allen’s
interval algebra (Allen, 1983) and its thirteen
relations as temporal basis definition and a
probabilistic framework for dealing with quantitative
uncertainty. Figure 2 and table 1, depict a small
TEBN with five temporal nodes, four edges,
temporal relations between nodes and a priori
probabilities. Each temporal node is associated to its
time intervals., all nodes except the node steam
valve have two time intervals. The formalism is
QUALITATIVE AND QUANTITATIVE PROBABILISTIC TEMPORAL REASONING - for Industrial Applications
153
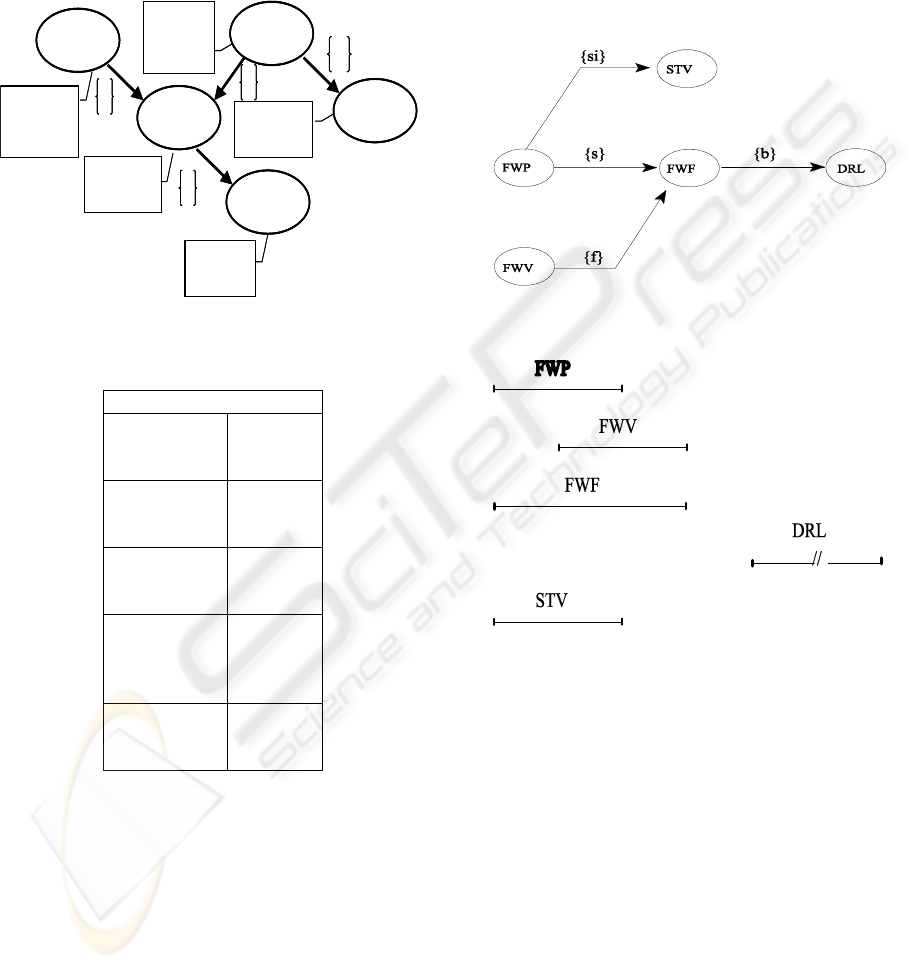
based on the probability of the event occurrence at a
time interval. In this case, the TEBN is an event
network (occurs or does not occur): the event occurs
at the time interval one (for example FWP, O1); the
event occurs at the time interval two (FWP, O2); and
the event does not occur (FWP). The events might
occur only in single time interval.
Figure 2: TEBN for Drum system example.
Table 1: Event probabilities for TEBN
Event Probabilities
FWV, I1
FWV, I2
¬FVW
0.30
0.60
0.10
FWP, O1
FWP, O3
¬FWP
0.60
0.30
0.10
FWF, U1
FWF, U2
¬FWF
0.51
0.48
0.01
STV, Q1
STV, Q2
STV, Q3
¬STV
0.47
0.29
0.12
0.12
DRL,R1,
DRL, R2
¬DRL
0.51
0.48
0.01
4 PROCESS DIAGNOSIS
EXAMPLE
In this section we present the application of the
TEBN model for diagnosis of disturbances in the
drum system depicted in section three. According to
the example, there are two possible causes of an
increase in the feedwater flow (FWF): an
augmentation in feedwater pump current and an
increase in the opening of the feedwater valve.
Figure 3 and figure 4 show the simplified
temporal diagram and the consistent scenario of the
drum level disturbance. Theses diagrams define the
qualitative temporal relation between the time range
of event occurrence. For instance the temporal
relation between the temporal range of FWP and
FWF is start and the temporal relation between the
temporal range of FWV and FWF is finishes.
FWV
Feedwater
valve
opening
increase
FWF
STV
DRL
FWP
Feedwater
pump
current
increase
Feedwater
flow
increase
Drum
Level
High
Steam
valve
increase
f
b
si
s
FWV
FWV
Feedwater
valve
opening
increase
FWF
FWF
STV
STV
DRL
DRL
FWPFWP
Feedwater
pump
current
increase
Feedwater
flow
increase
Drum
Level
High
Steam
valve
increase
f
f
b
b
si
si
s
s
Figure 3: Simplified temporal diagram of the drum
system.
Figure 4: Temporal consistent scenario of the drum
system.
Figure 5, shows the temporal relations between the
time intervals of node FWP and node FWF. The
intervals at the top, O1 and O2 represent the time
intervals of FWP and the intervals U1 and U2
represent the time interval of the FWF. The relations
between the four intervals are shown in the right.
These relations can be obtained for each pair of
nodes. Both diagrams, permits to made a preliminary
selection of hypotheses and give an initial idea about
the disturbance (faulty) that occurs. For this the time
relations are considered, which produce a set of
temporal constraints that permit to select some
hypotheses using a consistency algorithm.
ICINCO 2004 - INTELLIGENT CONTROL SYSTEMS AND OPTIMIZATION
154
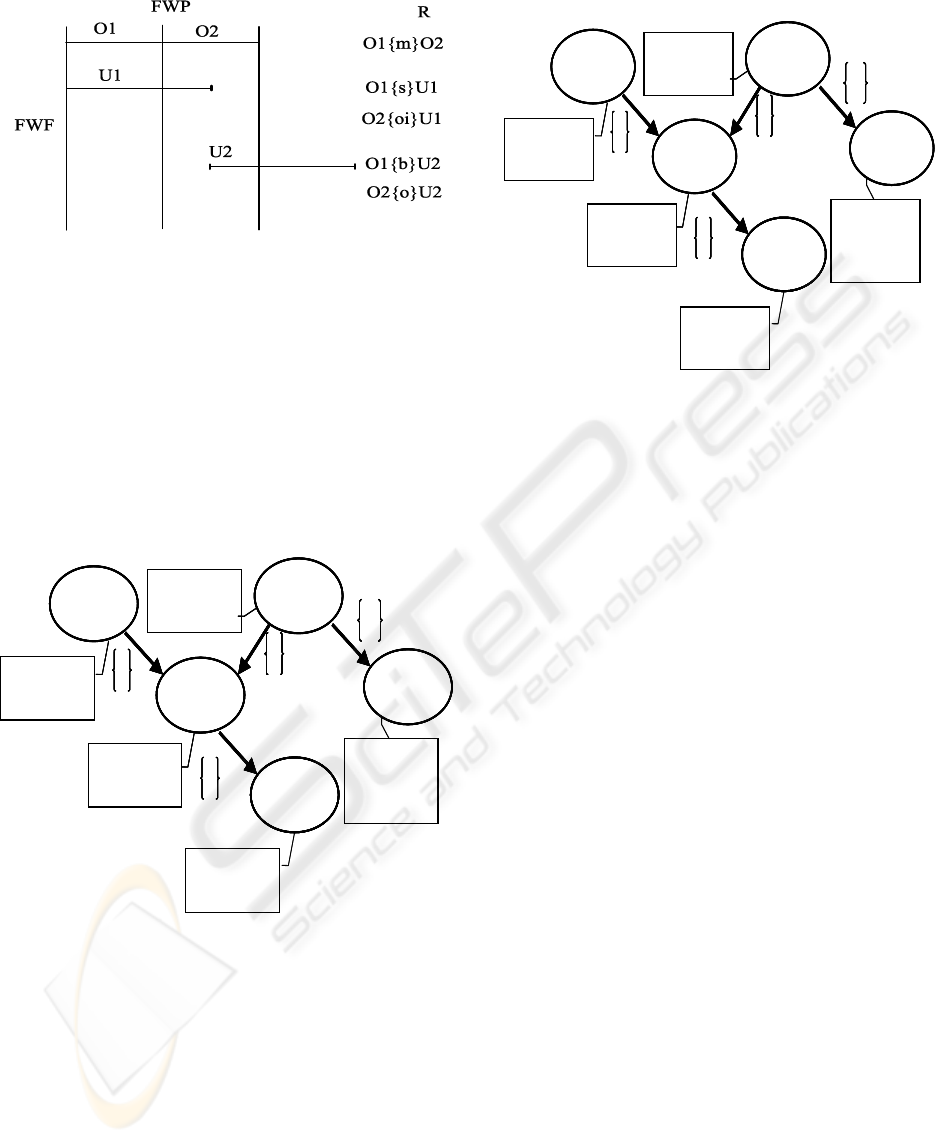
Figure 5: Temporal relations between the FWP and FWF
time intervals
Quantitative reasoning in the TEBN gives the most
probable hypotheses. The causal-temporal
relationships between events are used for
determining the most probable cause (disturbance).
For instance, the figure 6 depicts the case when the
event drum level high (DRL) occurs in the time
interval R1. In this case the most probable cause is a
feedwater pump current augmentation (+FWP). This
disturbance may be characterized by a power load
increase.
Figure 6: The drum level high occurs at the time interval
R1
Figure 7 depicts the case when the drum level high
(DRL) occurs in the time interval R2. In this case the
most probable cause is an increase in the opening of
the feedwater valve. This disturbance may be
characterized by a failure in the level control system.
To confirm which is the most probable disturbance
is needed the time of occurrence of the increase of
feedwater flow. This reasoning makes it possible to
answer questions such as: “The event drum level
high occurred 1:30 minutes after that the feedwater
flow increase occurred. What is the most probable
disturbance (cause)?”.
FWV
FWF
STV
FWP
f
b
si
s
FWV
FWV
FWF
FWF
STV
STV
DRL
DRL
DRL
FWPFWP
f
f
b
b
si
si
s
s
DRL, R1 = 0.00
DRL, R2 = 1.00
¬DRL = 0.00
STV, Q1 = 0.36
STV, Q2 = 0.32
STV, Q3 = 0.15
¬STV = 0.17
FWP, O1 = 0.43
FWP, O2 = 0.39
¬FWP = 0.18
FWV, I1 = 0.29
FWV,I2 = 0.70
¬FWV = 0.01
FWF U1 = 0.05
FWF,U2 = 0.95
¬FWF = 0.00
FWV
FWV
FWF
FWF
STV
STV
FWPFWP
f
f
b
b
si
si
s
s
FWV
FWV
FWF
FWF
STV
STV
DRL
DRL
DRL
DRL
DRL
DRL
DRL
FWPFWP
f
f
b
b
si
si
s
s
s
s
DRL, R1 = 0.00
DRL, R2 = 1.00
¬DRL = 0.00
STV, Q1 = 0.36
STV, Q2 = 0.32
STV, Q3 = 0.15
¬STV = 0.17
FWP, O1 = 0.43
FWP, O2 = 0.39
¬FWP = 0.18
FWV, I1 = 0.29
FWV,I2 = 0.70
¬FWV = 0.01
FWF U1 = 0.05
FWF,U2 = 0.95
¬FWF = 0.00
Figure 7: The drum level high occurs at the time interval
R2
In this model, the time range definition of the
intervals is independent of the hour of the day. In
many real-domains the events do not occur as a
function of the day hour. Under this situation, the
TEBN is a model relative, not absolute. The
reasoning mechanism starts when any event in the
network is detected. The time interval definition is
only dependent of the causal-temporal relationships
between the events.
FWV
FWF
STV
FWP
f
b
si
s
FWV
FWV
FWF
FWF
STV
STV
DRL
DRL
DRL
FWPFWP
f
f
b
b
si
si
s
s
DRL, R1 = 1.00
DRL, R2 = 0.00
¬DRL = 0.00
STV, Q1 = 0.59
STV, Q2 = 0.26
STV, Q3 = 0.10
¬STV = 0.05
FWP, O1 = 0.77
FWP, O2 = 0.22
¬FWP = 0.01
FWV, I1 = 0.32
FWV,I2 = 0.52
¬FWV = 0.16
FWF U1 = 0.95
FWF,U2 = 0.04
¬FWF = 0.01
FWV
FWV
FWF
FWF
STV
STV
FWPFWP
f
f
b
b
si
si
s
s
FWV
FWV
FWF
FWF
STV
STV
DRL
DRL
DRL
DRL
DRL
DRL
DRL
FWPFWP
f
f
b
b
si
si
s
s
s
s
DRL, R1 = 1.00
DRL, R2 = 0.00
¬DRL = 0.00
STV, Q1 = 0.59
STV, Q2 = 0.26
STV, Q3 = 0.10
¬STV = 0.05
FWP, O1 = 0.77
FWP, O2 = 0.22
¬FWP = 0.01
FWV, I1 = 0.32
FWV,I2 = 0.52
¬FWV = 0.16
FWF U1 = 0.95
FWF,U2 = 0.04
¬FWF = 0.01
The use of qualitative reasoning mechanism
permits an early diagnosis. The early diagnosis gives
a preliminary idea of the events and disturbance that
occurred. The quantitative reasoning gives the
occurrence of events and disturbances with some
probability values. The TEBN has been applied into
two systems of a steam generator: drum level system
and condenser system. The result obtained in this
two subsystems indicate that it can be useful for
many uncertainty temporal reasoning tasks that
involve prediction and diagnosis in real complex
environments (Arroyo et al., 2000).
5 EMPIRICAL EVALUATION
Table 2 summarizes the results of simulating failures
for the four disturbances of the feedwater and
superheater systems. The process data was generated
by a full scale simulator of a thermal power plant. We
selected 80% of this data-base (800 registers) for
parameter learning and 20% (200 registers) for
evaluation. The model was evaluated empirically
using two scores: accuracy and a measure based on the
Brier score (total square error). The Brier score is
defined as: BS = Σ
n
i=1
(1 – P
i
)
2
. P
i
is the marginal
posterior probability of the correct value of each node
QUALITATIVE AND QUANTITATIVE PROBABILISTIC TEMPORAL REASONING - for Industrial Applications
155

given the evidence. The maximum Brier score is:
BS
MAX
= Σ
n
(1)
2
. A relative Brier score is defined as:
RBS (in %) = {1 – (BS
/ BS
MAX
) } x 100.
The results of the evaluation are shown in terms of
the mean and the standard deviation for both scores.
These results show the prediction and diagnosis
capacity of the temporal model in a real process. Both
scores are between 80 and 97% for all the set of tests,
with better results when intermediate nodes are
observed, and slightly better results for prediction
compared to diagnosis. We consider that these
differences have to do with the “distance” between
assigned and unknown nodes and with the way that the
temporal intervals were defined. We are encouraged
by the fact that the model can produce a reasonable
accuracy in times that are compatible with real time
decision making.
Table 2: Empirical evaluation results
Parameter µ σ
Prediction
% of RBS
% of accuracy
87
84
9.19
14.98
Diagnosis
% of RBS
% of accuracy
84
80
8.09
11.85
Diagnosis and
prediction
% of RBS
% of accuracy
96
95
4.71
8.59
6 CONCLUSIONS
The TEBN generates a formal and systematic
structure used to model the temporal evolution of
dynamics domains. TEBN is a hybrid model that
combines a qualitative representation based on
interval algebra with a quantitative representation
based on a natural extension of Bayesian networks.
Each event or variable occurrence is associated with
a time interval. The definition of the numbers of
time intervals for each variable is free (multiple
granularity) and can be see as a trade off between
the complexity and the accuracy needed for
depicting the knowledge of the temporal domain.
The model combines qualitative and quantitative
causal-temporal reasoning mechanisms. The
qualitative reasoning mechanism is based on the
interval algebra and permits an early diagnosis. The
early diagnosis gives a preliminary idea about of
process state. The quantitative reasoning mechanism
is based on the propagation of probabilities and
gives the occurrence of events and disturbances with
some probability values.
The formalism satisfies the requirements of
temporal knowledge acquisition, low computational
cost and temporal expressiveness. The qualitative
knowledge about temporal relations between
temporal nodes is relatively easy to obtain from
domain experts and is used to facilitate the
acquisition of the quantitative parameters
(conditional probabilities).
Our future work will be focused on developing and
integrating an intelligent support system (ISS) to aid
the operation of human operators of thermal power
plants. The ISS will be integrate by four modules:
signal validation, supervisory system, diagnostic
system, and planning systems. The ISS will be used to
assist an operator in real-time assessment of plant
disturbances and in this way contribute to the safe and
economic operation of power plants.
REFERENCES
J. F. Allen, 1983. Maintaining Knowledge about Temporal
Intervals. Communications of the ACM, 26(11):832-
843.
G. Arroyo-Figueroa and L.E. Sucar, 1999. A temporal
Bayesian Network for diagnosis and prediction, In Proc.
15
th
UAI Conference, 13-20.
G. Arroyo-Figueroa, Y. Alvarez and L.E. Sucar, 2000,
SEDRET-an intelligent system for the diagnosis and
prediction of events in power plants, Expert Systems with
Applications, 18:75-86.
S. F. Galan and F. J. Diez, 2002. Networks of probabilistic
events in discrete time, Int. J. of Approximate Reasoning,
30 : 181-202.
Peter Haddawy, 1996. A Logic of Time, chance, and
action for representing plans. Artificial Intelligence,
80(2), 243-308, 1996.
K. Murphy, 2002, Dynamic Bayesian Networks:
Representation, Inference and Learning, PhD Thesis,
UC Berkeley, Computer Science Division.
Judea Pearl, 2000, Causality, models, reasoning and
inference, Cambridge University Press: London.
E. Santos Jr. and J. D. Young, 1996, Probabilistic Temporal
Networks. Report AFIT/EN/TR96-006 AFIT.
ICINCO 2004 - INTELLIGENT CONTROL SYSTEMS AND OPTIMIZATION
156
