
Analysis of Experience:
Fully Web Based Introductory
Course in Electrical Engineering
Vello Kukk
Tallinn Technical University, Ehitajate tee 5, 19086, Tallinn, Estonia
Abstract. This paper summarizes analysis of the experience obtained form
teaching large student group using fully web-based tools. General descriptions
and formal parameters of the course along with numerical data concerning num-
bers of different actions are given. Analysis of collected data and changes in
students' opinions are presented. Some critical conclusions are given con-
cerning the role of lectures and lab works are made. Problems related to univer-
sity's information system are also concerned.
1 Introduction
This paper summarizes experience obtained during 3 year fully web-based delivery of
the course Circuits, Systems, and Signals to large student groups. We describe pa-
rameters of the course, some details of the activities and their implementation. The
numbers of different actions are presented and results are analyzed. Analysis of the
results of surveys in which students were asked about their opinions is also given.
The course is typical for technology-oriented curricula: including laboratory prac-
tice as very important component and possibility to use large amount of different
training problems. Experience has shown that significance of labs is increasing rap-
idly: freshmen have very narrow practical experience, mostly related to mouse and
keyboard only. It follows that labs have become one of the basic learning tool, they
are not simply application of theory. It seems that students prefer real lab work to
virtual experiments. At the same time, traditional organization of lab hours means
strong time and space restrictions. Real need of time may differ by 2-3 times for dif-
ferent students. All this makes labs into the most critical component of web-based
course as in many e-learning environments their existence is simply not supported.
A specific property of the course described is large amount of students - about 150.
It follows that automation level must be very high. That produces high pressure to
components that are time and space sensitive or need authentication, as labs and class
tests (quizzes).
A good property of that course is possibility to formulate a large number of prob-
lems which can be solved using different methods and which can be provided in fully
automated environment. Even such a massive solution of tests may seem to be too
Kukk V. (2004).
Analysis of Experience: Fully Web Based Introductory Course in Electrical Engineering.
In Proceedings of the First International Workshop on e-Learning and Virtual and Remote Laboratories, pages 111-118
DOI: 10.5220/0001150501110118
Copyright
c
SciTePress

formal and opposing 'discovering' style, that is not true. We describe below how rather
simple tests using selectable answers help a student to train different common ap-
proaches to problem solving. The same environment was used to provide the course
'Operating Systems' and that was completely different - no efficient simple labs, ex-
tremely difficult to develop tests. However, home works and reviews were sometimes
considered by students as practically useful (but not always). However, all that was
very difficult to automate, that followed delays in evaluation etc. Therefore, this
course appeared to be more like to humanitarian or social one than technology-
oriented.
During three year period when the course was fully implemented in the web (except
lab measurements, of course), the number of required actions was constantly in-
creased. However it did not cause protests from students. There are few opinions that
have clear trend; most of the characteristics have been almost constant in 3 years.
2 Description of the Course
The course has standard 16 week outline including 32h of lectures, 16h of labs, and
16h of exercising. The web version uses strict schedule of lectures. Scheduled exer-
cises (in classrooms) appeared to be extremely non-efficient waste of time. An ex-
periment showed that efficient exercising can be implemented in a computer class,
where every student is working on his own problems and the teacher is acting as a
moving consultant. The labs were organized in a flexible mode: student can choose
the most appropriate time for his lab action. One reason for such organization was
strict dependence between actions implemented as prerequisites in the same and/or
different action classes. For example, to get access to a class test (=partial exam) one
must have completed certain lab and some home tests as prerequisites.
2.1 Home Tests
Students have to pass web-based home tests that are prerequisites to labs. Home tests
are not authenticated and therefore they are used as a training facility (class tests are
based on the same tasks). Total number of tests is 12; acceptance uses 2 criteria: either
student reaches maximum level (10) or he/she has used maximum number of attempts
(20). All the tests use selectable answers and have the following structure. A prototype
situation is given (for example, circuit diagram with component values) and the stu-
dent is asked to find from other 4 cases those where some characteristic (for example,
current value) is the same. So, in every task the number of correct ticks is from 0 to 4.
Evaluation is dynamic: the student has current state evaluated by levels 0...10 (initial
is 0). After receiving result (0...4) from student, the server calculates new state using
special transition table (a fuzzy controller). The minimum number of attempts to
reach max level is 5.
Those tests are not intended to train application of formulae or standard calculation
scenarios. In most cases selection of correct answer can be started from exclusion of
wrong ones by simple calculation or observation. To find matches, one should com-
110

pare some simple values or structures; usually full solution is not needed. So, the main
purpose of those tests is to train different simple evaluation and recognition methods,
the most valuable for an engineer.
Every test is based on set of about 1500-200 different tasks. The number of struc-
turally different pictures in a test is about 40-50 but automatic rearrangement produces
4-30 times more schematics. (Circuit diagrams and graphs are generated at client
side).
2.2 Labs
The student must pass 7 lab works of different complexity and structure. Four labs
must be completed during the lab time slot (55 or 100 minutes), three need additional
homework (after measurements completed, the state is fixed to 'measured' and turns
into 'done' only after completing home calculations. Labs have linear order and a stu-
dent can register to the next lab only after the previous one has become into state
'done'. In addition, some of home tests must be done.
Because of those conditions, a student must register to the lab. Time schedule is
flexible and not fixed in the beginning: time slots are generated during semester de-
pending upon the number of students having access to specific lab.
Lab report is composed using internet form that is saved in database automatically.
In most cases, only those fields are active that can be filled in the current stage of lab.
If possible, inconsistent data are shown in different color and the report cannot be
closed until any required field has left empty. Graphical representation of data is gen-
erated automatically at client side. Measurements are made in groups of two students
but reports are individual and up to four aspects are evaluated by teacher (preparation,
measurements, homework, and conclusions).
2.3 Class tests (partial exams)
In class tests, the same tasks as in home tests are to be solved but numerical answer
must be given. In every class test, nine tasks must be solved selected from three dif-
ferent tests and so, 4 class tests are formed. Time slot for every class test is 18 min-
utes.
Every class test has two prerequisites: one lab and the previous test. For example,
to get access to class test no 3, lab no 4 must be completed, as well test no 2; indi-
rectly, home tests 1... 8 must be completed.
Class test is passed when 5 correct answers are given. In case of unsuccessful re-
sult, student can repeat it not earlier than after 3 days. The number of attempts is lim-
ited by this delay only and of course, all actions must be completed by the end of
semester.
111

2.4 Passive course components
We call passive course components everything that is delivered as documents. This
includes:
1. Time schedule (lectures and exercises)
2. Electronic textbook (internationally available web book by T.R.Kuphaldt)
3. Slides (lecture notes) supporting lectures and exercises (linked to time
schedule)
4. Additional slides and documents explaining solution methods or delivering
material that is not included in lecture notes
5. Audio files: recorded lectures
6. Links to web pages (eg MIT)
7. Downloadable files (eg PSpice)
8. Glossary
Using of passive components has not been logged.
2.5 Learning court
Learning court delivers problems from a set of ~40 modules representing different
components of the course. This set includes even some very low level tasks containing
math or physics (units, complex numbers, differential equations etc). The tasks used in
home and class tests are also represented. The modules are linked by means of fuzzy
control that opens and closes modules depending upon how student responds. The
solution given by a student is not classified simply as correct or wrong (as in tests) but
classification depends upon which error is presumably made. In case of incorrect
answer, explanation and links to passive materials are given. All actions are logged
but only for statistics and for further refinement of mechanisms. The court is never
closed - a student can continue solving problems in a module even he or she has
reached the max level or even completed the course.
3 Statistics
In fall semester 2003, 167 students registered to the course and 134 of them (80%)
completed in time. They solved 17,623 tasks in home tests (total number, also those
which did not complete the course). Never before e-course we could propose such
amount of exercises to students (but they asked more).
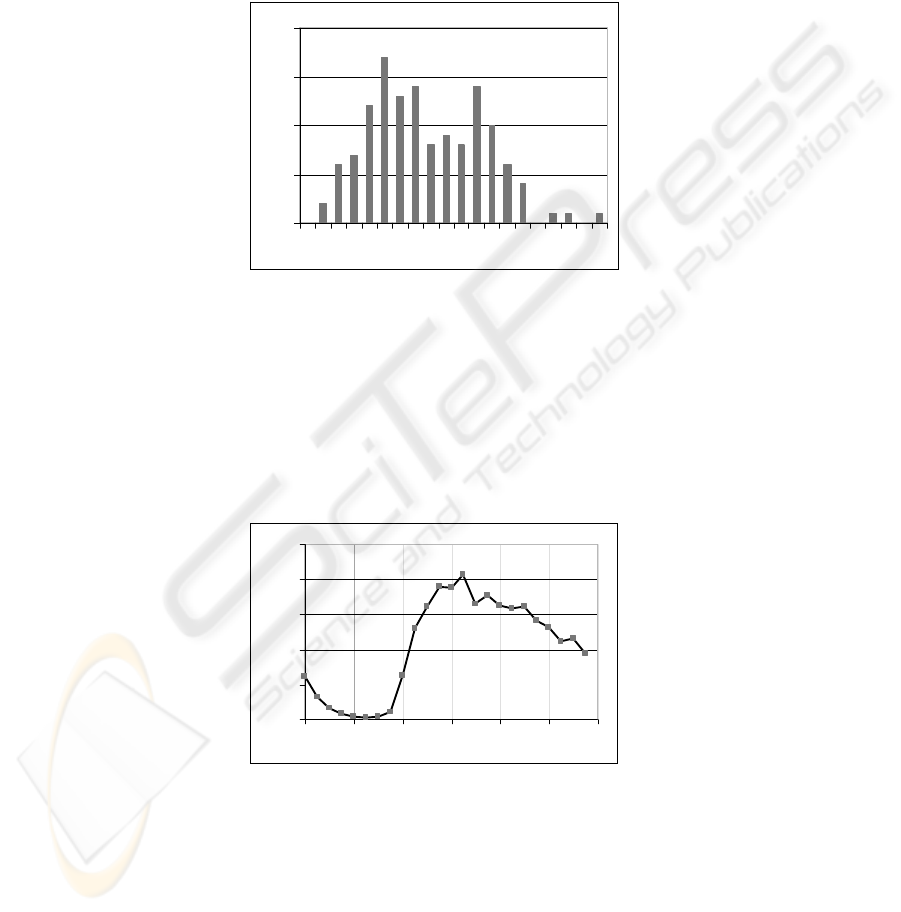
The average number of attempts per test was 9.7, as the top 20 students needed 8.2
attempts (the minimum is 5), 20% of bottom students had average 10.4 attempts. If the
best 2 needed totally 74 attempts (minimum is 60) then the worst results were 180
(maximum is 240). The histogram is shown on Fig. 1 where average number of at-
tempts per test is located on x-axis. One can distinguish three groups: one producing
peak at about 9, the second at 12, and the third is the tail with more than 14 attempts.
112
It is reflected also in survey: some students declared the tests too simple, some - too
difficult.
Now all the tasks are evaluated using the same scheme. The conclusion is that this
mechanism is too general; it must be more adaptive to the person and at least two
different tracks must be implemented. Probably, answers should be analyzed, the tasks
to be clustered, and controllers selecting tasks and evaluating results, must be modi-
fied.
0
5
10
15
20
6
7
8
9
10
11
12
13
14
15
Fig. 1. Home test attempts: histogram shows average frequency of attempts. Minimum number
for one test is 5 and maximum is 20.
Students registered to 841 class tests, 566 of them were done successfully, 73 were
repeated, and 22 no-shows (2.6%) were counted.
Archive contains 1032 lab reports. There were 32 no-shows (3%).
Fig. 2 shows distribution of login time.
0%
2%
4%
6%
8%
10%
0 4 8 12 16 20 24
Fig. 2. Distribution of login time: percentage of logins appeared in every hour. Maximum load
is at noon and after that decreases almost linearly to midnight.
113
Obviously, maximum load for server is expected between 10 and 18. This should
be considered when more e-courses will be introduced. Unfortunately, this is the max
load time for other activities too. Fortunately, the load is high also after 17.
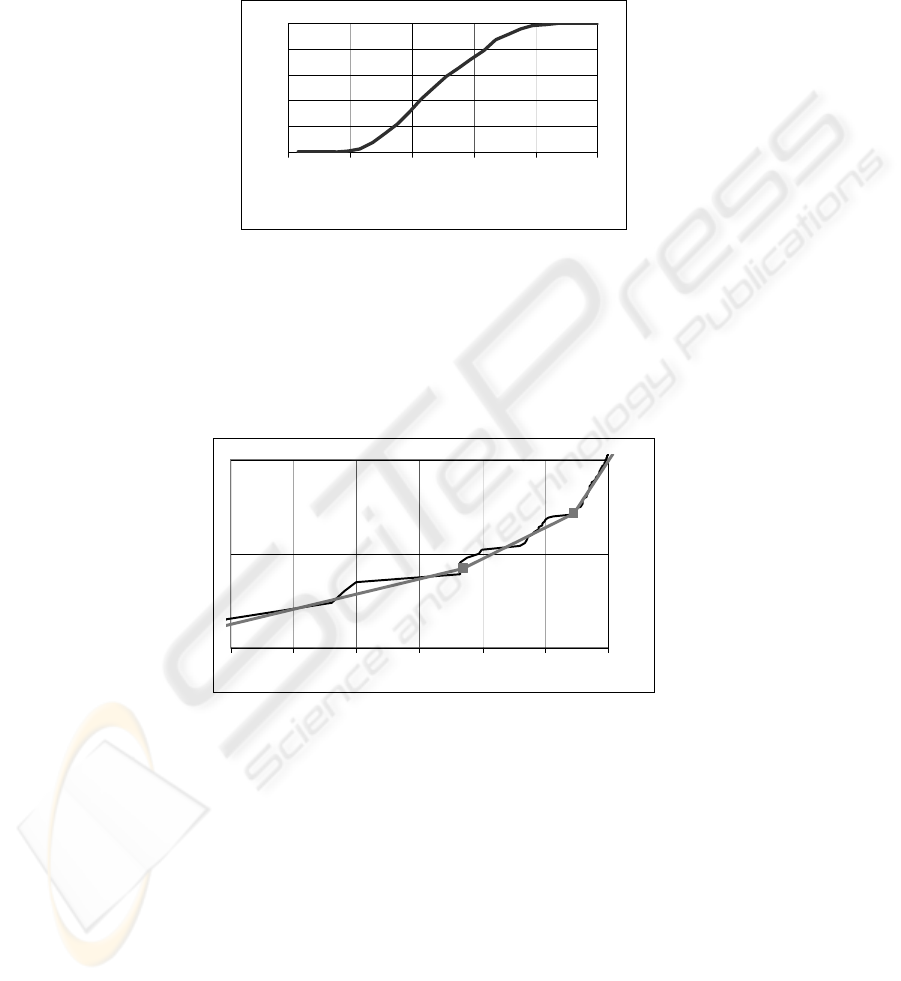
Cumulative distribution of session durations is shown on Fig. 3.
0
0.2
0.4
0.6
0.8
1
0.01 0.1 1 10 100 1000
[min]
Fig. 3. Cumulative distribution of session duration is shown in minutes (logarithmic scale).
Average duration is 11 minutes and as seen form figure, with probability 0.9 it is
not more than 30 minutes.
In case of strict deadlines, students become active just before deadline. Uploading
time is shown in Fig. 4 (course Operating Systems, homework). This curve has the
same form over years.
1
10
100
-6 -5 -4 -3 -2 -1 0
Fig. 4. Submission rate (homework reports). The number of reports submitted before deadline
can be approximated by piecewise linear function in semi logarithmic scale (Kukk curve)..
Time is in hours.
The days before deadline are shown on x-axis and number of uploads on y-axis.
Approximation shown on the figure is the following:
1
st
segment: 3dB/day (to 55h before deadline)
2
nd
segment: 6.7dB/day (to 12h before deadline)
3
rd
segment: 20dB/day (last 12 hours).
About 3% were late by several minutes.
114

This is probably a general law. To avoid catastrophic results, one has to make
deadlines fuzzy - not to use sharp closing but introduce increasing penalties after
deadline.
This problem is more general. Every action has initially some time limits. Always
some part of students does not fit it. Opening actions again is good practice but this
cannot be absolutely free - that would nullify the effect of deadlines. Some kind of
penalties has been used in all actions but the use of them it is a difficult task and needs
more analysis.
4 Surveys
Students have been asked after they had completed the course. We shall summarize
some of the results.
4.1 Internet vs paper (fall 2003)
• To submit any kind of reports (internet/paper) 58 / 2 %
• Learning materials (internet/paper) 78 / 22 %
• Exercising (internet/paper/textbook) 78 / 14 / 8 %
• Preparing lab (internet / paper) 82 / 18%
• Listen to audio comments ( for sure / sometimes / never) 47 / 36 / 17 %
• Virtual environment to prepare labs (sure / sometimes / never) 29 / 53 / 18 %
4.2 Evaluations by student
Material acquired (more than 50% / 70% / 90%) 85 / 67 / 25 %
Part that will be useful in my life (more than 50% / 70% 100%) 69 / 40 / 5 %
My mark is (right / high / low) 80 / 9 / 11
My mark is fair (yes / no) 91 / 9 %
If possible I would use mobile information exchange 33%
4.3 Trends (3 year period)
The values that have clear trend are the following.
• I am using my own computer 53
→
63
→
77 %
• I want to have more quizzes 43
→
68
→
74 %
• To clarify a problem I prefer to ask teacher 61
→
51
→
34 %
• To clarify something I prefer to solve tasks in internet 11
→
17
→
24 %
• To clarify some problem I prefer to ask other students 11
→
17
→
26 %
The reasons cannot be detected from those surveys. One possible assumption is that
e-materials and tools have become better and students are becoming more independent
115

upon the teachers. Does it mean that that students will use forums is not clear; still
they are not interested in that tool.
5 Conclusions
We formulate some conclusions that are rather hypotheses as they need more experi-
ments and analysis. However, this is the author's viewpoint in April 2004.
• Students accept internet-based learning with enthusiasm.
• Students are very different; e-tools may help and must make learning
much more individual (using individual tracks).
• E-learning tools make learning more effective (more students pass the
course).
• E-learning should be melt into learning-teaching process; it should not be
considered as some separate mode (like e-course vs. traditional or only
distant-learning tool).
• The role of lectures will change. Probably the number of lectures should
decrease 2-4 times. At the same time cost and quality should increase by
the same factor - a lecture should be a very good performance act (thea-
ter). Less lecture hours means that they may be accessible for much larger
audience. Personal contacts may be increased by proper organization of
practical exercises.
• E-learning may appear to be too expensive for special courses involving
small number of students. Too keep costs low, international cooperation
seems to be unavoidable.
• E-tools help to make learning very flexible; however, it needs complicated
control that is efficient only if it is integral part of institution's information
system.
• Labs are of increasing importance. To gain more time and space, part of
labs should be moved to homes.
• No-shows and late submissions seem to have the same level ~3% inde-
pendently upon the type of actions.
If a course is converted into e-mode, there is no way back.
116
