
AN INTERFACE ENVIRONMENT FOR LEARNING OBJECT
SEARCH AND PRE-VISUALISATION
Laura Sánchez García, Rodrigo Octávio de Oliveira Mello
Universidade Federal do Paraná, UFPR University, Av. Francisco H. dos Santos, Curitiba, Brazil
Alexandre Ibrahim Direne, Marcos Sfair Sunye
Universidade Federal do Paraná, UFPR University, Av. Francisco H. dos Santos, Curitiba, Brazil
Keywords: Learning objects, LOR, LCMS, search, pre-visualization, HCI, semiotic engineering.
Abstract: Learning Objects – LOs – were devised in order to cut down on production costs and time, as well as to
facilitate the distribution and reuse of didactic contents by means of a series of functions, such as
reutilization, traceability, interoperability, durability and easy editing. Our main objective in the present
paper is to propose an interface environment for LO search and pre-visualization. The distinctive feature of
such environment is both the easy access to all search refinement functions available, thus allowing users to
fulfil their search objectives without requiring much cognitive effort, and the well-structured LO pre-
visualization. We started the project by defining a set of criteria to assess LO research and solutions, and
one of such works was used as our starting point for the interface environment. Our theoretical foundation
relies on HCI (Human-Computer Interaction), and the major outcome of the present project is a
nonfunctional prototype (in storyboard) of the interface environment proposed, which in turn solves the
majority of the problems we came across when revising the pertinent literature.
1 INTRODUCTION
The concept of LO (Learning Object) was devised in
order to grant digital didactic units the following
properties: reutilization, traceability,
interoperability, durability and easy editing.
Our main objective in the present paper is to
propose an interface environment for LO search and
visualisation whose main purpose is (i) to allow
users to take advantage of the entire search
refinement potential available with the minimum
cognitive effort, and (ii) to provide strong support in
object pre-visualisation.
The scope of the present work does not
comprehend an operational prototype, the definition
of working directives or the necessary architecture
of the search engine of the search interface
environment proposed. Traceability is reached
through two basic factors, i.e. a comprehensive
metadata standard and a search tool equally
comprehensive.
Great effort has been put into defining a
metadata index pattern. Nevertheless, studies on LO
visualisation and localisation simply complement
studies on metadata indexing, or rely on empirical
research.
2 METHODOLOGY
The first methodological step we took consisted of a
revision of the relevant HCI (Human-Computer
Interaction) literature, as well as literature
concerning the production of digital didactic content,
ontologies and teaching processes.
Once the literature had been revised, we carried
out an in-depth analysis of works both on LO
searching and pre-visualisation and on other
interface solutions that might contribute to the
development of the environment we propose. We
used works concerning search tools in various
multimedia collections, search interfaces by direct
manipulation, by result filtering, among others.
Based upon this analysis we devised a set of
assessment criteria as the first step towards the
solution of the problem proposed. Each of the
240
Sánchez García L., Octávio de Oliveira Mello R., Ibrahim Direne A. and Sfair Sunye M. (2008).
AN INTERFACE ENVIRONMENT FOR LEARNING OBJECT SEARCH AND PRE-VISUALISATION.
In Proceedings of the Tenth International Conference on Enterprise Information Systems - HCI, pages 240-247
DOI: 10.5220/0001701702400247
Copyright
c
SciTePress
solutions we studied was confronted with this set of
criteria so as to determine which one would be the
most appropriate and effective to work as the
foundation for our solution.
Once all solutions had been analysed – taken
in association with the literature and in the light of
current HCI premises – we came up with a new
solution for LO search and pre-visualisation.
Finally, we also devised Corel Draw® 12 and
Adobe Photoshop® CS static images simulating
different uses of the environment (storyboards) in
order to complement the description of the solution
proposed.
3 CONTEXT
Digital contents are one of the outcomes of
technological evolution, particularly of the Internet.
At first there were Content Management Systems
(CMSs), and then as Instructional Design evolved
and as the concept of learning object was introduced,
the very first systems oriented towards the
development and management of digital didactic
objects came out, as well as other systems oriented
towards learning management.
The main purpose of LOs is to contribute to
didactic content access and sharing. LO
conceptualisation has caused heated debate in the
scientific community, and it has many different
definitions.
(WILEY), with his pragmatic approach, defines
LOs in a pragmatic way as “any digital resource that
may be reused in order to support learning”.
An LO repository (LOR) is a collection of
learning objects (or of metadata describing leaning
objects) managed through a technology which in
turn allows users to request, find, post and submit
these objects to the network (JONES). Normally one
LOR is part of a Learning Content Management
System (LCMS).
One LCMS is a system that supports generating,
assembling, storing and posting tailor-made didactic
contents. Its main purpose is to cut down on
development time through its special tools, and to
make LO reuse easier. An LCMS allows students to
get the required content only, in a tailor-made way
and in the appropriate amount and time.
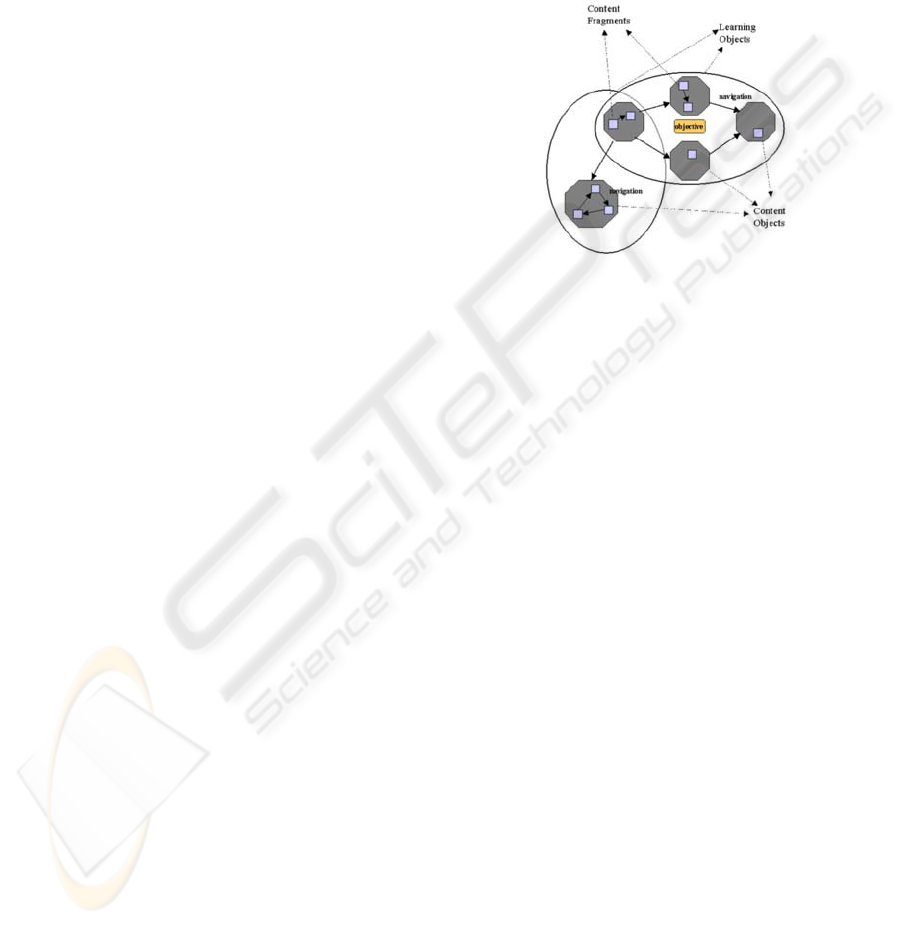
ALOCoM (Verbert et al 2004), i.e. Abstract
Learning Object Content Model, is an ontology that
defines LO through its components. The ontology
sorts out such components in three categories, as
follows: Content Fragments (CF), Content Objects
(CO) and Learning Object (LO). CFs are basic
elements, such as videos, sounds, texts, among
others, which in turn cannot be subdivided. COs are
the combination of two or more CFs, also including
a navigation path. It is the navigation elements that
are responsible for structuring CFs in COs. Unlike
CFs, COs may contain other COs in their structure
and thus may be of abstract constitution. Finally,
LOs add a didactic purpose to one or more COs.
Figure 1 portrays the ALOCoM model.
Figure 1: ALOCoM (Verbert et al 2004).
4 RELATED WORKS
So far, there have not been many efforts towards the
improvement of the quality of LO search and pre-
visualisation interfaces, which leads to rather
complex LOR and LCMS search interfaces. The
works presented in the following paragraphs have
contributed greatly to this debate, helping us to come
up with the solution presented here.
In this article (Klerkx et al 2004), they defend the
use of Information Visualisation techniques, which
basically refer to computer-supported visual
representations of abstract data that cut down on
users’ cognitive efforts (CARD et al 1999), aiming
at turning LO search into a more flexible, interactive
process.
The following article (Klerkx et al 2005)
complements the studies carried out in (Klerkx et al
2004) and brings forth a rather flexible environment
for interface development using Information
Visualisation techniques, particularly tree diagram
representation. Through this environment the
authors elaborated study cases with Ariadne LOR, as
well as with the EdMedia LOR (see Figure 2),
aiming at making LO search and localisation in base
repositories easier.
AN INTERFACE ENVIRONMENT FOR LEARNING OBJECT SEARCH AND PRE-VISUALISATION
241
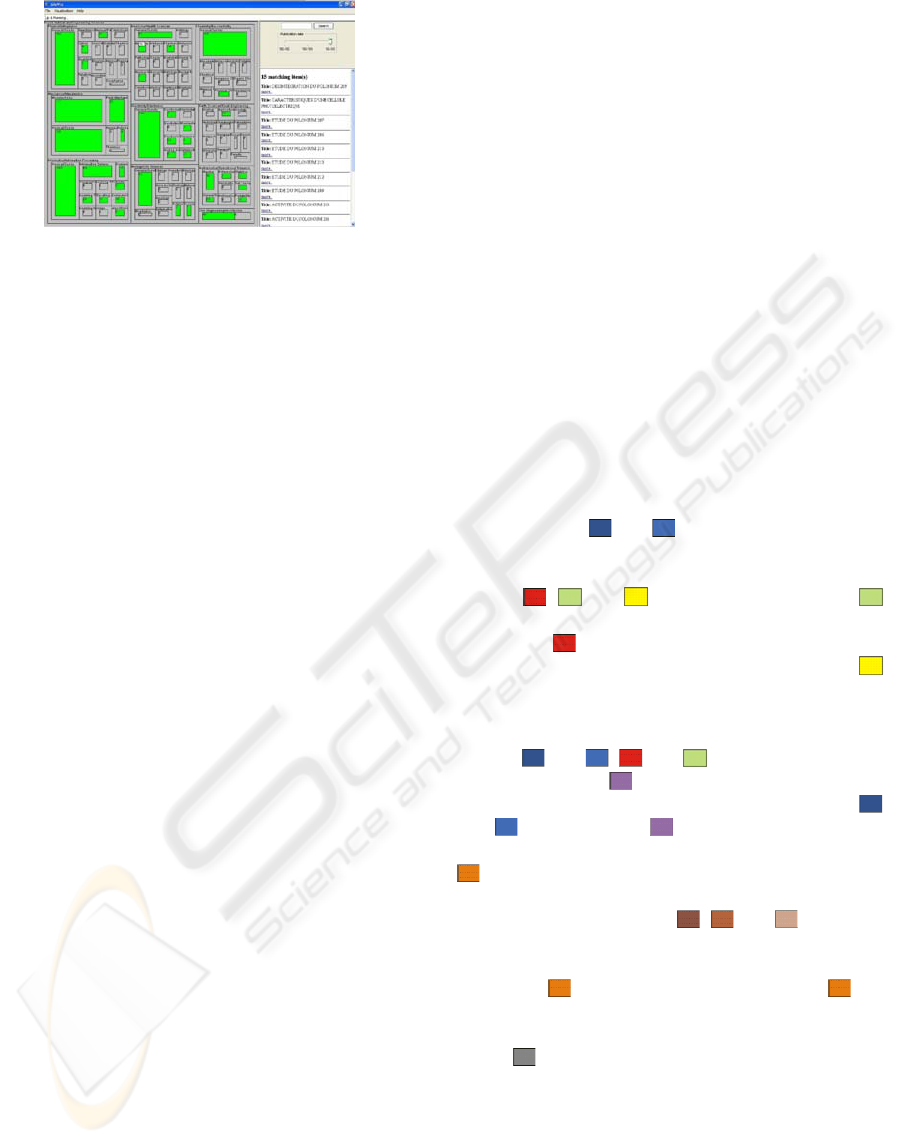
Figure 2: Prototype interface (Klerkx et al 2005).
The following article (Klerkx et al 2006)
complements the abovementioned studies. The
authors present an interactive application for the
visualisation of large repositories with small LO
components (COs and CFs), which in turn were
obtained by means of the disaggregation of full
didactic contents. The study case they present refers
to the ALOCoM repository, taking this very same
ontology as its basis.
The main objective of the (Najjar 2005) research
was to improve the usability of the Ariadne LOR
search tool. Its authors came to the following
conclusions: a) Simple and efficient search functions
are essential for improving users’ motivation and
trust; b) Information organisation and structure must
be oriented towards users’ needs; c) Terminology
must be accessible for users; d) Help tools must be
improved so as to increase users’ participation; e)
The more refined search tools are, the better their
performance.
In (Yee et al 2003), the authors bring forth a
complete and creative solution for searching within
an image collection. Their approach allows users to
navigate through the conceptual dimensions that
describe an image making use of hierarchic metadata
and generating search samples dynamically. This
way, not only does the interface provide successive
search through clicks, avoiding thus complex syntax
search, but it also allows users to get to know the
structure of the image repository.
The (Wiza et al 2004) article presents a system
for 3D-visualisation of Internet search results
entitled Periscope. Three different interface
visualisation levels are possible, as follows:
synthetic interface, for displaying aggregate data;
analytic interface, for displaying details of
documents found; and hybrid interface, for
displaying both aggregate data and details of
documents.
5 OUR SOLUTION
After thoroughly analysing both the abovementioned
related works and the existing tools, we chose the
(Klerkx et al 2004) “tree diagram” as our starting
point for devising an integrated solution for the
problem of LO search and pre-visualisation.
Therefore, our solution follows the tree diagram
principle; nevertheless, its main distinctive feature is
the possibility of LO disaggregation into COs and
CFs based upon the ALOCoM ontology (Verbert et
al 2004). Other differences inherent to our solution
shall be presented below.
5.1 Interface Environment: Visual
Resources
Before describing the actual interface environment,
we would like to present some visual resources of
which we make use.
Colours: Colours play an essential role for our
solution’s communication coherence.
The colours
and are used in LO search or
classification. When the two blue symbols might
merge, the two shades of blue are juxtaposed. The
colours
, and stand for the LO rights.
refers to LOs whose use and visualisation are
unlimited;
stands for those whose use and
visualisation are limited (such as paid LOs); and
refers to those whose visualisation is unlimited, but
whose use is limited – such those under copyleft
(GNU) or creative commons (CC). The choice of the
colours
and , and follows (Klerkx et al
2004). The colour refers to LO listing, and since
its message is rather close to that of the colours
and
, we opted for because it is the colour
right next to blue in the light spectrum. The colour
stands for LO disaggregation, and we chose it
because it is a warm colour that contrasts with the
other colours. The colours
, and stand for
LOs, COs and CFs, respectively. We opted for these
colours because their message is close to the one of
the colour
; indeed, they are variants of for
their superior and inferior luminosity, representing
thus different completeness levels. Finally, the
colour
stands for unavailable symbols.
Icons: As we show in Figure 3, the interface
icons may be classified as action (ação) and
identification (identificação) icons.
ICEIS 2008 - International Conference on Enterprise Information Systems
242
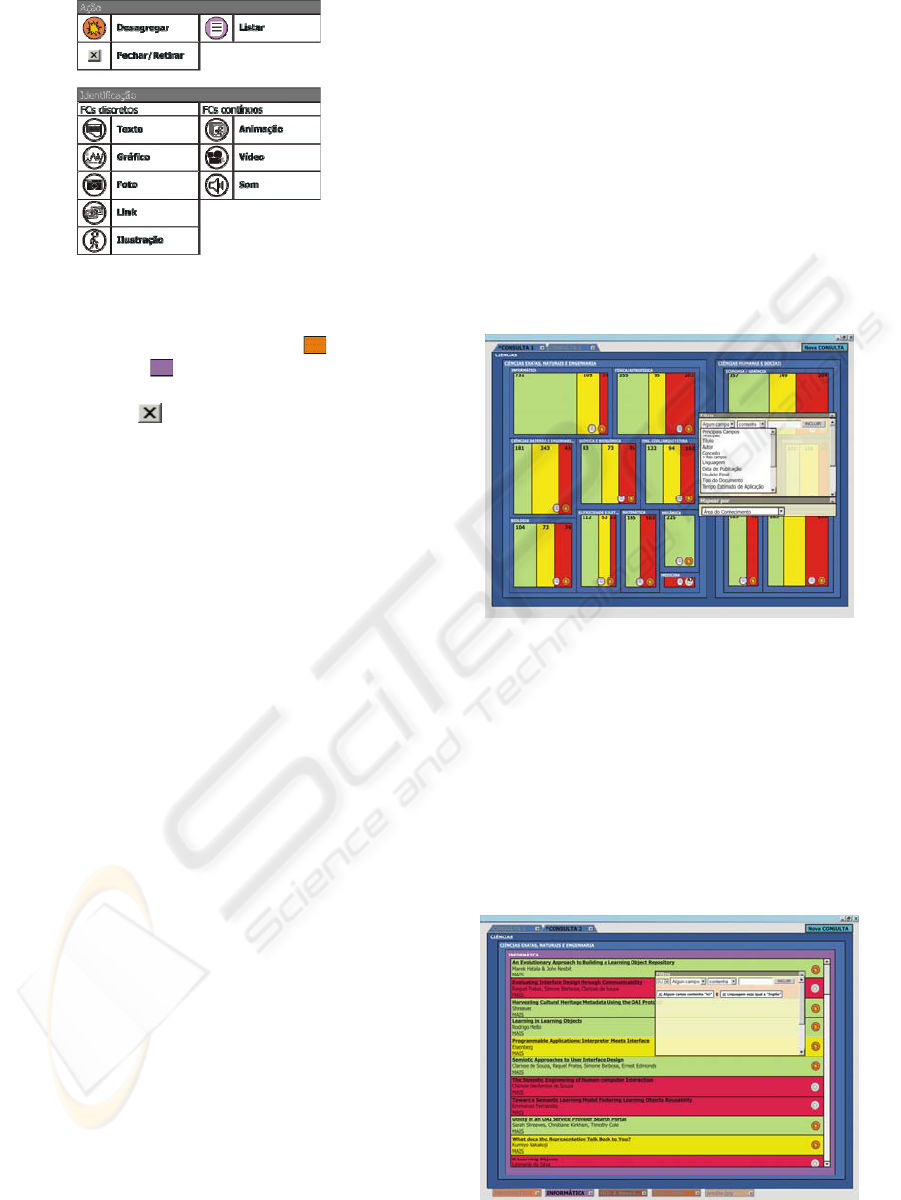
Figure 3: Interface icons.
The action icons are colourful, and their colours
refer to the action they perform. Since stands for
disaggregation and
stands for listing, the icons
conform to the same pattern. The action icon
“Close/Remove” (
) conforms to the operational
system of the interface users.
The identification icons are not colourful and are
used in the disaggregation interface for making CF
identification easier. Each CF type has a different
iconic representation. Such icons may be displayed
alone or together with another icon that represents a
CF pre-visualisation in a smaller scale, in the case of
images, or a frame, in the case of videos. The
division between discrete and continuous CFs
respects the classification presented by (Verbert et al
2004). The icons for discrete CFs stand for static
objects, such as a text or a graph, among others. The
continuous ones stand for moving objects.
5.2 User Help
The main purpose of user help is to provide strategic
information so that the entire potential of the
environment can be explored. This sort of help is
particularly relevant for intellectual tools such as this
one. Such help consists of two complementary parts,
which provide insights on the application from two
different points of view.
Structural help, “What’s the potential of the
environment?”, describes the use of the application
from the point of view of the benefits it brings to the
actual activity of didactic content elaboration and
manipulation. Procedural help, “How...?”,
describes the procedure for achieving the objectives
of real life activity through the functionality
provided by the application.
5.3 Initial Search Interface
The initial interface display is a preview of the full
repository and follows the work of (Klerkx et al
2004), as shown in Figure 4. The blue portions stand
for LO areas and subareas of knowledge, whereas
the green, red and yellow portions stand for the
respective LO right limitation level. The numbers at
the top of the screen are the actual number of LOs
included in each one of them. The area taken up by
these portions is actually proportional to the number
of objects it comprises. By “clicking” one of the
blue, green, yellow or red portions, users are taken
to one level “above” or “below” the current level.
The initial display also includes a window for
information filter selection, as well as one for the
selection of the field which will be used as basis for
interface result mapping/display.
Figure 4: Initial interface display.
5.4 Viewing LOs in List
Listing was always an available option in (Klerkx et
al 2004). According to both (Klerkx et al 2004) and
(Yee et al 2003), list search is far more time
consuming than visual search. This is why in our
solution we include listing as an optional feature
which should be the last search option users resort to
(Yee et al 2003), and the lists should always have a
minimal number of options (Klerkx et al 2004).
Figure 5: LO listing within searched elements.
AN INTERFACE ENVIRONMENT FOR LEARNING OBJECT SEARCH AND PRE-VISUALISATION
243

If there are no other classifications, or if users
click
(see Figure 4), a list within the
quadrangular area is displayed (see Figure 5). In
(Klerkx et al 2004), the rectangular areas containing
a large number of LOs can get illegible. Therefore,
we opted for including the scrolling function in our
solution so as to avoid this problem. When
displaying LO listings, the frame of the rectangular
area is coloured
to represent the list.
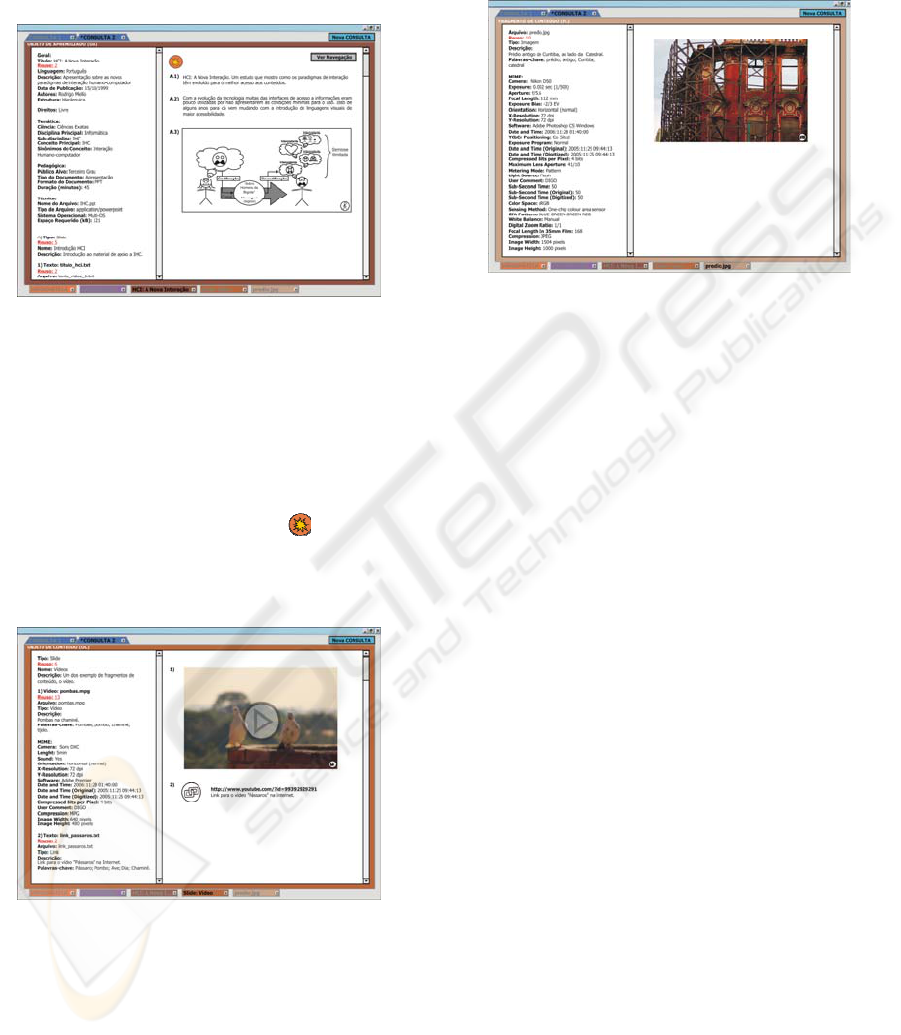
5.5 Filter
When a form comprises many filtering fields it may
become voluminous and take up unnecessary
interface space. One solution for this problem is a
filter with a few entry possibilities, making it
possible to narrow or broaden the search. The filter
tool consists of three or four fields to be filled out, as
follows: search field, operation field, value field and
the Boolean operators AND and OR. By using the
filter one can establish conditions that, when applied
to the search, lead to immediate results.
Figure 6: Filter tool.
As shown in Figure 6-1, the first selection box is
responsible for indicating the field in which the
filtering shall take place. We have derived the first
few options from (Najjar 2005), and they correspond
to the most frequently used metadata (title – “titulo”
–, author – “autor” – and concept – “conceito”).
These options are entitled “Main” (“Principais”),
whereas the advanced search fields (language –
“linguagem” –, publication date – “data de
publicação” –, among others) are entitled “More
fields” (“Mais campos”).
The next step is then to select the operation
(“operação”) (“containing” – “contenha” –, or
ending in – “termine com” –, “the same as” – “seja
igual a”) that shall be applied to the search (as
shown in Figure 6-2). We derived these operations
from the “PHP My Admin®” system
(PHPMYADMIN).
Once these two first options have been selected,
users must then fill out the third field, i.e. the
information they wish to be filtered. The value of
this entry is contextualised within the field of the
metadata to be filtered and can be of limited entry or
textual. Figure 6-3 brings an example where the
entry is textual (field filled out with the “HCI” value
– “IHC” –, field “Title” – “Título”), while Figures 6-
4 and 6-5 bring examples where the entry is limited
through selection boxes (the fields “Language” -
“Linguagem” – and “Publication Date” - “Data de
Publicação” -, filled out with “Portuguese” –
“Português” – and “15/08/2007”, respectively).
Once these three first fields have been filled out
and users have clicked the INCLUDE (“Incluir”)
button, the first clause is then inserted in the filter,
and the search interface displays a new field, i.e.
AND/OR (“E/OU”), as shown in Figure 6-3.
Finally, this AND/OR field must be filled out.
By choosing the option “OR”, a new line with the
chosen clause is added to the filter preceded by a
line containing the word “OR” – “OU” – (see Figure
6-6). If the chosen option is “AND” – “E” –, this
clause is added right next to the last clause of the
filter, preceded by the word “AND” – “E” – (see
Figure 6-4).
This structure here described reproduces the
sentence building process of a natural language
(Portuguese), from right to left, originating
alternatives in columns. One such model allows for
clauses to be removed from the search filter. In order
to do so, users must “click”
right before the
clause in question. Once a clause is removed, it is
taken away from the filter interface and the search
interface is then affected by the remaining filter. We
derived these options of clause addition and removal
from (Yee et al 2003).
5.6 LO, CO and CF Search
We derived the idea of visualising disaggregated
LOs from (Klerkx et al 2006), whereas the concepts
concerning disaggregated LOs used in the present
solution come from the ALOCoM ontology (Verbert
et al 2004).
The icon
(present in Figures 4 and 5) stands
for the disaggregation of LOs. We have chosen the
explosion icon to represent this exploded view, a
metaphor we propose for the disaggregation. During
disaggregation, a new secondary tab coloured orange
is displayed and labelled either with the name of the
level or with the name of the LO in question.
ICEIS 2008 - International Conference on Enterprise Information Systems
244

When visualising disaggregated LOs there is a
filtering tool analogous to the one presented for LO
search – only now with metadata information on
COs and CFs.
Results may be grouped by LO, CO or CF. Each
result grouping has its own specific display, as we
shall describe in the following sections.
5.6.1 Disaggregated LOs grouped by LO
Figure 7: Disaggregated LO grouped by LO.
In the interface where disaggregated LOs are
grouped by LO are displayed the main metadata on
the LOs and COs it comprises. COs are displayed as
CF groupings ordered by inherent navigation and
distributed through broken lines which in turn
represent the boundaries of the CFs. CO ordering is
also done by navigation in their respective LOs. One
example of this is shown in Figure 7.
5.6.2 Disaggregated LOs grouped by CO
Figure 8: CO list grouped by type.
In CO grouping, on the other hand, there are only
COs and lists of CO types (see figure 8). Results are
grouped according to these types (Verbert et al
2004), which display, additionally, the number of
results in each of the groupings. CO display follows
the pattern shown in Figure 7, but it also has the
additional assistance of the filter component “Show”
(“Mostrar”), through which one can select only two
CO types so as to make CO localisation easier
within the repository.
5.6.3 Disaggregated LOs grouped by CF
Finally, in CF grouping (see Figure 9), besides the
listing of CF types and the number of elements
comprised by each of these sets, the pre-
visualisation of these fragments – together with their
titles and key words – is displayed as well.
Figure 9: Disaggregated LO grouped by CF.
The interface takes advantage of the
communicative potential of such fragments so as to
make the search process easier on users. For
instance, a picture is displayed by means of a
smaller-scale version of the original including an
informative icon explaining that that image is
actually a picture (rather than a video, for example).
At this point, neither the metadata nor the structure
of both LOs and COs are displayed. Similarly to CO
grouping, only the CF types chosen by users are
displayed.
5.7 LO, CO e CF Pre-visualisation
In the solution we propose, one can visualise both
LOs or COs and CFs the moment one interacts with
the icons and links displayed on the disaggregation
screen or on the LO listing screen. The screens
corresponding to LO, CO or CF pre-visualisation are
divided into two frames. The one on the left-hand
side comprises the metadata of the visualised
element (LO, CO or CF). Together with the
metadata is the information concerning element
reuse, indicating how many times it has been used in
the repository. By “clicking” this information, a list
AN INTERFACE ENVIRONMENT FOR LEARNING OBJECT SEARCH AND PRE-VISUALISATION
245
of the LOs that use this element is displayed. In the
right-hand frame is the pre-visualisation of the
element selected.
5.7.1 LO Pre-visualisation
Figure 10: Overview of LO content and metadata.
The LO pre-visualisation screens (see Figure 10)
become accessible when users “click” the title of an
LO (Figure 7), for instance. To the left are the LO
metadata and the number of times it has been used.
To the right is the full LO, containing all its
components (COs, CFs) ordered by the navigation
defined for such elements. Users may also
disaggregate this LO by clicking the
icon, which
will then lead them to a new tab.
5.7.2 CO Pre- visualisation
Figure 11: Overview of a CO and its metadata.
CO visualisation (see Figure 11) becomes available
when users “click” the rectangular area that delimits
the CO representation area (except for the area of the
icons representing CFs) in the screens shown in
Figures 7 and 9. In the left-hand area are the CO
metadata and their reuse. In the right-hand area are
the metadata on each of the CFs that make up the
CO. There is also where the pre-visualisation of the
CFs that make up the CO takes place.
5.7.3 CF Pre- visualisation
Figure 12: Overview of a CF and its metadata.
Similarly to the other cases, on the left-hand side are
the metadata indexing the fragment, whereas on the
right-hand side is the pre-visualisation of the
fragment. Users may access such CF pre-
visualisation by “clicking” one of the icons that
represent CFs (see Figures 7 and 9). If the fragment
is an image, graph or photo, the fragment is
displayed together with an icon representing the type
of fragment in question. If it is a text or link, the
very content of the text or link is displayed. If it is an
animation, video, sound or song, the interface
displays the necessary commands to reproduce or
execute them.
5.8 Pre-assessment
Due to the non-operational nature of the tool we
proposed, and aiming at testing this same tool by
getting potential users to work with it, we elaborated
an experiment based on the following basis.
As a first task, we will ask students to read the
technical description of the environment proposed.
After that, we will ask them to carry out two tasks
by using the technical description they will have just
read.
The first of such tasks involve the entire
potentiality of the tool, but specified in such way as
to have the students carry out the search steps in a
different order from the one presented in the
technical description of the application.
The second task required great skill and
comprehensive knowledge of the main potentiality
of the tool. We intend to ask students to searching
for all materials available on a certain topic as if
there were going to prepare a new course on that
ICEIS 2008 - International Conference on Enterprise Information Systems
246

topic. Nevertheless, we did not specify the necessary
steps, making it a rather generic, free activity.
Both tasks involve hypothetical data, different
from those used in the examples presented in the
technical description of the application.
We will also ask the participants to take note of
all and every difficulty they come across while
carrying out the tasks, as well as of the sequence of
operations performed and the expected solutions
within the application.
When analysing the results, we will take into
consideration whether both tasks have been
successfully fulfilled or not. For the second, generic
task, we will also take into consideration the use of
the entire potentiality of the tool.
We will now apply this experiment to a sample
of 7 Masters Students (potential users of this kind of
application) as a test to be applied to a larger
universe in a near future. Our hypothesis are that the
tool is self-explanatory when it comes to the
accomplishment of each individual task. However,
its potentiality may be underexploited, because of
the lack of strategic help, which in turn should
describe - in a more precise way - the distinctive
aspects of the environment when used in the real
world, i.e. in the search for materials oriented
towards the elaboration of didactic content.
6 CONCLUSIONS AND FUTURE
WORKS
In the present work we listed and looked into a
number of solutions available for building a proposal
of an environment (on storyboard) based upon
current HCI premises and concepts. The results we
achieved solve most of the problems we came across
whilst revising the literature on this sort of
environment. The main advances and achievements
of the environment we propose are the following:
the pre-visualisation of the semantic structure of the
content by taking advantage of the communicative
potential of LO content and its components; the
possibility of synthetic visualisation (at LO level)
and analytical visualisation (at CO and CF levels) of
search results; and the visualisation of results
according to different attributes/mappings.
When giving continuity to the present work, we
will applied an experiment to a sample of 7 Masters
Students as a first test. Our hypothesis are that the
tool is self-explanatory when it comes to the
accomplishment of each individual task. However,
its potentiality may be underexploited, because of
the lack of strategic help.
After the concept of the environment an the
experiment, the next step is to apply the
improvements needed to the conceptual environment
and apply again the pre-assessment to a larger
universe of potential users.
Other pertinent future works may approach the
incorporation of new search capacities to the
information filtering tool (Cardoso 2000); the
improvement of result ordering, such as through the
ranking of the results displayed (Ochoa et al 2006);
the help during the process of cooperative search
among repository users, including cooperative and
dynamic indexing as well as the possibility of taking
notes about the use of reused objects as inputs to the
new decisions and their possible reutilisation; among
others.
REFERENCES
Card, S., Mackinlay, J. D., Shneiderman, B., 1999.
Readings in Information Visualization, using vision to
think, Morgan Kaufmann Publishers, Inc.
Cardoso, J.C., 2000. iLIB, Uma Proposta de Interface de
Consulta Personalizável Para Bibliotecas Digitais.
Klerkx, Joris et al, 2004. Using Information Visualization
for Accessing Learning Object Repositories, Computer
Science Department, K. U. Leuven.
Klerkx, Joris et al, 2005. An Information Visualization
Framework for Accessing Learning Objects
Repositories, Dept. Computerwetenschappen,
Katholieke Universiteit Leuven.
Klerkx, Joris et al. Visualizing Reuse: More than Meets
the Eye, 2006. Katholieke Universiteit Leuven,
Belgium.
Najjar, Jehad et al, 2005. Finding Appropriate Learning
Objects: An Empirical Evaluation, Computer Science
Department, K. U. Leuven.
Ochoa, Xavier et al., 2006. Use of Contextualized
Attention Metadata for Ranking and Recommending
Learning Objects, ACM.
Verbert, K et al., 2004. Toward a Global Architecture for
Learning Objects: A Comparative Analysis of
Learning Object Content Models.
Wiza, Wojciech et al., 2004. Periscope – A System dor
Adaptative 3D Visualization of Search Results, ACM.
Yee, Ka-Ping; Swearingen, Kirsten; Li, Kevin; Hearst,
Marti, 2003. Faceted Metadata for Image Search and
Browsing.
CC, Creative Commons. http://creativecommons.org/
GNU, Copyleft. http://www.gnu.org/copyleft/
PHPMYADMIN. http://www.phpmyadmin.org/
AN INTERFACE ENVIRONMENT FOR LEARNING OBJECT SEARCH AND PRE-VISUALISATION
247
