
AN EFFICIENT AND ROBUST TECHNIQUE OF T WAVE
DELINEATION IN ELECTROCARDIOGRAM
Yogendra Narain Singh
Department of Computer Science & Engineering, Institute of Engineering & Technology, Lucknow, India
P. Gupta
Department of Computer Science & Engineering, Indian Institute of Technology Kanpur, Kanpur, India
Keywords:
ECG analysis, T wave delineation, QRS complex.
Abstract:
This study presented an efficient and robust method for the automatic delineation of T wave in the single-lead
electrocardiogram. The method attained optimum performance using the fusion of delineation results obtained
from a pair of new approaches. The first approach utilizes the advantage of time derivative and determines T
wave ends using derivative curve analysis. The effect of local noise on the ECG signal is seized using a non-
derivative approach which performs T wave delineation using the analysis of its waveform curvature toward
the ends. Using the assumption that beginning and end of T wave exhibit the convex shape, this approach
determines minimum radius of curvature of the convex regions at both ends. It is formally shown that the time
instance corresponding to minimum radius of curvature coincides with T wave ends. The delineation results
obtained from both the approaches are fused to achieve the optimum performance. The delineator attained a
detection sensitivity of 99.9%, positive predictivity of 99.1% and an accuracy of 99.01% over the first lead
of physionet QT database (20 records of 1, 000 beats each). The delineation errors are found well within the
referenced intercardiologist observations, especially for T wave end. The mean error and standard deviation
are found smaller than 10 ms which outperformed in comparison to other published results.
1 INTRODUCTION
The Electrocardiogram (ECG) is the record of time-
varying bio-electric potential generated by the electri-
cal activity of the heart. ECG provides an easiest way
to monitor the functional activity of the heart without
using of an invasive method. It is a prima tool used
by the cardiologists in diagnosis of cardiac arrhyth-
mia. In the automatic analysis of ECG, locating the
beginning (onset) and end (offset)fiducials of its char-
acteristic waveforms, the most difficult one among
these measurements is the delineation of T wave. T
wave is the representation of repolarization of ven-
tricles whereby the myocardium is prepared for the
next cycle of ECG. In the automatic delineation of T
wave, the detection of its offset fiducial is more cum-
bersome due to rapid change of the signal near to its
end. Furthermore, the end of T wave also concerns
the irregularity causing in the electrical activity of the
heart. The patterns of cardiac impulses responsible
for T wave generation has been identified using the
different methods available in the literature.
The information of time derivative has been uti-
lized for the automatic detection of T wave end fidu-
cials in the multilead ECG signals (Laguna et al.,
1994). A similar method based on wavelet trans-
form has taken the advantage of numerical differen-
tiation and its robustness to the waveform variations
(Li et al., 1995). The disadvantage of this method is
its sensitivity towards the noise. In order to limit the
noise-sensitivity, smoothing filters are used. Among
the other methods of T wave delineation, one of them
has consisted to the computation of an indicator re-
lated to the area covered by T wave curve (Zhang
et al., 2005). It is constituted with its consistency
proof based on assumptions, essentially on the con-
cavity of T wave. The offset fiducial is detected on
the basis of the fact that maximum of the computed
indicator inside each cardiac cycle coincides with T
wave end.
Mathematical models of ECG have also been ap-
plied to waveform detection. Morphological model of
146
Narain Singh Y. and Gupta P. (2009).
AN EFFICIENT AND ROBUST TECHNIQUE OF T WAVE DELINEATION IN ELECTROCARDIOGRAM.
In Proceedings of the International Conference on Bio-inspired Systems and Signal Processing, pages 146-154
DOI: 10.5220/0001548401460154
Copyright
c
SciTePress

one P-QRS-T complex is formulated using a set of or-
dinary differential equations. It is fitted to ECG signal
segments by tuning the model parameters, and then
used to locate the waveform boundaries (McSharry
et al., 2005). These methods are in principal noise-
insensitive and easily adapted to the change in ECG
morphology, but they are highly computationally ex-
pensive and also suffered to parameter overheads.
While investigation of T wave delineation meth-
ods, it is found that each method has own strength(s)
and weakness(es). In this paper, a novel method of T
wave delineation is proposed. It is consisted of a pair
of new approaches that resulted an efficient and robust
way to delineate T wave in ECG. Both approaches are
used lowpass filter for ECG signal correction from
baseline oscillations. For an infallible detection of
T wave and its end fiducials, a search window is set
heuristically based on the length of a typical QT in-
terval. Adaptive thresholding technique is utilized to
detect the true presence of T wave in each heartbeat.
The determination of onset (T
onset
) and offset (T
of f set
)
fiducials of T wave is resulted using the approach of
(1) derivative curve analysis and (2) waveform cur-
vature analysis. The resulted fiducials obtained from
both the approaches are fused to delineate the final T
wave ends.
The reminder of this paper is organized as follows.
In Section 2 the schematic description of automated
T wave delineation is presented. A high level de-
scription of the method used for heartbeat detection is
also summarized in this section. A novel method of T
wave delineation, consisting a pair of new approaches
namely, derivative curve analysis and waveform cur-
vature analysis is given in Section 3. In order to eval-
uate the performance of the proposed method, the re-
sults of validation and its significance are presented
in Section 4. A comparison of results with other pub-
lished methods are also given in this section. Finally,
conclusions are drawn in Section 5.
2 SYSTEM DESCRIPTION
The automated delineation of T wave concerns ECG
signal analysis and diagnostic method. The correction
of the signal from non-signal artifacts including digi-
tization and sampling is the concern of signal analy-
sis. The schematic diagram of the automated T wave
delineation system is shown in Figure 1. The task of T
wave delineation carries out in following stages: The
preprocessing stage consists of signal acquisition and
heartbeat detection. The ECG data is acquired from
the individuals and subsequently it is digitized. The
digitized signal is passed to the heartbeat detection
Figure 1: Schematic description of automatic T wave delin-
eation.
module. The heartbeat detection module utilizes QRS
complex delineator algorithm which is implemented
using the method of Pan and Tompkins with some
improvements (Pan and Tompkins, 1985). The algo-
rithm can be divided into filtering and decision rules.
The aim of filtering of the signal is to generate a win-
dowed (or time limited) estimate of the energy in the
QRS frequency band. It is achieved by applying the
following tasks: (1) lowpass filter of cutoff frequency
16Hz and delay of nearly 20ms, (2) highpass filter of
cutoff frequency 8Hz and delay of nearly 60ms, (3)
derivative unit that extracts slope information of de-
lay nearly 5ms, (4) absolute value function that causes
QRS detector to be less gain-sensitive while Pan and
Tompkins have used squaring function that caused
nonlinear amplification, and (5) moving window in-
tegrator that captures QRS complexes in ECG. The
average size of moving window is set to 80ms wide
while in the original algorithm window has been set
to 150ms wide that allowed the wider QRS complexes
produced by the Premature Ventricular Contractions
(PVC) and the merging of QRS complexwith T wave.
After filtering, the signal is free from noise and noise
artifacts. The signal is then ready for the delineation
of QRS complexes. The decision rules are used that
make a distinction between QRS event and the noise
event. The rules are framed from the physiology of
the normal QRS complex in the ECG while the de-
tection of QRS peak are carried out using adaptive
thresholding technique.
In order to determine the windowed region for the
existence of a normal T wave, the end fiducial of QRS
complex (QRS
of f set
) is to be delineated. The fidu-
cial QRS
of f set
is delineated according to the location
and the convexity of R peak. The search region for
QRS
of f set
is set according to the width of QRS com-
plex relative to FP (R peak). Within the region, the
signal is traced in time-forward order and search the
sample where slope is lesser than quarter of minimum
slope. In order to insure that found QRS
of f set
position
is not an inflection some adjustment surrounding to
the detected position need to be performed.
The computed QRS
of f set
fiducial is then passed to
AN EFFICIENT AND ROBUST TECHNIQUE OF T WAVE DELINEATION IN ELECTROCARDIOGRAM
147

0
0
Amplitude (mV)
Time (ms)
FP
80ms
QRS
offset
+
80ms
QRS
offset
+
470ms
Figure 2: Setting of the search window for T wave delin-
eation.
the processing stage at T wave delineator. The delin-
eator uses this fiducial as a reference for the setting
of search window where the proposed delineation ap-
proaches are implemented.
3 T WAVE DELINEATION
The delineation is concerned to the detection of char-
acteristic waveform and its limits. The processing
steps utilize for T wave delineation includes lowpass
filtering, setting of a search window and the threshold
estimation. For the reliable delineation of T wave, os-
cillatory patterns of the isoelectric potential must be
minimized. It can be achieved by filtering of the ECG
signal through a second order recursive lowpass filter
(Lynn, 1977) of following time difference equation,
y
nT
= 2∗ y
(n−1)T
−y
(n−2)T
+x
n
−2∗x
(n−4)T
+x
(n−8)T
(1)
where x
n
represents the data sample of size n at dis-
crete instant of time T. At sampling frequency of 100
Hz, T is found to be 10 ms and processing delay
caused by the filter is nearly 30 ms.
Prior to start of the delineation process, a tem-
poral window (search window) is defined that deter-
mines a probable region of the existence of T wave in
each heartbeat. The boundaries of the search window
are set heuristically relative to QRS
of f set
fiducial as
shown in Figure 2. The search window that approx-
imately contains the T
onset
and T
of f set
fiducials is ex-
tended from QRS
of f set
+ 80ms to QRS
of f set
+ 470ms
positions in each heartbeat. It can also observed that
the segment of 80ms from QRS
of f set
fiducial is ex-
cluded from the search window because this is the
time prior to repolarization of ventricles that have the
negligible stimulation. Similarly, the right boundary
of the search window is set according to the duration
of depolarization to repolarization of the ventricles.
In order to discuss the main features of the pro-
posed T wave delineator the morphology of the wave-
form is considered as positive as shown in Figure 2.
The other morphologies of T wave can be treated sim-
ilarly.
3.1 T Wave Detection
The procedure for detection of T wave from each beat
of the ECG signal is as follows: First of all, peak
of the entitled signal which is the signal within the
search window is determined using the time deriva-
tive approach. Using adaptive thresholdingtechnique,
one can classify that detected peak is a true peak or a
non peak of T wave. The threshold is calculated us-
ing the estimates of peak heights and the level of high
frequency noise present in the beat. The threshold (ϑ)
is set between the mean of peak height (µ
peak
) and the
mean of high frequency noise (µ
HF
noise
) according to
the formula,
ϑ = C
ϑ
∗
µ
peak
− µ
HF
noise
(2)
where the threshold coefficient (C
ϑ
) lies between 0
and 1. This experiment is conducted on C
ϑ
= 0.23.
The mean of peak height is estimated from the height
of five recently detected peaks. The mean of high fre-
quency noise is estimated from the level of high fre-
quency noise (HF
noise
) present in the detected peak
using the following approach: The beat is firstly
passed to a highpass filter of following time differ-
ence equation,
y
nT
= x
nT
− 2∗ x
(n−1)T
+ x
(n−2)T
(3)
The level of artifact signals can be estimated by
taking the mean of y values of five consecutive sam-
ples. Then maximum of the means is computed for
the entire beat. Let it be denoted as HF
MA
noise
. Finally, a
noise metric is obtained using the ratio of HF
MA
noise
and
R wave peak height (h
R
peak
) according to the formula,
HF
noise
=
HF
MA
noise
∗
C
1
5
h
R
peak
C
2
(4)
where the parameters (C
1
, C
2
) can be determined and
set through the experiment. These values are set as
C
1
= 50 and C
2
= 4 during the experiment.
3.2 End Fiducials Detection
The beginning of T wave is concerned to the start
of ventricles repolarization which is raising (dropping
BIOSIGNALS 2009 - International Conference on Bio-inspired Systems and Signal Processing
148
for negative T wave) slowly while the end of T wave
is concerned to the end of repolarization cycle which
is terminating much faster. The changes resulted from
abnormal function of epicardium and/or endocardium
can also be seen in the latter part of T wave. Along to
that, it is also noticed that its end segment shows a rel-
atively lower stimulation in comparison to the level of
noise present in the beat. That makes the detection of
end fiducials of T wave, especially T
of f set
more cum-
bersome. Keeping the concern of these observations,
the end fiducials of T waves, T
onset
and T
of f set
are to
be determined efficiently and more robustly using the
following proposed approaches.
Both approaches utilize a linear derivative filter
which corrects ECG signal from isoelectric oscilla-
tions. The first approach takes the advantage of time
derivative to capture the signal variations. Further-
more, it determines T
onset
and T
of f set
fiducials through
derivative curve analysis which is obtained from the
filtered signal. The approach produces better delin-
eation results when the end positions of T wave are
relatively free from local noise. For the cases, when
the end positions of T wave are contaminated highly
with local noise then it yields less accurate results.
This is due to the sensitiveness of time derivative
to the local noise. The pitfall of the first approach
can be overcame in the non-derivative based second
approach. The implementation bases of second ap-
proach is the assumption that the curvature of T wave
near to its ends is convex. It extracts the T wave
end fiducials using the analysis of the curvature to-
ward both ends. The accuracy of the delineated re-
sults of this approach is highly depends on the as-
sumption that the end fiducials of T wave are found at
the sample corresponding to minimum radius of cur-
vature of its waveform at both ends. These results are
reported more robust to the local noise than most ob-
vious derivative measure.
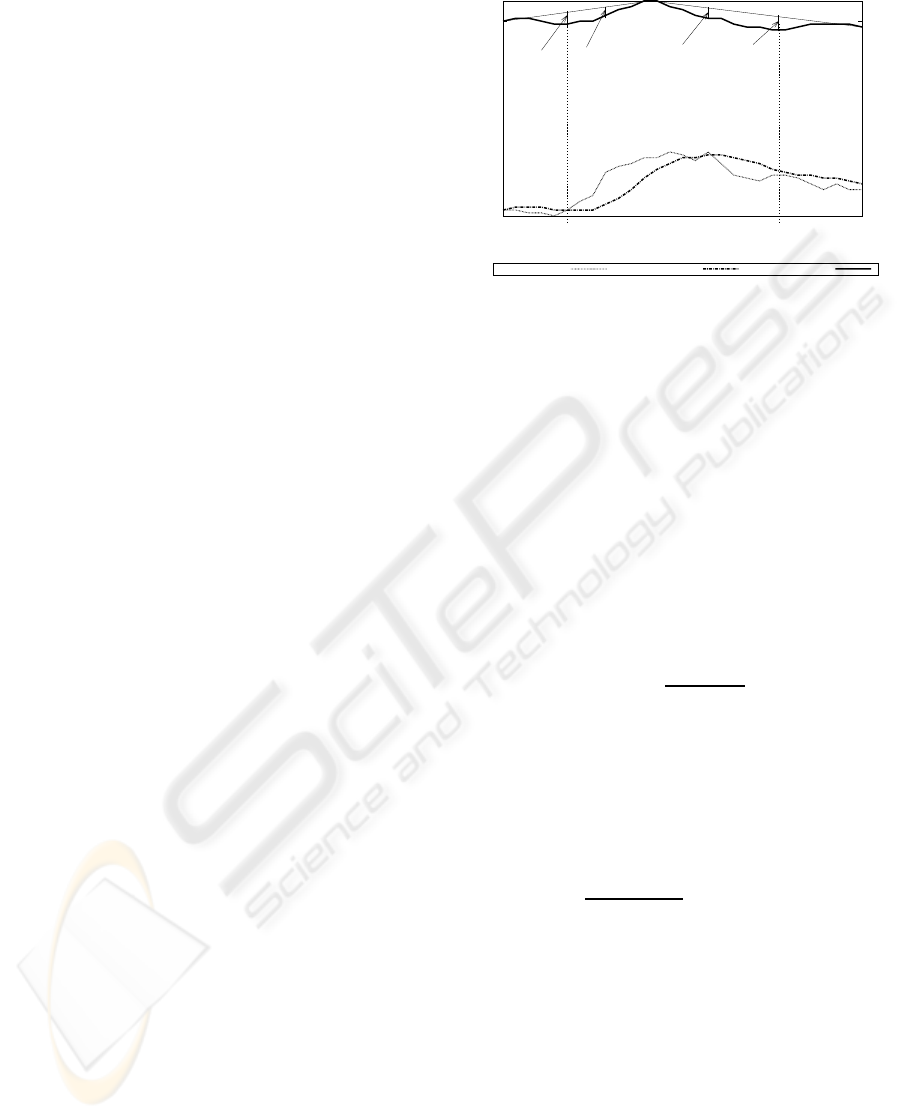
3.2.1 Derivative Curve Analysis
This approach utilizes the advantage of time deriva-
tive to capture the signal variations. The derivative
approximation can be implemented using the follow-
ing difference equation,
y
nT
= x
nT
− x
(n−1)T
(5)
where the delay of the derivative filter is set to nearly
10ms at sampling frequency of 100Hz. A snapshot of
the filtered signal and the signal after implementing
derivative approximation is shown in Figure 3. For
determining T wave end fiducials, process starts with
finding the peak of derivative signal within the search
window. The peak is determined at the location where
maximum change in the slope is occurred. Let this
0
0
Amplitude (mV)
Time (ms)
d
peak
d
L
d
R
L
R
L
L
d
l
δ
max
L
d
j
δ
j
d
i
δ
i
d
k
δ
max
R
Raw Signal Filtered Derivative
Figure 3: Detection of T wave end fiducials using derivative
curve analysis within the search window.
location be denoted as d
peak
. The procedure to de-
termine the T
of f set
fiducial is as follows: Once d
peak
is known, derivative signal is traced from d
peak
to d
R
positions in time-forward order. The d
R
position can
be set at the right most boundary of the search win-
dow i.e., QRS
of f set
+ 470ms. Let a line L
R
is drawn
extending from d
peak
position to d
R
position where
the coordinates of these positions are (x
peak
,y
peak
) and
(x
R
,y
R
) respectively. Thus, the equation of L
R
can be
formulated as,
L
R
≡ y− y
peak
= Slope ∗
x− x
peak
(6)
where Slope can be computed by,
Slope =
y
R
− y
peak
x
R
− x
peak
(7)
Along with the entitled signal, vertical offset of each
sample in [d
peak
, d
R
] to the line L
R
is computed. Let d
i
be some position in [d
peak
, d
R
] in the derivative signal
whose coordinate be (x
i
,y
i
). The vertical offset (δ
i
)
corresponds to d
i
, can be computed using the follow-
ing formula,
δ
i
=| y
peak
+
y
R
− y
peak
x
R
− x
peak
∗
x
i
− x
peak
− y
i
| (8)
Maximum among δ
i
’s is selected. The desired posi-
tion at which the vertical offset of the entitled signal is
maximum, is the position of T
of f set
. The found sam-
ple at position d
k
where vertical offset is maximum
e.g., δ
R
max
= Max(δ
i
) is the T
of f set
fiducial as shown
in Figure 3.
A similar approach is used for the detection of
T
onset
fiducial within the search window. The deriva-
tive signal is traced from d
peak
to d
L
position in time
reverse order where the position d
L
is set at leftmost
boundary of the search window, i.e. QRS
of f set
+80ms
as shown in Figure 3. In the derivative signal, a line
L
L
is drawn extending from d
peak
to d
L
position. Let
AN EFFICIENT AND ROBUST TECHNIQUE OF T WAVE DELINEATION IN ELECTROCARDIOGRAM
149

the coordinate of d
L
be (x
L
,y
L
). Along to the deriva-
tive signal, vertical offset δ
j
is computed for each po-
sition d
j
(where d
j
∈ [d
peak
,d
L
]) to the line L
L
in time
reverse order according to the formula,
δ
j
=| y
peak
+
y
L
− y
peak
x
L
− x
peak
∗
x
j
− x
peak
− y
j
| (9)
where (x
j
, y
j
) is the coordinate corresponding to posi-
tion d
j
. Among all d
j
’s, a position is found where the
value of the vertical offset (δ
j
) of the entitled signal is
maximum, i.e., δ
L
max
= Max(δ
j
). The found position
d
l
returns the T
onset
fiducial as shown in Figure 3.
3.2.2 Waveform Curvature Analysis
It is a non derivative based approach which is capable
to limits the noise sensitivity of the cardiac signal and
determines T wave end fiducials using the analysis of
waveform curvature found at its ends.
Notations and Heuristics Basis. It is assumed that
the origin of a T wave which a stage prior to ventric-
ular repolarization and the end of T wave which is a
stage prior to the end of ventricular stimulation, ex-
hibit convex shapes at ends. It means, two convex
regions can be considered at the neighborhood of T
wave ends. The boundaries of both convex regions
are extended towards peak of the waveform so that it
becomes the common extremity of both regions. Let
t
1
and t
2
are two time instances corresponding to the
beginning and the end of T wave as shown in Fig-
ure 4. Consequently, the aim is to determine the time
instances t
1
and t
2
as waveform end fiducials whose
neighboring regions are convex. Let these regions are
separated by the peak position, t
peak
. The proposed
approach determines T wave end fiducials, T
onset
and
T
of f set
through tracking down the entitled signal and
finding the sample of minimum radius of curvature at
both convex regions which is found to be more robust
to local noise.
This approach starts its processing with the fil-
tered signal which is corrected from signal oscilla-
tions around isoelectric line. A search window is set
heuristically and an interval [t
L
,t
R
] is delimited inside
the search window in each beat of the ECG. The inter-
val is delimited with an observation that the time po-
sitions t
1
and t
2
which correspond to T wave ends are
completely inside the interval and the time positions
t
L
and t
R
are on opposite side of t
peak
. The peak posi-
tion can be determined by finding of local maximum,
while the extremities of the interval, t
L
and t
R
can be
determined by finding of local minimum at both sides
of t
peak
in the entitled signal within the search win-
dow.
0
Amplitude (mV)
Time (ms)
t
L
t
1
τ
i
τ
j
δ
j
δ
max
R
t
peak
-∆t
δ
i
δ
max
L
U
V
t
2
t
R
t
peak
+∆t
t
peak
Figure 4: Detection of T wave end fiducials using waveform
curvature analysis within the search window.
Assumption 1. The segments of T wave within the
intervals [t
peak
,t
L
] and [t
peak
,t
R
] are convex.
Typically, T wave is convex in the neighborhoods
of time instances t
1
and t
2
while it shows concaveness
in interval [t
1
,t
2
]. It is acknowledged from the mor-
phology of T waveform that the onset of T wave (i.e.,
t
1
) and the time instant t
L
which limits this onset of the
waveform are laid on isoelectric line. The deflection
of T wave shows the time evolution of electrical activ-
ity caused by ventricular repolarization which starts
after the electrical activity caused by delayed depo-
larization of ventricles. It shows a significant time
gap (∼ 80ms in normal objects) between the start of
ventricular repolarization and the late ventricular de-
polarization where cardiac impulse neutralizes each
other and resulting approximately zero difference in
electrical potential. This time gap is referred as iso-
electric period. In this considerationit is also assumed
that the interval [t
L
,t
1
] is strictly inside the isoelectric
period.
Similarly, the offset of T wave (i.e., t
2
) and the
time instant t
R
which limits the onset of the wave-
form are laid on isoelectric line. During the interval
[t
2
,t
R
], cardiac muscles are prepared for next cycle of
the heartbeat. The preparation time of myocardium
prior to the start of next cycle of the heartbeat is sub-
stantially larger, while the impulse deflections during
this period are insignificant. Thus, this period can be
considered as isoelectric period. Similarly, it is also
assumed that the interval [t
2
,t
R
] is strictly inside the
isoelectric period.
Proposition 1. Under assumption 1 and the fixing of
time differences between following intervals:
1. (t
peak
− △t, t
L
) and (t
peak
− △t, t
peak
− τ
i
); where
τ
i
∈ [t
peak
− △t,t
L
];
2. (t
peak
+ △t, t
R
) and (t
peak
+ △t, t
peak
+ τ
j
); where
τ
j
∈ [t
peak
+ △t,t
R
] and △t ≥ 0.
BIOSIGNALS 2009 - International Conference on Bio-inspired Systems and Signal Processing
150

the time instances t
1
and t
2
can be determined as the
position of minimum radius of curvature between time
differences 1 and 2, respectively.
Proof: For case 1 the waveform is traced from t
peak
to
t
L
position in time reverse order. Assume that
e
U and
e
V are directed line segments drawn between the time
difference (t
peak
− △t, t
L
) and (t
peak
− △t, t
peak
− τ
i
)
respectively as shown in Figure 4. Here, point of in-
terest is the time instance t
1
which is the position of
minimum radius of curvature of the waveform seg-
ment in interval [t
peak
,t
L
]. The radius of curvature is
computed using the principal of vector cross product
between two directed line segments
e
U and
e
V. Let δ
i
be the perpendicular offset of two directed line seg-
ments
e
U and
e
V as shown in Figure 4 then δ
i
can be
determined using following formula,
δ
i
=|
e
V | sinθ (10)
where,
sinθ =
v
u
u
u
t
1−
e
U.
e
V
2
|
e
U |
2
|
e
V |
2
(11)
Let the definition of line segments in time amplitude
system be given as
e
U =
e
U
t
,
f
U
A
and
e
V =
e
V
t
,
f
V
A
,
then δ
i
can be computed using Eqn. (10) and (11) as
follows,
δ
i
=
|
e
U
t
f
V
A
−
f
U
A
e
V
t
|
q
e
U
t
2
+
f
U
A
2
(12)
In general, the perpendicular offset δ
i
can be deter-
mined using Eqn. (12) at any time instance τ
i
, where
τ
i
∈ [t
peak
− △t,t
L
].
Once the perpendicular offsets (for ∀τ
i
) are
known, the position of time instance corresponding
to minimum radius of curvature can be determined by
finding of the sample where δ
i
is maximum. Let it be
δ
max
L
, i.e.,
δ
max
L
= Max
n
δ
t
peak
−△t
,. . . , δ
t
L
o
(13)
It returns the position to the time instance t
1
.
Similarly, for case 2 one can determine the di-
rected line segments
e
U and
e
V between the time dif-
ference (t
peak
+ △t, t
R
) and (t
peak
+ △t, t
peak
+ τ
j
),
respectively. The perpendicular-offset δ
j
between the
directed line segments can be determined by tracking
the segment of signal from t
peak
position to t
R
position
in time forward order for all τ
j
, where τ
j
is in [t
peak
+
△t,t
R
] as shown in Figure 4. Finally, the time instance
corresponding to minimum radius of curvature of the
segment in the interval [t
peak
,t
R
] can be determined
by δ
max
R
, where δ
max
R
= Max
n
δ
t
peak
+△t
,. . . , δ
t
R
o
.
It returns the position to the time instance t
2
.
The proposed approach extracts T wave end fidu-
cials in two stages. In the first stage, peak posi-
tion is determined by finding of local maximum in
the region surrounding to T wave whose boundaries
are limited through the search window in each heart-
beat. In the second stage, T
onset
and T
of f set
fiducials
are determined by tracking downhill the filtered sig-
nal and find the location of minimum radius of curva-
ture at both ends. Experimental result shows that the
detected fiducials are more robust to high frequency
noise in the beat.
3.3 Fusion of Delineation Performance
In this work, T wave delineator takes the advantage
of both the proposed approaches. It is found that the
approach based on the analysis of waveform curva-
ture returns more accurate T wave end fiducials when
the assumption 1 is satisfied. That is the region sur-
rounded to onset and offset positions of T wave is
convex. Otherwise, the approach based on the anal-
ysis of derivative curve produces better result. Thus,
for a reliable and accurate detection of T wave end
fiducials, the delineation results obtained from both
the approaches are fused. In this work, the fusion of
delineated results is obtained by taking mean of both
the results.
3.4 Other T Wave Morphologies
T wave morphologies can be generally classified as
positive, negative, and biphasic as shown in Figure
5. The delineation approaches proposed here are for-
mulated for the positive T waves of the ECG. The
other T wave morphologies can be treated as follows:
For negative T wave the proposed approaches perform
equally well. The only difference finds in this case
is the detection of time instance to the peak of the
entitled signal which is associated to the local min-
imum instead of local maximum in both approaches.
In biphasic case, local maximum-minimum can be de-
termined for biphasic positive-negative T wave and
minimum-maximum can be determined for biphasic
negative-positive T wave. The end fiducials of bipha-
sic (positive-negative) T wave can be determined by
tracking of the entitled signal downhill from maxi-
mum position in time-reverse order for the detection
of T
onset
and uphill from the minimum position in
time-forward order for the detection of T
of f set
in both
approaches. The end fiducials of biphasic (negative-
positive) T wave can be determined vice-versa.
AN EFFICIENT AND ROBUST TECHNIQUE OF T WAVE DELINEATION IN ELECTROCARDIOGRAM
151

0
0
Voltage (mV)
Time (ms)
0
0
Voltage (mV)
Time (ms)
0
0
Voltage (mV)
Time (ms)
Figure 5: Examples of different morphologies of T wave, (a) Negative, (b) Biphasic positive-negative and (c) Biphasic
negative-positive.
Table 1: Detection performance of T wave in QT
database. Se measures the waveform detection sensi-
tivity (Se(%) = 100 × TP/(TP+ FN)). The estimate
of the detection of true waveform is determined by P
+
(P
+
(%) = 100 × TP/(TP+ FP)). Acc determines the
measurement of delineation accuracy (Acc(%) = 100 ×
(TP+ TN)/(TP+ TN +FP+ FN).
Technique Parameters T wave
# annotations 3542
TP N/R
FP N/R
WT Detector FN N/R
(Martinez et al., 2004) Se (%) 99.77
P
+
(%) 97.79
Acc(%) N/R
# annotations 2500
TP N/R
FP N/R
MD Detector FN N/R
(Sun et al., 2005) Se (%) 99.6
P
+
(%) N/R
Acc (%) N/R
# annotations 20000
TP 19980
(999@1000)
FP 180
(9@1000)
Proposed Work FN 20
(1@1000)
Se (%) 99.9
P
+
(%) 99.1
Acc (%) 99.01
The approaches utilize for T wave delineation typ-
ically determine the morphology of its waveform a
priori to its onset and offset detection. A simple ap-
proach that distinguishes biphasic T wave with its
other waveforms (e.g., positive T wave or negative T
wave) can be the searching of zero crossing in the sig-
nal within the search window. If there is an existence
of zero-crossing then T wave is biphasic; otherwise it
is either a positive T wave or a negative T wave.
4 EXPERIMENTAL RESULTS
The performance of the proposed T wave delineator
is evaluated on Physionet QT database (Laguna et al.,
1997) which served as a reference for the validation
and the comparisons of T wave delineation methods.
The performance of T wave detection and the deter-
mination of its end fiducials are validated on manually
annotated samples of this database.
QT database is a mixed database contains 105
fifteen minutes excerpts of two-channel ambulatory
ECG recordings. The recordings are digitized at
250 Hz per channel with 11-bit resolution over a
10 mV range. It contains following databases, 15
from MIT-BIH Arrhythmia database, 6 from MIT-
BIH ST Change database, 13 from MIT-BIH Supra-
ventricular Arrhythmia database, 10 from MIT-BIH
Normal Sinus Rhythm database, 33 from European
ST-T database, 24 from Sudden Death from MIT-BIH
database and 4 records from MIT-BIH Long Term
ECG database. In this work the MIT-BIH Arrhyth-
mia database and MIT-BIH Normal Sinus Rhythm
database, first channel recordings have been used for
analysis.
In this experiment, the performance of T wave de-
tection is measured on following terminologies: TP is
the true detection of T waves. FN returns the waves
those are not registered in the automatic delineation
process. FP returns those waves that are detected in-
correctly. In order to quantify the accuracy of the pro-
posed delineator mean error (µ
ε
) and standard devi-
ation (σ
ε
) of the differences between the annotation
results and the automated delineator results are also
computed. The mean error is used to measure the
closeness between them while σ
ε
measures stability
in the delineation results. Sensitivity (Se), positive
predictivity (P
+
) and accuracy (Acc) are also com-
puted to measure the detection performance.
BIOSIGNALS 2009 - International Conference on Bio-inspired Systems and Signal Processing
152

Table 2: End Fiducials detection performance of T wave and its comparison with different methods in QT database. (N/R:
Not Reported)
Technique Parameters T
onset
T
of f set
# annotations 3542 3542
µ
ε
± σ
ε
(ms) N/R -1.6 ±18.1
WT Detector Se (%) 99.77 99.77
(Martinez et al., 2004) P
+
(%) 97.79 97.79
Acc (%) N/R N/R
# annotations 2500 2500
µ
ε
± σ
ε
(ms) 7.9±15.8 8.3 ±12.4
MD Detector Se (%) 99.8 99.6
(Sun et al., 2005) P
+
(%) N/R N/R
Acc (%) N/R N/R
# annotations 20000 20000
µ
ε
± σ
ε
(ms) 0.9±7.8 5.3±9.7
Proposed Work Se (%) 99.9 99.8
P
+
(%) 99.1 99
Acc (%) 99.01 98.8
Tolerance Limit
(The CSE Working Party, 1985) σ
ε
(ms) ... 30.6
4.1 Waveform Detection
The performance of the proposed delineator for T
wave detection on Physionet QT database is shown in
Table 1. In this study, first 8 seconds of the selected
record is used for training purpose and setting of the
parameters. Therefore this portion of the sample is
exempted from validation. From rest of the sample,
1000 peak annotations are selected. The experiment
is conducted on 20 records and the results are shown
in Table 1 which are compared with the results ob-
tained from some of the well known methods, WT
detector (Martinez et al., 2004) and MD detector (Sun
et al., 2005). Among the 1000 peak annotations of T
waves, the proposed delineator is detected 999 waves
correctly and 9 waves incorrectly while it is left only
one wave from the detection, on an average from one
record. It is achieved the detection Se of 99.9% and
P
+
of 99.1% which is higher than any of the pub-
lished results. The accuracy of T wave detection is
measured and found more than 99 % which is not re-
ported (N/R) in the other methods.
4.2 End Fiducials Detection
The statistical results for µ
ε
, σ
ε
, Se, P
+
and Acc of
T
onset
and T
of f set
fiducials obtained from the proposed
delineator are shown in Table 2 and are compared
with other published results. The accepted σ
ε
toler-
ance from the measurements recommended by CSE
(The CSE Working Party, 1985) is also given in the
last row of the this Table.
The delineator takes the advantages of the pro-
posed approaches and achieves outstanding delin-
eation performance on the evaluated database. Lower
values of mean error and standard deviation for T
onset
fiducial are observed in comparison to MD detector
while these values are not reported in WT detector.
The mean error for T
of f set
fiducial obtained in this
work (5.3 ms) is found better than MD detector (8.3
ms) while WT detector performed best (-1.6 ms). The
standard deviation for T
of f set
fiducial is reported bet-
ter than any of the published results and found well
within the acceptable limit recommended by the CSE
working party. This signifies the robustness in the
detection of the end fiducial of T waveform. Never-
theless, the end fiducial is delineated much efficiently
with the Se = 99.8%, P
+
= 99% and an accuracy of
98.8%. The mean error and standard deviation for
T
onset
fiducial are also found better than both WT and
MD detectors. These results of T wave delineation are
better than any of the published methods.
5 CONCLUSIONS
This paper has presented a novel method of T wave
delineation which showed an efficient detection of T
wave and its end fiducials in the single-lead electro-
cardiogram. The performance of the proposed sys-
tem has validated on standard annotated database on
a total of 20000 (20x1000) peak annotations. The re-
sults have shown a reliable and accurate delineation of
AN EFFICIENT AND ROBUST TECHNIQUE OF T WAVE DELINEATION IN ELECTROCARDIOGRAM
153

T wave which outperformed in comparison to other
published results on the referenced database. The
method has detected T waves and their end bound-
aries with an accuracy of more than 99% annotated
by cardiologists in the ECG.
The delineation errors in this experiment have
found well within the referenced inter-cardiologist
observations, especially for the detection of T wave
end. The remarkable performance of T wave delin-
eation has been achieved, due to the utilization of
different approaches of basis the time derivative and
other than the time derivative. The mean error and
standard deviation of T wave end fiducials have been
found smaller than one inter sample time which is 10
ms.
REFERENCES
Laguna, P., Jane, R., and Caminal, P. (1994). Automatic
detection of wave boundaries in multilead ECG sig-
nals: Validation with the CSE database. Computers
and Biomedical Research, 27(1):45–60.
Laguna, P., Mark, R. G., Goldberger, A. L., and Moody,
G. B. (1997). A database for evaluation of algorithms
for measurement of QT and other waveform intervals
in the ECG. Computers in Cardiology, pages 673–
676.
Li, C., Zheng, C., and Tai, C. (1995). Detection of ECG
characteristic points using wavelet transforms. IEEE
Transaction on Biomedical Engineering, 42(1):21–28.
Lynn, P. A. (1977). Online digital filters for biological sig-
nals: some fast design for a samll computer. Medical
& Biological Engineering & Computing, 15.
Martinez, J. P., Almeida, R., Olmos, S., Rocha, A. P., and
Laguna, P. (2004). A wavelet-based ECG delineator:
Evaluation on standard database. IEEE Transactions
on Biomedical Engineering, 51(4):570–581.
McSharry, P. E., Clifford, G. D., Tarassenko, L., and Smith,
L. A. (2005). A dynamic model for generating syn-
thetic electrocardiogram signals. IEEE Transactions
on Biomedical Engineering, 50(3):289–294.
Pan, J. and Tompkins, W. J. (1985). A real time QRS de-
tection algorithm. IEEE Transactions on Biomedical
Engineering, 32(3):230–236.
Sun, Y., Chan, K. L., and Krishnan, S. M. (2005). Charac-
teristic wave detection in ECG signal using morpho-
logical transform. BMC Cardiovascular Disorders,
28:1417–2261.
The CSE Working Party (1985). Recommendations for
Measurement Standards in Quantitative Electrocar-
diography. European Heart Journal.
Zhang, Q., Manriquez, A. I., and Medigue, C. (2005). An
algorithm for robust and efficient location of t-wave
ends in electrocardiogram. Computers in Cardiology,
33.
BIOSIGNALS 2009 - International Conference on Bio-inspired Systems and Signal Processing
154
