
3D VISUALIZATION AND SEGMENTATION
OF BRAIN MRI DATA
Konstantin Levinski, Alexei Sourin and Vitali Zagorodnov
Nanyang Technological University, Nanyang Avenue, Singapore
Keywords: Segmentation, MRI data, Brain, 3D visualization.
Abstract: Automatic segmentation of brain MRI data usually leaves some segmentation errors behind that are to be
subsequently removed interactively using computer graphics tools. This interactive removal is normally
performed by operating on individual 2D slices. It is very tedious and still leaves some segmentation errors
which are not visible on the slices. We have proposed to perform a novel 3D interactive correction of brain
segmentation errors introduced by the fully automatic segmentation algorithms. We have developed the tool
which is based on a 3D semi-automatic propagation algorithm. The paper describes the implementation
principles of the proposed tool and illustrates its application.
1 INTRODUCTION
Magnetic Resonance Imaging (MRI) is mainly used
to visualize the structure and function of the body. It
is a method for sampling densities in a volume
which provides detailed images of the body in any
plane. Each point on an MRI scan corresponds to a
certain point in the body being scanned. Though 3D
coordinates of the point are directly available, it can
be a problem to determine what organ the point
belongs to. The process of establishing such
relations between the MRI points and their origins is
called segmentation.
All segmentation approaches can be classified
into two groups: automatic and interactive.
Automatic segmentation is a well attended area
of research. It assumes that verification and error
correction will be done after the results of the
segmentation are obtained. There are different
methods used for automatic segmentation. For
example, a generic brain model is used in (Rohlfing
and Maurer, 2005), with the toolkit presented in
(Bazin, Pham et al., 2005). In (Ibrahim, John et al.,
2006), statistical properties of different areas of the
brain are proposed to be used to determine which
voxels belong to it. Graph-cut algorithm, as
described in (Boykov and Jolly, 2001), represents
MRI as a graph and uses a minimum flow
partitioning for segmentation.
Interactive segmentation involves direct
guidance by the user during the segmentation
process. For example, in (Hahn and Peitgen, 2003)
and (Armstrong, Price et al., 2007) the user controls
the flow of the segmentation as well as provides
hints to obtain correct results. To detect the border
of a certain segment, it is common to define an
energy related to this surface and minimize this
energy (Giraldi, Strauss et al., 2003). An initial
configuration is usually defined interactively by the
user, with an interactive minimization resulting in
operations similar to Adobe Photoshop lasso tool, as
it was, for example, implemented in (de Bruin,
Dercksen et al., 2005) and (Falcao and Udupa,
2000). A complete extension using surfaces was
described in (Yushkevich, Piven et al., 2006), where
the interactively defined original surface evolves to
the energy minimum. The energy minimization does
not always give correct results, and the current
works do not provide for methods to fine-tune the
proposed segmentations.
The interactive methods do not assume any pre-
existing segmentation. Hence, they are not suitable
for correction of segmentations done by the
automatic algorithms. The automatic brain
segmentation algorithms, however, are quite robust,
and even when they do produce an incorrect
segmentation, it can usually be easily fixed.
Therefore, the most efficient way to segment a large
amount of data is to apply an automatic algorithm to
the bulk of MRI data and then check and correct the
results.
111
Levinski K., Sourin A. and Zagorodnov V.
3D VISUALIZATION AND SEGMENTATION OF BRAIN MRI DATA.
DOI: 10.5220/0001657101110118
In Proceedings of the Fourth International Conference on Computer Graphics Theory and Applications (VISIGRAPP 2009), page
ISBN: 978-989-8111-67-8
Copyright
c
2009 by SCITEPRESS – Science and Technology Publications, Lda. All rights reserved
To perform interactive segmentation, the user
needs a visual feedback reflecting both the original
data and the current segmentation to make a decision
about its correctness. Typically, it is done by going
through 2D slice images. There are several software
tools commonly used for the interactive correction
of the segmentation results (e.g.,
http://www.slicer.org, http://www.3doctor.org).
They provide the user with some 2D tools to
examine and fix segmented areas in 2D slices
similar to the ones available in interactive image
editors, such as lasso, erosion, and area propagation.
Even with the advanced 2D tools, the necessity
to analyze and edit every slice in every MRI data set
is a daunting task. While there exist 3D versions of
segmentation corrections, presented in (Kang,
Engelke et al., 2004), the user interaction is still
limited there to 2D volume sections. Even though
the 2D sections convey all the information without
any ambiguity, some artefacts can be only seen on
3D views since they do not contribute significantly
to each individual 2D slice.
There exist different approaches to 3D
visualization of MRI data segmentations.
Volumetric methods give a good overall picture of
the data set, however they often appear to be
confusing and lacking fine details. Surface rendering
could be a good alternative to it but the brain surface
is usually not directly available in the original 3D
volume MRI data. Hence, a 3D visualization method
suitable for interactive segmentation still poses a
significant research and development challenge.
In Section 2, we discuss the main idea of our
method and provide a description of the algorithms.
In Section 3, we describe the developed interactive
segmentation tool. In Section 4, we give examples of
the tool application and provide the collected
statistics proving the advantage of our method over
the commonly used ones.
2 VISUALIZATION FOR
INTERACTIVE
SEGMENTATION
In this section we introduce our visualization method
for interactive segmentation. Interactive
segmentation places important restrictions on the
required visualization techniques. For example, if
interactive segmentation requires the user to have
information on the extent of the currently segmented
area, it is important to provide a comprehensive
feedback from the process so that the user does not
have to switch between different views to get a
complete picture. Hints on where to look for the
wrongly segmented areas are also important and
they have to be properly detected and visualized.
The focus of the visualization process has to be on
conveying 3D information relevant to the
segmentation. Therefore, we do not use standard
ways of rendering 3D shape using lighting since it is
important to allocate most of the color information
to visualize density. Instead, we have used edge
outlines for displaying 3D shape as it is shown in
Figure 1.
Figure 1: Rendering features.
2.1 Overview of the Proposed
Interactive Segmentation Approach
Automatic segmentation algorithms are quite
advanced and usually produce correct results. Even
when they do fail, it usually results in a small
problem which could be corrected interactively.
The task of interactive correction of the
automatic segmentation has two parts: error
localization and error correction.
Error localization is important as most of the
segmentations are correct, and one has to find those
which need to be edited. Current automatic
segmentation methods do not provide the users with
any hints on where to look for errors.
The proposed method is based on the error
estimation of a particular segmented area, using both
values from the MRI scan and the automatically
generated 3D surface. The estimation is then used to
provide a 3D view of the segmentation so that the
user is provided with the hints on possible
segmentation problems, as shown in Figure 2. The
3D view also reveals the defects which are difficult
to identify using only 2D sections. The error hinting
Edge lines
Darker areas
GRAPP 2009 - International Conference on Computer Graphics Theory and Applications
112

method is also used by the error correction algorithm
which does not require a precise input from the user,
i.e. the user just has to initiate and monitor the
automatic detection process in a potential
problematic error area.
Error correction can be still tedious, and the
correction of wrong segmentations is different from
doing segmentation from scratch. The automatic
segmentation algorithms use different criteria to
determine how each point of the volume should be
classified. The failure of automatic classification
means that the chosen criteria were insufficient to
distinguish between the brain and non-brain tissues.
Therefore, there can be defined additional
distinguishing criteria, which, when combined
together and aided by user interaction, provide us
with the correct segmentation.
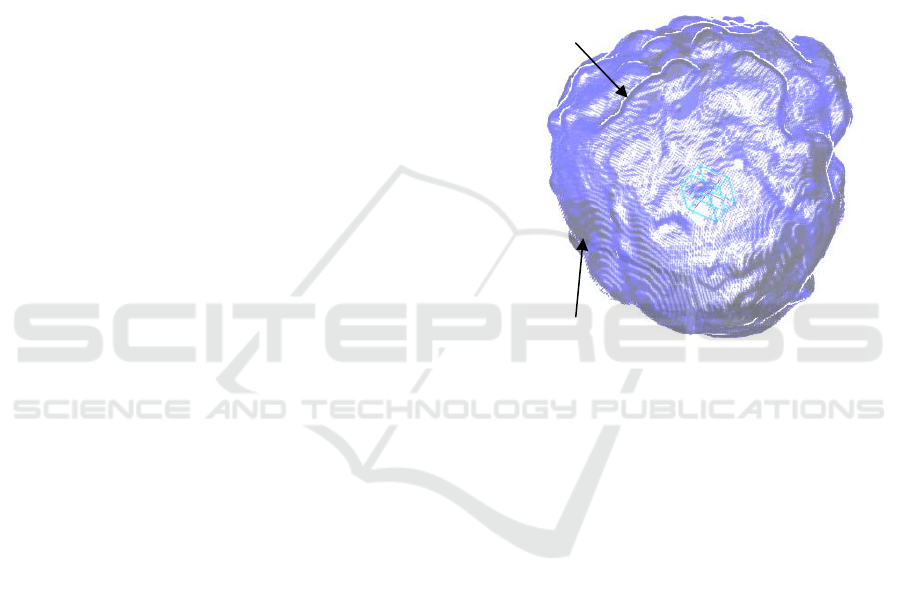
Figure 2: 3D MRI region and 2D plane section. Erroneous
regions are highlighted.
3 METHOD DETAILS
The visualization and correction methods require
information on whether a particular voxel is correct
or not. There are different ways to estimate the
probability that a given voxel is wrongly classified.
Some of them are used in the automatic algorithms,
and others are calculated during the interactive
correction process.
For example, the conclusion about the
correctness of segmentation can be based upon
intensities of an MRI image and an automatically
generated segmented surface and its normal vectors.
The existing segmentation is produced by a fully
automatic algorithm which is then gradually
corrected.
The probability estimation is based on several
error criteria dealing with a specific aspect of
correctness estimation. The criteria are combined by
a weighted average to produce the resulting
estimation.
3.1 Error Criteria
To calculate an error criterion, one has to examine
common artifacts produced by the automatic
algorithm. Wrong segmentations are unlikely to be
located far from the automatically generated surface
of the brain. Also, they often appear disconnected
from the properly segmented area. Finally, they
usually consist of voxels with a similar intensity. As
such we introduce the following criteria.
The Depth criterion assigns a smaller error
probability to deeper voxels, as they are less likely
to be erroneously segmented.
The Topology criterion checks whether there are
disconnected parts in the segmentation. There are
automatic algorithms which can mark small chunks
of dura matter as belonging to the brain. The
topology criterion is designed to mark such chunks
as erroneous by analyzing the length of the line
containing the point.
The Intensity criterion uses the user input and the
intensity information. It exploits the fact that the
most erroneous areas are of a similar intensity, as
they are usually descended from the same tissue,
e.g., skull, eye, etc.
To allow the user to guide the correction process,
it is required to provide efficient feedback
mechanisms. In our case, these are visualization
methods tailored to displaying and highlighting the
segmentation errors.
3.2 Visualization
All automatic segmentation errors in skull stripping
happen on the generated surface of the brain. There
is no point to overwhelm the user by displaying the
internal parts of the segmented region. We just take
the outer voxels and color them according to the
respective error criteria, so that the user could
determine the most likely problematic part.
If available, a white matter surface with
segmentation error hints is visualized behind the
transparent brain surface, as shown in Figure 2.
Possible
segmentation
problems
3D VISUALIZATION AND SEGMENTATION OF BRAIN MRI DATA
113
As shown in Figure 1, to create creases
conveying 3D shapes when intensity is fully utilised
for providing density information, we have used an
extension of the point-based rendering method, so
that the points located on the edges would let the
background color be seen through by setting them to
half-transparent, thus providing the outlines of 3D
features. The intensity then is completely devoted to
hinting the user on where the segmentation errors
might have occurred.
In general, it is not always possible to calculate
every criteria until the user selects a seed point. It is
also not possible to set the seed point until all
criteria are known, as there is no information to base
the decision upon. We have solved this problem by
providing the user with preliminary information,
which can help to make the initial estimate by the
user. As the user only sees the surface of the
segmented area, it is impractical to use the direct
intensity information of the surface voxels, as the
surface is usually of a uniform intensity. Volume
rendering would be redundant, as we only need
information on the volume several layers deep. To
provide an idea on internal structure without
resorting to unnecessary volume rendering and
requesting an input from the user, we propose to
color each surface voxel with an average intensity of
the surrounding segmented voxels. If there are
abnormalities beyond the surface of the segmented
area, they will be immediately noticeable as a
surface intensity pattern.
If such averaging is not sufficient, it is also
possible to visualize layers of voxels below the
surface. By interactive changing the layer, the user
can get valuable insights on the structure of the
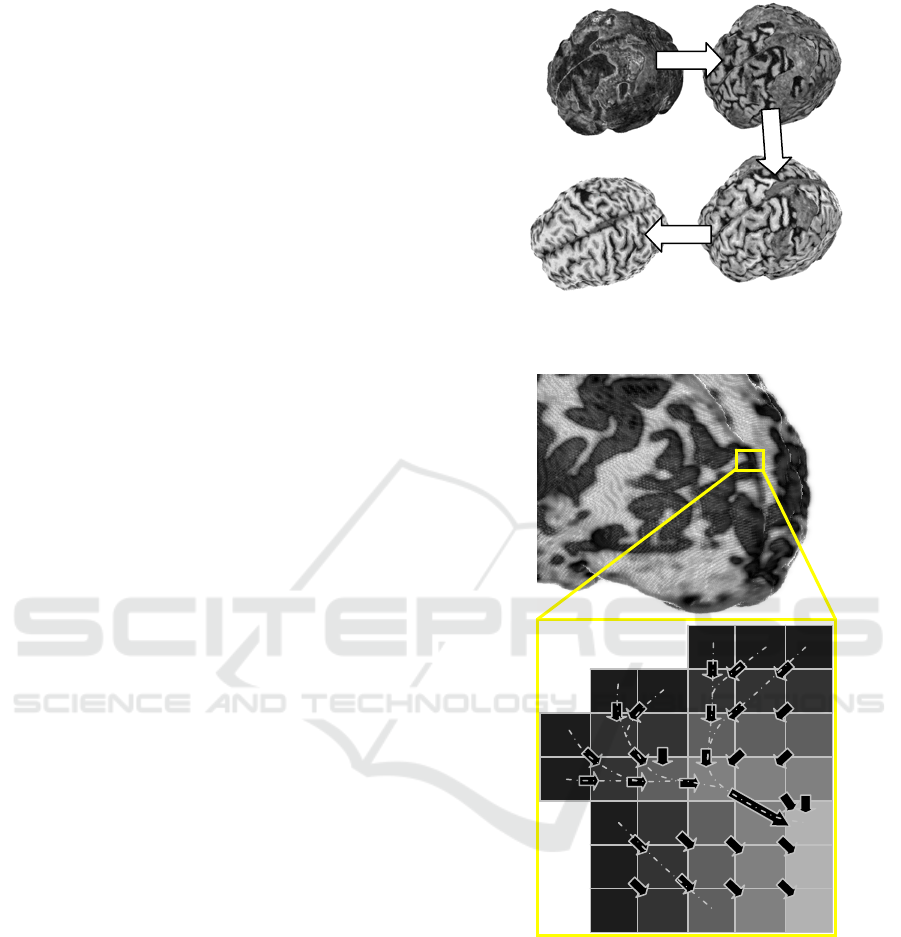
upper layers of the brain. Figure 3 shows results of
the visualization by progressive layer removal.
Finally, quite often the surface of the currently
segmented region is available. To help the user to
locate the wrongly segmented areas, we have
interleaved the surface with the point-based display
and painted the surface with the probability criteria
provided by the segmentation error criterion. As the
surface of the brain is interpreted as a transition from
the white to dura maters, it makes sense for the error
criterion to analyze the sequence of voxels sorted by
their proximity to the surface. An example of such
sequences is shown in Figure 4.
Figure 3: Progressive interactive layer removal provides
information on the outer voxels layout.
Figure 4: Depth map for defining the correctness metric.
Gray levels denote the depth of a particular voxel. Arrows
show the closest voxel from the next level.
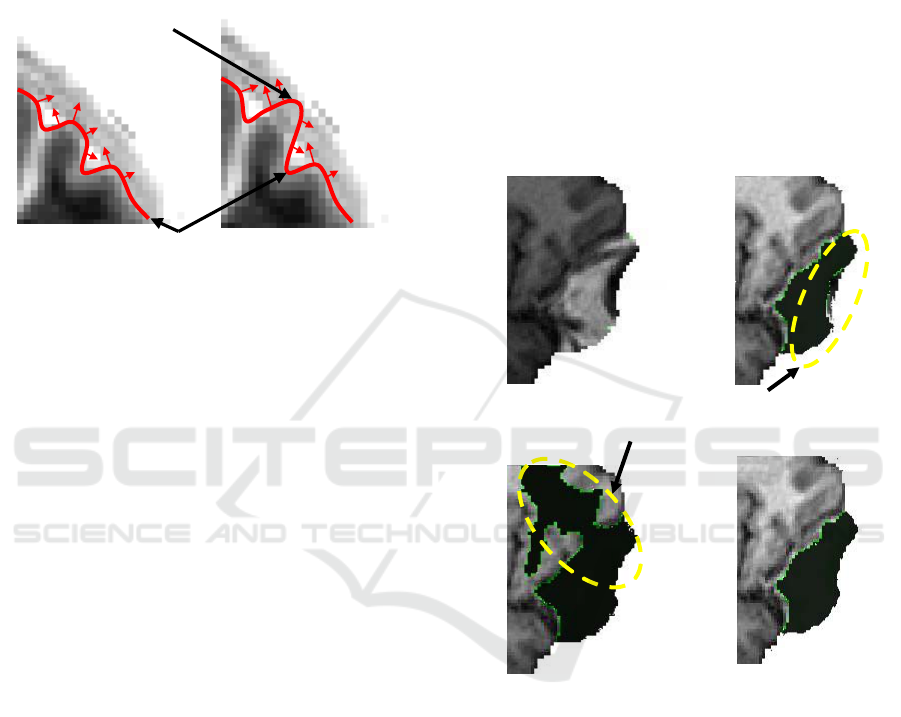
Another promising approach to generate hints for
the wrongly segmented locations is to use the white
matter surface and analyze the MRI values along the
normals (Figure 5). From our experience, the users
who have tried this feature found it to be very useful
and generally better and more efficient than the
method of scanning every slice for possible defects.
While we avoid volume rendering, the seeds
placed by the user can be located beneath the surface
GRAPP 2009 - International Conference on Computer Graphics Theory and Applications
114
of the segmented area. Therefore, it is necessary to
provide an ability to make the surface display
transparent. Once the user suspects a region to be
wrongly segmented, it is required that there must be
an easy access to the original 2D MRI data slices for
verification.
Figure 5: Segmentation error hint generation by analyzing
the intensity changes along normal vectors.
4 APPLICATION
To construct an application, one has to define input
data, consider how to arrange the software
components and, finally, define how the software
would fit into the general workflow.
4.1 Source Data
The interactive segmentation process starts with the
result of a fully automatic processing. For example,
it is quite common to have about 50 incorrectly
skull-stripped images out of 300 which can be
concluded by an expert. The automatic skull
stripping algorithms are tuned to avoid classification
of voxels belonging to the brain as non-brain ones,
i.e. to avoid false negatives. Therefore, all
segmentation errors are essentially non-brain tissues
wrongly classified as belonging to the brain. An
example of such a misclassification is shown in
Figure 6, where all the displayed voxels were
classified as the brain, while the lighter part on the
left does not belong to the brain.
Our goal is to improve and speed up the
interactive correction. We are using the proposed
propagation method and functions for propagation to
create a robust interactive segmentation correction
tool which is more efficient than a 3D slicer for the
second processing step.
4.2 Application Workflow
As described in the previous section, the
segmentation consists of 2 steps: model examination
and model correction. A pure 3D display is still
insufficient for the conclusive assessment of the
segmentation since we only display the surface and
the selected voxels. To help the users navigate
through the volume, a 2D section display is also
provided as shown in Figure 7. The sections are
continuously updated while the cursor is being
moved across the volume, so that the user can better
understand the internal structure of the volume to
apply the interactive operations to it.
Figure 6: Error correction problems. a) Original,
uncorrected segmentation error. b) Error corrected using
intensity criterion alone. Note the hanging voxels.
c) Topology is taken into account, but leaks occur.
d) Proper error correction.
The automatic skull stripping requires a lot of
processing power and it runs without supervision. It
produces hundreds of images, which should be
checked for correctness. The improved workflow of
the interactive checking and correcting skull-
stripped volumes is organized into the following
steps, repeated for every MRI scan produced:
a)
b)
Hanging
voxels
c)
d)
Propagation leak
Segmented surface
Overinclusion
3D VISUALIZATION AND SEGMENTATION OF BRAIN MRI DATA
115
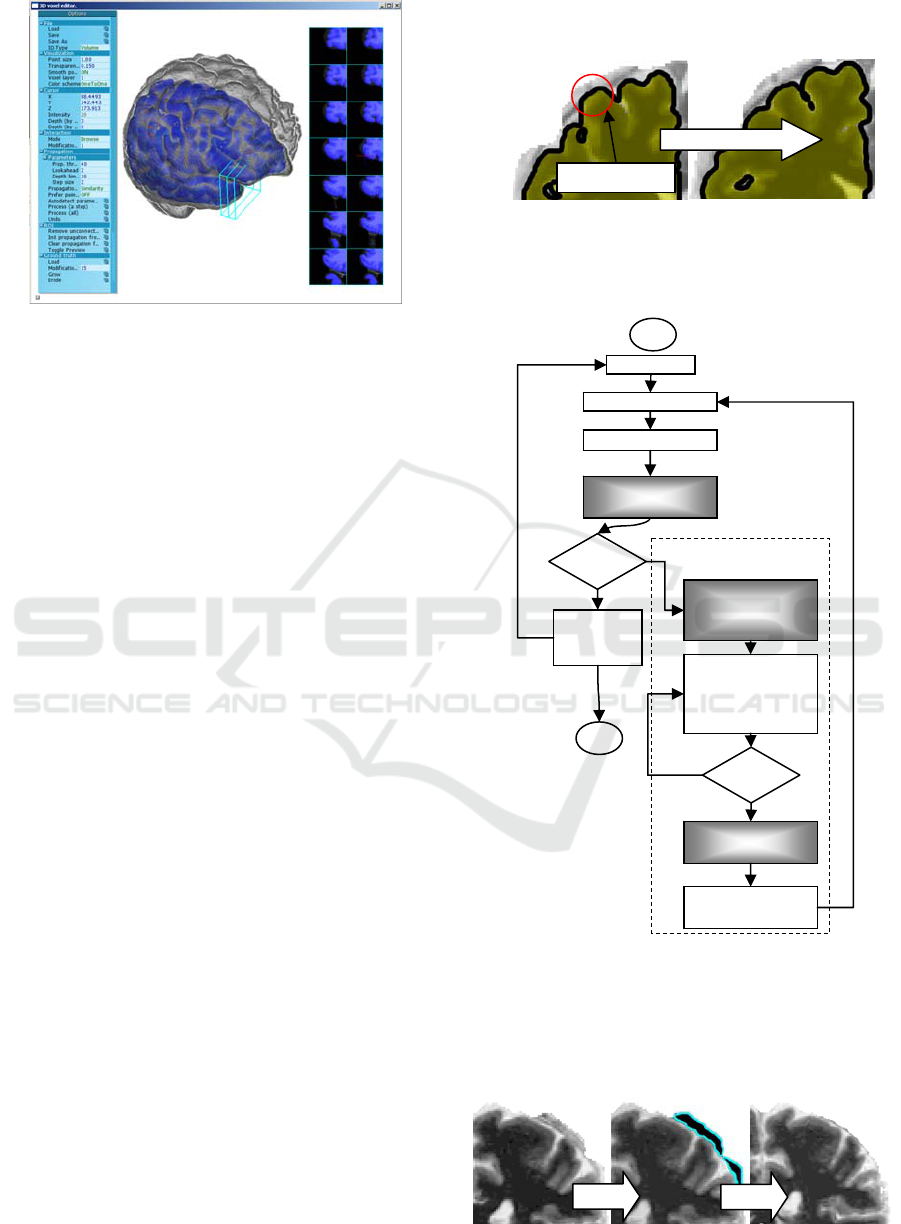
Figure 7: Application interface.
1. An MRI scan is loaded into the application and
the user can see the 3D surface of the brain
colored according to the average intensity of the
voxels located close to the surface.
2. A 3D surface generated by the automatic
approach is loaded and analyzed to highlight the
most probable problematic areas.
3. The user examines the pattern and scans
suspicious areas with the 2D section tool. If the
area indeed contains a segmentation error, the
user places a seed point there, using either the 3D
or the 2D section view.
4. Once one or a few seed points are selected, the
user initiates the propagation process, which
automatically attempts to select points similar to
the seed points. The automatically selected points
are prominently displayed with a different color.
The user monitors the process using the 2D
section view or the 3D transparent view, and
constantly checks that only invalid voxels are
selected. At any moment, the propagation can be
smoothly reverted.
The automatic process ceases when all further
propagations select only the valid voxels. The user
then removes all the automatically selected voxels
and scans for more segmentation errors to correct. If
the user realizes that some valid voxels are removed,
they can be recovered with the multilevel undo
function.
The erosion tool removes a layer of topmost
voxels from the mask in a selected location. The
operation can be repeated until the desired result is
obtained, as shown in Figure 8.
When the processing of the current data is
completed, it is saved in the same format as the
original data, and the next one is loaded into the
program.
Figure 8: Segmentation erosion.
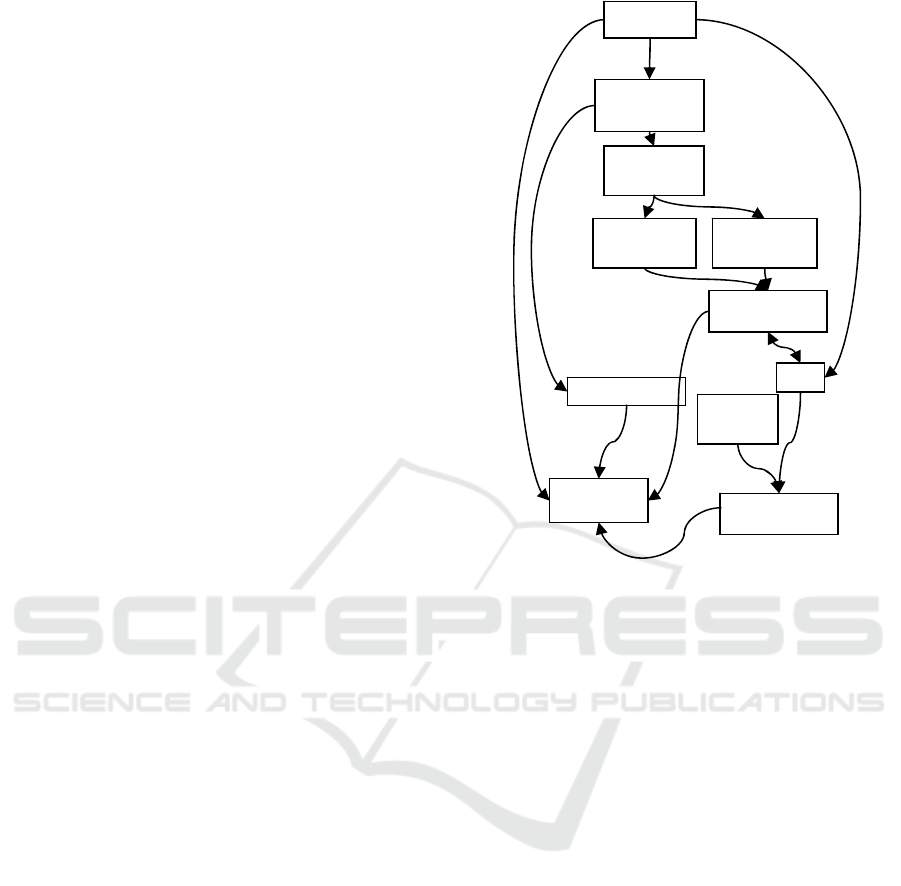
An overview of the application workflow
diagram is given in Figure 9.
Figure 9: Application workflow diagram.
Figure 10 shows 2D sections illustrating an
interactive session where a wrongly classified area
was corrected using the developed interactive semi-
automatic software tool.
Figure 10: The result of correction.
Interactive propagation
Load MRI
Generate hints
Visualize 3D image
User scans for error
areas
Found?
Save
corrected
se
g
mentation
User picks several
seed points from an
error area.
Propagate and select
points belonging to
the error area
Too much?
Undo until seed
points are correct
Update the
segmentation
Start
Done
Overgrown
automatically
generated
mask
Erosion area
Corrected result
GRAPP 2009 - International Conference on Computer Graphics Theory and Applications
116
4.3 Software Components
To provide the described workflow, the following
modules were required:
File I/O, for reading/writing MRI data, for
loading data to the volume storage, and writing data
as requested by the interface module
Interface module is based on a common library,
it provides OpenGL facilities, and processes
keyboard and mouse input.
Rendering module takes data from the volume
and point set storages and presents it to the user in a
predefined manner, according to the current cursor
position and camera orientation.
Volume storage tracks information on the current
state of the MRI image. It also stores volume undo
information.
Surface storage keeps track of a surface
generated by the automatic algorithm. It uses normal
criteria to determine where the automatic algorithm
failed.
Point set storage efficiently stores current
selection, surface points and colors, and it is a basis
for propagation.
Error criteria modules include depth, topology,
surface and intensity, for using in criteria evaluation
as described in Section 3.
Propagation module uses error criteria to
gradually change the point storage according to the
error criteria. Once instructed by the interface
module, it can perform undo, as well as application
of the current point set to the volume.
The module diagram of the application is shown
in Figure 11.
4.4 Performance
To judge about the success of a new segmentation
method, one has to compare its performance with a
traditional way of correcting the mistakes of
automatic algorithms.
Let us consider the defect shown in Figure 7. It
spans over 50 slices. Each slice takes around 10-15
sec to correct, which amounts to around 10-15
minutes per MRI file. Given 50 erroneous images
per batch, it would take more than 10 hours to
correct one batch. Our approach requires from the
operator on average 2 minutes to locate and remove
a similar defect, as illustrated in Figure 12.
Figure 11: Application modules.
Therefore, it provides an estimated 5-fold
productivity increase for the correction phase.
Extending the software to handle different
segmentation tasks would save even more time.
In some cases, initial automatic segmentation of
white matter has only slight defects which are easier
to correct than the mask itself. While we can correct
such minor voxel misclassification, it is still
necessary to remove non-brain voxels from the mask
in order to run the white matter surface estimation
algorithms reliably. We can replace the interactive
mask correction process with the combined
correction of the white and grey matters
segmentation, and then use the segmentation to
obtain the mask for the second automatic
segmentation run.
4.5 Implementation Platform
We have used C++ and OpenGL library for all the
rendering required in the project. The modular code
base with clearly abstracted platform-specific
modules allowed us to make the software cross-
platform, equally well supported on MACOSX,
Linux and Windows.
Interface
Propagation
module
Criteria
evaluation
Topology
criterion
Depth
criterion
P
o
in
t
sto
r
e
Rendering
IO
Volume store
Surface store
Surface
criterion
3D VISUALIZATION AND SEGMENTATION OF BRAIN MRI DATA
117

Figure 12: Interactive 3D control over segmentation
process. Circle shows where interactive focus point is
located.
5 CONCLUSIONS
Novel visualization algorithms developed
specifically for segmentation purposes have been
proposed along with a method for 3D interactive
correction of brain segmentation errors introduced
by the fully automatic segmentation algorithms. We
have developed the tool which is based on a 3D
semi-automatic propagation algorithm.
3D visualization of the misclassification hints
allows the user to focus attention on the problematic
areas and avoid working with individual slices
where it is not necessary.
The proposed semi-automatic method uses a
controlled propagation and allows for an efficient
correction of the segmentation errors. The proposed
software modules layout for the new interactive
segmentation and visualization methods will allow
for efficient development of advanced segmentation
tools in further research and improvement of the
initial software.
We have also proposed an efficient method for
hinting the user where a segmentation error might
occur. This is done by averaging several layers of
the image closest to the surface. This method is
simple to implement and provides satisfactory
results however it has high failure ratio and has to be
replaced with a more robust approach.
ACKNOWLEDGEMENTS
This project is supported by the Singapore
Bioimaging Consortium Innovative Grant RP C-
012/2006 “Improving Measurement Accuracy of
Magnetic Resonance Brain Images to Support
Change Detection in Large Cohort Studies”.
REFERENCES
Armstrong, C. J., B. L. Price, et al., 2007. Interactive
segmentation of image volumes with Live Surface.
Computers & Graphics 31 (2): 212-229.
Bazin, P.-L., Pham, et al. 2005. Free software tools for
atlas-based volumetric neuroimage analysis. Medical
Imaging 2005: Image Processing 5747: 1824-1833.
Boykov, Y. Y. and M. P. Jolly, 2001. Interactive graph
cuts for optimal boundary & region segmentation
of objects in N-D images. In International Conference
on Computer Vision, ICCV 2001, 1: 105-112.
de Bruin, P. W., V. J. Dercksen, et al., 2005. Interactive
3D segmentation using connected orthogonal
contours. Computers in Biology and Medicine 35(4):
329-346.
Falcao, A. X. and J. K. Udupa, 2000. A 3D generalization
of user-steered live-wire segmentation. Medical Image
Analysis 4 (4): 389-402.
Giraldi, G., E. Strauss, et al., 2003. Dual-T-Snakes model
for medical imaging segmentation. Pattern
Recognition Letters 24(7): 993-1003.
Hahn, H. K. and H.-O. Peitgen, 2003. IWT-interactive
watershed transform: a hierarchical method for
efficient interactive and automated segmentation of
multidimensional gray-scale images. Medical Imaging
2003: Image Processing 5032: 643-653.
Ibrahim, M., N. John, et al., 2006. Hidden Markov
models-based 3D MRI brain segmentation. Image and
Vision Computing 24(10): 1065-1079.
Kang, Y., K. Engelke, et al. 2004. Interactive 3D editing
tools for image segmentation. Medical Image Analysis
8(1): 35-46.
Rohlfing, T. and J. C. R. Maurer 2005. Multi-classifier
framework for atlas-based image segmentation.
Pattern Recognition Letters 26(13): 2070-2079.
Yushkevich, P. A., J. Piven, et al., 2006. User-guided 3D
active contour segmentation of anatomical structures:
Significantly improved efficiency and reliability.
NeuroImage 31(3): 1116-1128.
GRAPP 2009 - International Conference on Computer Graphics Theory and Applications
118
