
EVALUATING VISUALISATION AND NAVIGATION TECHNIQUES
FOR INTERPRETATION OF MRA DATA
B. W. van Schooten
1
, E. M. A. G. van Dijk
1
E. V. Zudilova-Seinstra
2
, P. J. H. de Koning
3
and J. H. C. Reiber
3
1
Human Media Interaction, University of Twente, Enschede, The Netherlands
2
Section Computational Science, University of Amsterdam, The Netherlands
3
LKEB, Leiden University Medical Center, The Netherlands
Keywords:
Volume visualization, 3D navigation, Radiology, MRA.
Abstract:
We argue that a more systematic treatment of the many existing options for medical volume visualisation is
desirable. We show that combining the most common medical visualisation and navigation techniques in a
systematic way leads to a meaningful set of interesting and sometimes novel UI techniques. We also propose
a technique for using generated data and tasks suited to non-medical users for conducting user experiments.
We evaluate the UI techniques qualitatively to arrive at a set of promising techniques for future research.
1 INTRODUCTION
The domain of magnetic resonance angiography
(MRA) involves computer-aided interpretation of 3D
(greyscale) volumes, using specialised visualisation
techniques. In this domain, user interfaces (UIs) are
still designed in a rather ad hoc way. There are few
comparative usability evaluations between different
visualisations, or evaluations taking a broader look at
for example navigation or editing techniques. We pro-
pose an experimental framework enabling more sys-
tematic experiments, including a taxonomy of medi-
cal interpretation tasks, and combinations of visual-
isation and navigation techniques, based on known
medical practice. The tasks we will focus are verifica-
tion of automatic analyses of blood vessels (Zudilova
and Sloot, 2005), in particular the vessel centerline (a
curved line going through a particular vessel), and the
vessel segmentation (a mesh describing the surface of
a particular vessel).
Medical experts and expert-annotated medical
data are hard to get, so we argue that using computer-
generated data and non-medical users greatly facili-
tates usability experiments. This approach is, how-
ever, only rarely found (Moise et al., 2005). We
designed an algorithm for generating vascular-like
structures and mock automatic analyses with artifi-
cally introduced errors. Tasks and data are simplified
so they can be performed by non-medical users.
2 THE FRAMEWORK
The framework can be subdivided into task, visuali-
sation method, and navigation method. We consider
the following subtasks:
• Interpreting the overall 3D structure and locating
a particular vessel in 3D space (overview).
• Viewing fine greyscale details at relevant lo-
cations around the centerline and segmentation
(greyscale).
• Seeing deviations of the centerline (deviate C)
and segmentation (deviate S) from the greyscale
data, indicating problem areas.
2.1 Visualisation
The most commonly used MRA visualisations are de-
scribed below; see also figure 1. First we have the
slice visualisations, only showing a slice of the data:
• Cross-section - shows the volume data that in-
tersects an arbitrary plane. One particular cross-
section that is often used is a close-up cross-
405
W. van Schooten B., M. A. G. van Dijk E., V. Zudilova-Seinstra E., J. H. de Koning P. and H. C. Reiber J.
EVALUATING VISUALISATION AND NAVIGATION TECHNIQUES FOR INTERPRETATION OF MRA DATA.
DOI: 10.5220/0001797804050408
In Proceedings of the Fourth International Conference on Computer Graphics Theory and Applications (VISIGRAPP 2009), page
ISBN: 978-989-8111-67-8
Copyright
c
2009 by SCITEPRESS – Science and Technology Publications, Lda. All rights reserved
section of the vessel at a particular point on the
centerline.
• CPR (Curved Planar Reformatting) (Kanitsar,
2004) - a curved cross-section following the cur-
vature of the vessel.
Secondly we have the volume visualisations
showing the entire volume:
• DVR (Direct Volume Rendering) (Mueller et al.,
2005). This involves rendering the volume as
a semi-transparent 3D object, representing the
greyscale values as densities. Various enhance-
ments exist, such as shading and colour mapping.
• Isosurface (Preim and Oeltze, 2007). This in-
volves converting the greyscale volume to a plain
mesh surface by connecting the points which have
a particular greyscale value. A lot of the data is
lost in this visualisation, however.
• MIP (Maximum Intensity Projection) (Preim and
Oeltze, 2007). This involves creating a 2D pro-
jection in which each pixel value is the bright-
est value found in a ray cast into the scene from
that point. Unlike DVR or isosurface, there is
no visual cue indicating which parts of the visi-
ble structure are in front or behind others.
Figure 1: Top left: CPR with centerline. Top right: DVR.
Bottom left: isosurface with segmentation and centerline.
Bottom right: MIP with centerline.
In cross-section and CPR, the centerline can be
shown by projecting it onto the slice plane, and the
segmentation is typically shown by only showing the
lines that intersect the slice plane. In the volume
views, both centerline and segmentation can be shown
in an obvious manner. Additionally, occlusion cues
can be used for displaying centerline and segmenta-
tion in some cases. Isosurface enables the easiest oc-
clusion cues, but they are also possible with properly
thresholded DVR.
It is also possible to combine multiple visualisa-
tions by integrating them into a combined visualisa-
tion. We came up with the combinations below (see
also figure 2). As far as we know, these combinations
form novel medical visualisation techniques, except
the volume-volume combination.
• Isosurface-slice - isosurface with any slice visu-
alisation as integrated 3D figure. To compensate
for the incompleteness of isosurface data, isosur-
face is integrated with a slice visualisation, draw-
ing the slice as an oriented plane in the 3D view.
• CPR-volume - CPR with any volume visualisa-
tion, with the volume view simply drawn over the
CPR. A particular centerline point is chosen for
which both views are made to coincide graphi-
cally. Additionally, the orientation of the 3D view
around the centerpoint is equal to that of the CPR.
• Volume-volume - any volume visualisation with
any volume visualisation. One visualisation is
drawn regularly, one or more others are drawn
as oriented planes inside the main visualisation.
For example, there may be three separate oriented
planes on the back faces of the cube surrounding
the rendered volume. This type of visualisation
is used by the QMRAVWI application (de Kon-
ing et al., 2003) developed at Leiden University
medical center (LUMC).
• Isosurface-DVR - isosurface with DVR as inte-
grated 3D figure.
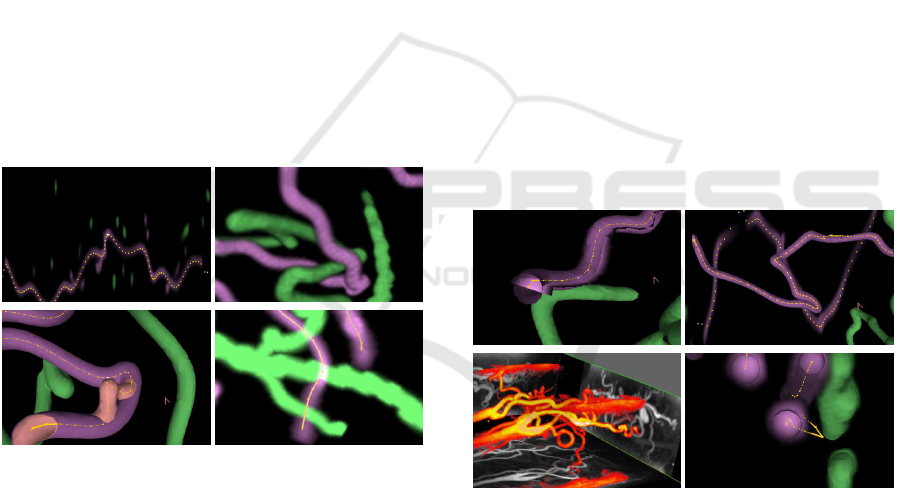
Figure 2: Top left: isosurface-slice (using CPR for slice).
Top right: CPR-isosurface. Bottom left: volume-volume
(DVR-MIP). Bottom right: isosurface-DVR.
2.2 Navigation
Designing appropriate navigation techniques can be
difficult and needs to be studied separately. For 2D
representations, navigation consists of panning and
zooming. For 3D representations, this includes 6 de-
grees of freedom (6 DOF) camera manipulation, plus
optional zooming. The 6 DOF can be separated into
3 DOF positioning and 3 DOF rotation.
We distinguish several common types of (posi-
tion) navigation:
GRAPP 2009 - International Conference on Computer Graphics Theory and Applications
406

Table 1: Table summarising all navigation types and their decomposition into different degrees of freedom. The valid types
are given in boldface. Legend: 1D, 2D, 3D: positioning in resp. 1,2,3 dimensions; rot: 3DOF rotation; axis: 1DOF rotation
around vessel axis. Note that zooming is possible and useful in all cases, and adds one extra DOF to the total.
visualisation → 3D cross-section CPR
position↓ rotation→ Free Centerline Flyby Flythrough (none) (axis)
Free 3D + rot not useful not useful not useful 2D 2D + axis
Centerline 1D + rot 1D + rot 1D + axis 1D 1D 1D + axis
Pickray 2D + rot pick confusing cannot pick cannot pick N/A N/A
1. centerline-based navigation: the user can cycle
through the points of the centerline forwards and
backwards. The view is centered around the cur-
rently selected centerline point (the focus point).
2. free navigation: The position can be determined
freely rather than being fixed to a centerline point.
3. pickray navigation: A coordinate is selected by
clicking on the centerline or vessel wall. The cam-
era will navigate to the selected point.
Rotation in 3D can be treated separately. There
are several obvious options:
1. free rotation angle
2. rotation angle always follows angle of centerline.
This is a relatively novel navigation technique for
MRA. We distinguish several variants:
• centerline: the user can freely specify a relative
rotation angle.
• flyby: the camera is perpendicular to the center-
line, looking at the vessel from “above”. This
orientation is less useful for isosurface-DVR
or isosurface-slice because the isosurface ob-
scures what is inside the vessel.
• flythrough: the camera is oriented parallel to
the centerline, and we zoom in close, like vir-
tual angioscopy (Giachetti et al., 2001). This
orientation is less useful for DVR or MIP.
We summarise all possible combinations of rota-
tion and position navigation in table 1. The table sum-
marises which ones are valid and potentially useful,
and how many DOF each requires.
3 RESULTS
Most combinations of the given visualisation and nav-
igation techniques form meaningful and sometimes
novel interaction techniques. We have made a qual-
itative assessment about the suitability of each com-
bination for each task, see table 2. For each visual-
isation, a rating was given in the range not possible
to excellent, and we summarise what kind of navi-
gation was necessary to perform the task. With help
of this assessment, we can select the most promising
techniques for future user experiments. Based on the
table, we conclude that the most promising visualisa-
tion techniques overall are isosurface-slice, volume-
volume, and CPR-volume.
ACKNOWLEDGEMENTS
This research is funded by the NWO/VIEW project
“A Multi-modal Visualization Environment for Inter-
active Analysis of Medical Data” (N 643.100.602).
REFERENCES
de Koning, P. J. H., Schaap, J. A., Janssen, J. P., van der
Geest, R. J., and Reiber, J. H. C. (2003). Automated
segmentation and analysis of vascular structures in
magnetic resonance angiographic images. Magnetic
Resonance in Medicine, 50(6):1189.
Giachetti, A., Tuveri, M., and Zanetti, G. (2001). Measur-
able models of abdominal aortic aneurysm on the web.
Stud. Health Technol. Inform., 81:158–160.
Kanitsar, A. (2004). Curved Planar Reformation for Ves-
sel Visualization. PhD thesis, Institute of Computer
Graphics and Algorithms, Vienna University of Tech-
nology, Favoritenstrasse 9-11/186, A-1040 Vienna,
Austria.
Moise, A., Atkins, M. S., and Rohling, R. (2005). Evalu-
ating different radiology workstation interaction tech-
niques with radiologists and laypersons. Journal of
Digital Imaging, 18(2):116–130.
Mueller, D. C., Maeder, A. J., and O’Shea, P. J. (2005). En-
hancing direct volume visualisation using perceptual
properties. In Proc. SPIE, Vol. 5744, 446, pages 446–
454.
Preim, B. and Oeltze, S. (2007). Visualization in Medicine
and Life Sciences, chapter 3D Visualization of Vascu-
lature: An Overview, pages 39–60. Springer Verlag.
Zudilova, E. V. and Sloot, P. M. A. (2005). Bringing com-
bined interaction to a problem solving environment
for vascular reconstruction. Future Gener. Comput.
Syst., 21(7):1167–1176.
EVALUATING VISUALISATION AND NAVIGATION TECHNIQUES FOR INTERPRETATION OF MRA DATA
407

Table 2: Table summarising all visualisations. Legend: Task type: C=centerline; S=segmentation. 3D cues: C=centerline
occlusion or S=segmentation occlusion. Navigation type: F=free, C=centerline-based, P=pickray. F=C means that F and C
are very similar. Rotation type: F=free, C=follow-centerline, B=flyby, T=flythrough. The indications (b) and (t) mean that
resp. the flyby and flythrough orientations are less useful. Note that good and excellent ratings are printed in boldface.
visualisation 3D cues navigation rotation
cross-section C – F=C – – – – –
overview: not possible
greyscale: fair; well visible but extensive centerline-based navigation required.
deviate: good; excellent for both C and S but extensive centerline-based navigation required.
CPR – – F=C – – – – –
overview: poor, rotation around vessel axis required
greyscale: good, rotation around vessel axis required
deviate C: excellent, error can be seen immediately as a veering away or gap in the vessel
deviate S: good, only for too-wide or too-narrow type errors, rotation around vessel axis required
DVR C S F C P F C B (t)
overview: fair, little navigation required
greyscale: fair, rotating and zooming required
deviate: fair, rotating and zooming required
isosurface C S F C P F C B T
overview: good, little navigation required
greyscale: not possible
deviate C: excellent, occlusion cues help see if the centerline is in front of or behind the vessel,
so little navigation required
deviate S: good if isosurface is representative of the segmentation location, rotating and zooming
required
MIP – – F C P F C B (t)
overview: fair, rotation required, sometimes hard to see what’s in front or behind
greyscale: fair, rotating and zooming required
deviate: fair, rotating and zooming required
isosurface-slice C S F C P F C (b) T Note: “slice” may be cross-section or CPR
overview: fair, little navigation required. For CPR, the slice plane may make visual scene harder
to interpret
greyscale: good. Requires close-up view and centerline-based navigation.
deviate C: excellent, occlusion cues help see if the centerline is in front of or behind the vessel,
so little navigation required
deviate S: good if isosurface is representative of the segmentation location, navigation required
CPR-volume C S – C – – – B – Note: “volume” is DVR, MIP, or isosurface
overview: fair to good, little navigation required
greyscale: good, navigation same as particular volume visualisation method
deviate: good to excellent, similar to CPR
volume-volume C S F C P F C B T Note: “volume” is DVR, MIP, or isosurface
overview: excellent, the cube backface projections help locate a point precisely, except when
zooming in closely.
greyscale: fair, rotating and zooming required
deviate: fair to excellent, inherits properties from both visualisation methods used
isosurface-DVR C S F C P F C (b) (t)
overview: good, little navigation required
greyscale: fair, though not as good as DVR by itself, rotating and zooming required
deviate: good, similar to isosurface, though not as good.
GRAPP 2009 - International Conference on Computer Graphics Theory and Applications
408
