
REMOTE RENDERING OF LARGE BIOLOGICAL DATASETS
Wolfram Schoor, R
¨
udiger Mecke, Udo Seiffert
Fraunhofer Institute for Factory Operation and Automation (IFF), Sandtorstrasse 22, D-39106 Magdeburg, Germany
Felix Bollenbeck and Uwe Scholz
Leibniz Institute of Plant Genetics and Crop Plant Research, Corrensstr.3, D-06466 Gatersleben, Germany
Keywords:
Remote visualization, Scientific data, Hybrid rendering.
Abstract:
This paper presents remote rendering technologies to support the analysis and information exploration of large
biological datasets. Reconstructed three-dimensional models and other data domains stored in a database are
the foundation for the visualization. Remote Rendering via a clients web interface enables a widespread access
to the data with interactive frame rates and high-quality rendering results without the demand of new client
hardware. Moreover, the rendering server has the capability to manage multiple independent or collaborative
sessions and has a very small bandwidth consumption over time.
1 INTRODUCTION
Remote Rendering commonly means interactive vi-
sualization of three-dimensional datasets via a client/
server architecture over a network. Visualization of
complex 3D models is still a task hard to accomplish
without specialized hardware. Furthermore, ad-hoc
visualizations over distance are playing a key role in
future visualization trends. One problem of visual-
ization is that huge amounts of data must be handled,
which requires not only a fast CPU and high memory
capacities (RAM), but also a high degree of graphics
output generated by modern graphics cards.
These drawbacks can be overcome by the concept of
remote rendering. The datasets are computed on a
rendering machine with high graphics capabilities -
the so-called server, and only rendered images are
sent to the working station - called clients.
The work presented here is motivated by a given
shortcomming regarding biological model visualiza-
tion, namely limited bandwidth, slow clients with
poor graphics capabilities, large biological 3D mod-
els and the demand to real-time interaction. The lat-
ter cannot be covered by existing conventional remote
rendering techniques. Therefore, a remote rendering
architecture with reduced network traffic generating
correct high-quality renderings for low level end user
PCs with interactive frame rates is given in this paper.
2 RELATED WORK
The idea of remote rendering is not new. Various re-
mote rendering applications have been developed in
the past. Adapted from (Schmalstieg and Gervautz,
1996), these techniques can be classified as follows:
Data
Visualization
Visualization
Rendering
Rendering
Display
Data
Visualization
Visualization
Rendering
Rendering
Data
Visualization
Visualization
Rendering
Rendering
Data
Visualization
Visualization
Rendering
Rendering
Display
Display
Display
Figure 1: Remote rendering types a) image-based, b) geom-
etry replication, c) immediate-mode, and d) hybrid.
Image-based. Rendering is performed by the sender,
and the resulting stream of pixels is sent over the
network as provided in (Scheifler and Gettys, 1986)
(see Figure 1 (a)).
Geometry-based. A copy of the geometric database
223
Schoor W., Mecke R., Seiffert U., Bollenbeck F. and Scholz U.
REMOTE RENDERING OF LARGE BIOLOGICAL DATASETS.
DOI: 10.5220/0001802102230227
In Proceedings of the Fourth International Conference on Computer Graphics Theory and Applications (VISIGRAPP 2009), page
ISBN: 978-989-8111-67-8
Copyright
c
2009 by SCITEPRESS – Science and Technology Publications, Lda. All rights reserved

is stored locally to be accessed by the rendering
process. The database can either be available be-
fore application start (kept on local hard disk), or
downloaded just before usage, such as VRML / X3D
browsers can do (Gueziec et al., 1999) (see Fig-
ure 1 (b)).
Immediate-mode Drawing. The low-level drawing
commands used by drawing APIs are issued by the
application performing the rendering. They are not
immediately executed, but sent over the network
as a kind of remote procedure call. The actual
rendering is then performed by the remote machine
(e.g. distributed GL (Shreiner et al., 2005)), see
Figure 1 (c).
Hybrid Rendering. In this approach a 3D geometry
as low resolution representation is rendered on the
client’s side and the server transmits images to
the client as well. The used mode depends on the
performed user action (computational vs. network
load) (Koller et al., 2004) or is dynamically adapted
to the available network capacities (see Figure 1 (d)).
Summarized, existing remote rendering tech-
niques cover a wide range of problem statements
including image-based remote renderings (suitable
for fast network connections) or geometry-based re-
mote renderings (e.g. cluster rendering with suffi-
cient client’s graphics hardware). Hybrid rendering
methods for their capabilities could be identified as
adequate rendering method for low and medium level
clients using networks with medium network speed.
3 SYSTEM DEMANDS
In this section the requirements of the involved under-
lying system architecture and its components as well
as special user interests are discussed. Main issues
are the individual clients’ hardware conditions in the
network, the data transfer capabilities and the trait of
scientific data.
Clients Condition. A medium-sized scientific bio in-
stitution with approximately 300 potential clients was
evaluated. The premises of these clients are com-
pletely heterogeneous, they cover a big inventory of
out-of-date machines
1
as well as a few state-of-the-
art hardware machines. The present operating sys-
tems are as diverse as the clients’ hardware condition.
Whereas the processor speed is widely feasible, the
graphics hardware is not. These preconditions have
to be taken into account in the design of a remote vi-
sualization application for large biological models.
1
e.g. Win98 Pentium III with less or equal 500 MB RAM
Server Condition. Two different server machines
could be used for testing the remote visualization per-
formance.
The first one is a high performance computer with
two Quad-Core Opteron 2.6 GHz, 16 GB RAM, a
Quadro FX 5600 graphics card and furthermore a
Tesla S870 processor with 500 GFlop and a shared
1 GBit connection (bottleneck) to the bio institution.
An average server upload B
up
of 2 MBit with average
ping rates t
avg
lesser than 23 ms could be identified
(σ
B
up
≈ 0.2 MBit, σ
t
avg
3 ms )
2
.
The second server is a minimal graphics server con-
figuration with a 2.8 GHz Pentium IV with 4 GB
RAM. The rendering job is done by one Nvidia 7800
GTX graphics card. This server is directly located at
the bio institution. The minimum network connec-
tion for this setup is bound to the local switches and
achieves 100 MBit.
Data Transfer. The data transfer capabilities are one
major aspect in the remote data visualization and can
be formulated regarding to Equation 1.
B ≥
(R
w
R
h
) C
depth
f n
c
f actor
(1)
Without any compression c
f actor
and for a screen
resolution R
w
xR
h
(XGA), a color depth C
depth
of
3 Bytes/pixel and a frame rate f of 26 frames/sec for
only one client n, this would require at least a band-
width B of:
B ≥
(1024 ∗ 768) pixel ∗ 3 Bytes/pixel ∗ 26 sec
−1
∗ 1
1
B ≥ 60 MByte/s (2)
which is still high and only possible with at least
1 GBit/s ethernet
3
(see example calculation in Equa-
tion 2).
Using JPEG compression can reduce the image size
by a factor c
f actor
of 10 − 300 (depending on the re-
sulting image quality) and will also work with slower
connections. The local network speed at the bio in-
stitution depends on the used switches and includes
100 MBit as well as 1 GBit connections. This fact
prevents a standard remote rendering strategy due to
the reason that high-quality renderings would not fit
into a 100 MBit connection if a couple of other users
share the same server connection (big n).
Data Resources. The biological data pool consists
of different data domains from biological material.
Available data include specifically microtome serial
section data, gene expression assays utilizing mRNA
2
average measured with http://speedtest.com
3
SXGA requires around 100 MByte/s.
GRAPP 2009 - International Conference on Computer Graphics Theory and Applications
224
in-situ hybridization (ISH) probing of histological
cross-sections as well as magnetic resonance spec-
troscopy measurements (
1
H-NMR) of caryopses at
different points in time. Other potential datasets, such
as macroarray gene expression data or metabolomic
assays by laser microdissection (LMD), could be inte-
grated into the database to enhance synergy and facili-
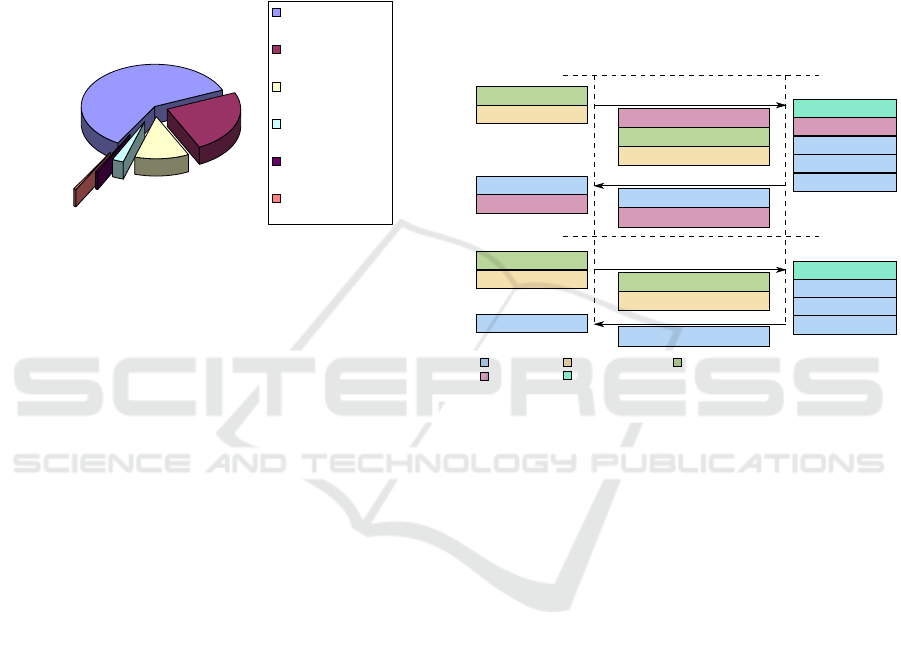
tate the inference of analysis results. Figure 2 presents
a pie chart breaking down the data distribution per
model.
Resources of data domains
24%
12%
60%
2%
1%
1%
Histological data
3-D surface data
In-situ
hybridization (ISH)
H-NMR
Macroarray gene
expression
Metabolic assays
Figure 2: Data distribution for one model, the absolute data
totaling around 9 GB.
Visualization Aspects. Another very important pre-
condition is the function volume of the remote ren-
dering application to develop. At the moment the bio
researchers test a software application which is es-
pecially tailored to them, namely the BioVizIt appli-
cation. This software is initially a single-user stand
alone application, which is not network compatible
but covers the rest of the desired functionality.
All these features and actions have to be con-
sidered as part of the resulting remote rendering
application to best possibly support the biologist’s
work.
As conclusion, there are different possibilities to
perform remote visualization tasks as proposed in
Section 2. As possible candidates only those solutions
are appropriate which meet the requirements (recall
Section 3).
As solely remote rendering approach which fits the
system requirements a hybrid rendering approach is
applicable. Due to the specific visualization require-
ments depicted in this section a conception with an
explicit control to data exchange mechanisms and
adaption possibilities of the visualization is necessary.
A solution to achieve this is to extend the existing
BioVizIt application with specific hybrid remote ren-
dering capabilities.
4 THE HYBRID REMOTE
RENDERING APPROACH
In the following, the remote visualization concept is
presented, where a hybrid rendering approach is the
basis. Furthermore, the architecture’s adaptions of the
BioVizIt platform, referring to network compatibility
and approaches addressing limited bandwidth, are de-
scribed.
Hybrid Rendering. The following Figure 3 illus-
trates the idea of the hybrid approach.
Rendered image
Client
Server
Datasets' names
(Scene graph changes)
Camera position and orientation
Rendering scene
Loading data sets
Creating session
Restoring session
Rendered image
(Scene graph changes)
Camera position and orientation
Resizing image
Compressing image
Rendering scene
Resizing image
Compressing image
Displaying image
Navigation
Modifying scene graph
Displaying image
Navigation
Modifying scene graph
Initial rendering request
Consecutive image requests
Image related Scene graph related
Viewpoint related
Session related
3D related
Reduced 3D dataset
Loading LOD model
Figure 3: Sequential diagram of the proposed hybrid ren-
dering approach.
In the beginning of the rendering process (initial ren-
dering request) a request with datasets’ names and
initial settings is sent to the server. As a result, the
server application is loading the requested file from
the database, and in addition a low resolution 3D ge-
ometry model (level of detail also LOD) is transferred
to the client. For optimization purposes the same ge-
ometry model is loaded only once. Moreover, the
graphics server submits the first remote-rendered im-
age to the client.
If in the following, user navigation is performed (con-
secutive rendering requests), the local 3D model is
rendered by the client itself. Fast movements can be
achieved without having performance problems due
to network limitations. The local 3D model can be re-
duced up to one per mill of the original 3D model’s
data amount. Even if the bandwidth is less than
10 MBit an initial loading delay for an unoptimized
data transfer of 4 seconds for the complete low reso-
lution model would be acceptable to the user, if after-
wards a stable real-time interaction can be performed.
In case of stopping the navigation or changing the
scene graph for example, a command is immediately
sent to the server (containing at least the new camera
REMOTE RENDERING OF LARGE BIOLOGICAL DATASETS
225

position and orientation) to request a new rendered
image. This approach ensures real-time model inter-
actions with a high-quality rendering result during the
model exploration.
Geometry Submission: The server stores the informa-
tion of the original 3D models and also in coarser res-
olutions (LOD). Datasets are generated according to
the proposed technique in (Schoor et al., 2009).
If a dataset is requested, the original dataset is loaded
into the server application. At the same time a low
resolution model is transferred from the database to
the client.
Image Submission: The image submission by demand
is a concept to overcome the server network load. Ad-
ditionally, image compression algorithms JPEG2000
(Taubman and Marcellin, 2001) are used to reduce the
network traffic.
Network Interconnect. Another important aspect
besides the underlying data transfer per se is how the
data will be transported. To achieve high resolution
rendering results on the client, only a reliable data
transfer method is an option. This excludes for ex-
ample UDP data transfer, because in this mode the
correct rendering result is not warranted due to un-
ordered or lost packages. The Transmission Control
Protocol TCP is sufficient for the required purposes.
Adaption of the BioVizIt Platform. For an ex-
tension of the existing solution as server variant the
functionality must be appended to network and ses-
sion routines. Multiple network connections through
clients must be promptly accepted and processed, us-
ing multi-threading techniques. User events are reg-
istered in a message queue. This queue is held in
the operating system and members of the queue are
passed to the application (for example panning the
window). Received messages by the application are
then handled in a procedure of the primary thread. To
avoid blockages in the processing of this thread, a new
thread – the “server thread” – is generated during the
program start to wait for new client requests via TCP.
If a client connects to the server over a predefined
port, a new “client thread” is generated immediately
for this client. This thread is responsible for further
communication with the client.
The client thread reads the request from the server’s
socket thread and interprets it through the HyperText
Transfer Protocol (HTTP). By accessing a virtual doc-
ument, additionally the document area of the HTTP
request is used, which includes the remote rendering
control commands of the client for the server. These
commands are processed sequentially.
At the end of this processing the client is enqueued to
a list, which contains clients awaiting an image syn-
thesis step.
5 RESULTS
In this section, the essential aspects of the implemen-
tation are presented. Key issues for remote visualiza-
tion are examined regarding the presented approach.
Latency of Network. The latency at the beginning of
a session depends on how the geometry transmission
is handled. The coarse 3D model can first be accessed
after full model upload. This can take a few seconds
for the geometry transmission. This is an initial step
which is only performed once a model is loaded. Af-
ter that, the interaction is performed with latencies
< 30 ms due to local rendering. The server render-
ing result takes less than 1 s after the mouse button is
released (indicating the end of user navigation).
Graphics Performance. The graphics performance
of the client rendering stage depends on its hardware
and on the level of detail in which the 3D model was
submitted. For the tested application even on a Pen-
tium III client a coarse 3D model with 20,000 points
could be interactively visualized. During the obser-
vation of the model no rendering step is required (no
model interaction). That means that a real-time appli-
cation can be guaranteed for the model interaction.
Network Throughput. The network throughput per
high resolution image request (> 3-5 s) is equivalent
to the physical size of this image and corresponds to
approximately 300 kB. The geometry transfer per low
resolution 3D model is approximately 4-5 MB in size.
Scalability. The approach provided here has a good
scalability. The rendering of scenarios, such as de-
scribed in Section 3, can be accomplished on graphics
servers without problems with interactive frame rates
(Case 2: minimum graphics server solution). That
means, in the worst case
4
the remote rendering image
of the last handled client will be displayed with an ad-
ditional delay of approximately 1 s if the data transfer
is ignored. This is the theoretical maximum number
of users which can be handled by the server under the
assumption that a delay of more than 2 seconds is not
acceptable to users. Taking the 100 MBit connection
as lower bound for the data channel, more than 40
clients can request a full resolution image at the same
time without causing additional delay at a client sta-
tion. Assumed that a 2 MBit connection is the average
connection condition for the server case 1, and a full
image resolution is requested, only one client request
per second is possible without causing an additional
delay on the client.
Error Recovery. The error recovery is automatically
performed by the network protocol layer (TCP) which
provides explicit error corrections. Furthermore, a
4
e.g. a synchronous server request of 25 clients
GRAPP 2009 - International Conference on Computer Graphics Theory and Applications
226

transmission control and data ordering is also part of
this protocol.
Network Burst. In general, the failure of a network
connection in the beginning of a work session leads to
an insufficient remote visualization. During the ses-
sion a temporary burstiness of the network connec-
tion in the time scale of seconds can be bridged with-
out problems due to the local downsampled version of
the 3D model. A loss of connectivity within a larger
time range disallows a practical use of the here pro-
vided technique due to the missing detail information
the remote-rendered image provides.
Security Issues. The data pool of plant biological
data consists of confidential information. Even an
internal use must contain at least a simple protec-
tion mechanism due to project internal information.
Therefore, a simple login query was integrated to
authenticate the users with respective project rights.
Furthermore, each session on the remote visualization
server is initially hidden to other users.
Balance between Local/Remote Resources. The ar-
chitecture of the hardware at the scientific institution
is naturally very heterogeneous. A uniform strategy
to extensively use clients’ hardware is therefore not
applicable. As the least common denominator, a low
resolution 3D model, which is tailored to the actual
hardware conditions, is used at the clients’ side to
achieve real-time interaction.
Hardware/Software Incompatibility. The visual-
ization software is written in C++ and uses only
platform-independent libraries. The visualization ser-
vice tests for hardware premises, if specific features
are not supported by the server hardware, alterna-
tively CPU-based implementations exist (e.g. defor-
mation model). The client’s visualization front-end
uses a platform-independent web interface, based on
Java
R
Version 1.5, Java 3D
TM
.
Figure 4 shows a screenshot of the provided web in-
terface and the visualization options.
Figure 4: Screenshot of the clients web interface showing a
reconstructed model of a caryopsis with clipping plane.
6 CONCLUSION AND OUTLOOK
In this paper a remote rendering approach was pre-
sented, which is applicable to medium-sized enter-
prises who have to deal with a large amount of sci-
entific data. With a minimum of effort and the use
of existing hardware this approach allows to visual-
ize, explore and modify data. The clients hardware
constitution must not be state-of-the-art which makes
this approach of visualization furthermore attractive
in a financial manner. The network bandwidth could
be identified as limiting constraint respective to the
number of clients contemporaneously used, therefore
the local server with the minimal graphics configura-
tion (case 2) is to prefer.
If the remote rendering application will be used with
many users (> 30), the aid of more than one render-
ing machine can be useful. In the next term a larger
focus will be placed on data modification possibili-
ties. Another point is the popping effect which occurs
by switching between the local LOD and the server
image. This effect is not so perturbing as occurring
in dynamic scenes. Anyway, a fading of the rendered
image can reduce this effect.
This research work is being supported by the BMBF
grants 0313821B and 0313821A.
REFERENCES
Anhøj, J. (2003). Generic design of web-based clinical
databases. Journal of Medical Internet Research,
5(4):e27.
Gueziec, A., Taubin, G., Horn, B., and Lazarus, F. (1999). A
Framework for Streaming Geometry in VRML. IEEE
Computer Graphics and Applications, 19(2):68–78.
Koller, D., Turitzin, M., Levoy, M., Tarini, M., Croccia, G.,
Cignoni, P., and Scopigno, R. (2004). Protected inter-
active 3d graphics via remote rendering. ACM Trans.
Graph., 23(3):695–703.
Scheifler, R. W. and Gettys, J. (1986). The X window sys-
tem. ACM Trans. Graph., 5(2):79–109.
Schmalstieg, D. and Gervautz, M. (1996). Demand-driven
geometry transmission for distributed virtual environ-
ments. Computer Graphics Forum, 15(3):421–431.
Schoor, W., Bollenbeck, F., Weier, D., Weschke, W., Preim,
B., Seiffert, U., and Mecke, R. (2009). VR-Based Vi-
sualization and Exploration of Plant Biological Data.
JVRB. submitted.
Shreiner, D., Woo, M., Neider, J., and Davis, T. (2005).
OpenGL(R) Programming Guide: The Official Guide
to Learning OpenGL(R), Version 2 (5th Edition)
(OpenGL). Addison-Wesley Professional.
Taubman, D. S. and Marcellin, M. W. (2001). JPEG
2000: Image Compression Fundamentals, Standards
and Practice. Kluwer Academic Publishers, USA.
REMOTE RENDERING OF LARGE BIOLOGICAL DATASETS
227
