
PARAMETERIZATION OF SAMPLES FOR MODELING OF
LASER BURNING
Increasing the Lifelikeness of Synthetically Generated Samples
Jana Hájková and Pavel Herout
Department of Computer Science and Engineering, University of West Bohemia, Univerzitní 8, Pilsen, Czech Republic
Keywords: Parameterization, Sample Generation, Pulse Approximation, Roughness, Laser Simulation, Concentric
Waves, Perlin Noise Function, Distortion.
Abstract: This paper describes methods for the generation of samples in modeling burning by a laser beam. In the first
part, it briefly informs about real data set and the way of approximation of real samples by mathematically
described smooth surfaces. In the main part, the paper focuses on methods which can be used for increasing
the lifelikeness of the result of the sample generation process for simulation purposes. Finally, the results
are summarized and the future plans are outlined.
1 INTRODUCTION
The work described in this paper is a part of a larger
project that deals with laser burning control and
simulation of laser burning process. We are
interested in processing the measured data, its
visualization and laser burning simulation. For our
work, we use real samples burned by a laser and
measured by a confocal microscope. The means of
data acquisition process is described in (Hájková,
2008).
All measured samples are represented in the
form of a height map. As a part of data processing,
we are going to find a set of parameters that would
define a mathematical function approximating the
shape of the pulse optimally and to get a
parametrical description of the sample roughness in
all its areas. The parametrical description could be
used as a part of the sample simulation process.
First, we generate the basic shape of the pulse. Than,
to get more realistic results, the basic smooth surface
can be further adjusted by using methods for a
random surface modification described in this paper.
1.1 Data Description
As mentioned in the introduction, the description of
each measured real sample is stored in the format of
a height map. This height map is formed by a matrix
of real numbers, which express the heights of
intersection points in a uniform rectangular grid. The
whole data set consists of samples with a defined
number of laser beam pulses burned by a laser into a
single point in the material.
To get a better imagination about the appearance of
a sample, see
Figure 1, where an example of a sample cross-
section is shown. It contains several typical features,
which result from the burning process and the
character of used material.
Figure 1: A typical cross-section of a sample.
During the burning process, the surface of the
material is exposed to an intense pulsed laser beam
that causes a rapid rise in local temperature. The
surface is warming up and the material starts to
ablate. The material, which is ablated, redeposites
around the irradiated area and damages the
surrounding material (Dahotre et al., 2008). Finally,
at the exposure site, a pit with a transition ring
around it is left behind. An example sample (100
283
H
´
ajkov
´
a J. and Herout P. (2009).
PARAMETERIZATION OF SAMPLES FOR MODELING OF LASER BURNING - Increasing the Lifelikeness of Synthetically Generated Samples.
In Proceedings of the 4th International Conference on Software and Data Technologies, pages 283-286
Copyright
c
SciTePress
laser pulses burned into a single point in steel) in 3D
view can be seen in Figure 3a.
The central part of the pulse (i.e., the area
directly irradiated by the laser beam) is smooth and
the bottom of the pit is a little bit rougher (Figure
2a). The most ragged surface part is the transition
ring. The surface is modulated by some concentric
waves that are both regular and irregular (Figure 2b).
Sometimes, local defects with a considerable
roughness can appear, especially at the outer border
of the transition ring (Figure 2c). At the outer
border, the roughness declines slowly and fades into
the roughness of the bulk material. All these facts
should be taken into account if we want to generate
a realistically looking surface of a laser-burned
sample.
a) b) c)
Figure 2: Examples from different parts of a typical
sample surface.
1.2 Sample Shape Approximation
As described in (Hájková, 2009), the basic shape of
a sample can be approximated by a smooth surface
defined by mathematical functions which
approximate the pulse pit by an elliptical paraboloid,
and the pulse transition ring by the top half of a
parabolic elliptic torus. An example of a real sample
and its approximation can be seen in Figure 3.
a) b)
Figure 3: An example of the sample approximation by a
smooth surface.
To obtain the most realistically looking sample,
surface the generated surface should be further
modified and some roughness should be added.
2 ROUGHNESS GENERATION
If we burn the same sample twice into different
places, it will never be the same, because at least the
surface of the basic material differs. That is why we
have to enhance the sample generation with random
features such as noise or various defects to get more
realistic results. These features and the methods how
to generate them are described in the following
subsections.
2.1 Perlin Noise Function
As can be seen in Figure 3, the mathematically
generated sample is too smooth in comparison with
the real one. That is why it is necessary to modify a
generated surface by some kind of artificial defects
that would represent the granularity of the material
and the roughness of different parts of a real sample.
One of the possible solutions is to use the Perlin
noise function (Perlin 1985), (Perlin, 2002). The
Perlin noise function has a very wide range of
application, not only in the computer graphics, but
also in many other areas, where natural appearance
is required.
Perlin noise combines a noise function with an
interpolation function. The noise is formed by
randomly generated values the distance of which is
given by some frequency. This frequency is defined
as 1/wavelength, where the wavelength represents
the distance from one generated value to the next
one. The generated values are interpolated using the
Hermit interpolation (Žára et al., 2005) to get a
smooth interpolating curve (with given amplitude
and frequency). If we sum up several curves (called
octaves) with various frequencies and amplitudes,
we get the final Perlin noise function. An example of
1D octaves can be seen in Figure 4. The frequency
ranges from 1 to 32, the amplitude is the same for all
octaves.
a)
b)
c)
d)
e)
f)
Figure 4: Octaves that are added to the final 1D Perlin
noise with the same amplitude and different frequencies:
a) 1, b) 2, c) 4, d) 8, e) 16, f) 32.
For the modification of the generated smooth
material surface, we need the 2D Perlin noise. A
different number of octaves can be added into the
final 2D noise or various amplitudes can be used.
Several examples of the final 2D Perlin noise are
shown in Figure 5.
ICSOFT 2009 - 4th International Conference on Software and Data Technologies
284

a)
b)
c)
d)
e)
f)
Figure 5: 2D Perlin noise after summing up 6 noise
functions with different amplitudes. Amplitude of each
following octave is a) the same; b) half; c) quarter the size.
d-f) Perlin noise generated according to three different
amplitude vectors.
It is evident that the variability of the Perlin
noise function is high and so we can use it for the
realistically appearing samples generating.
Perlin noise can be used several times during the
process of pulse generation. The result depends on
the used parameters. The first case, where the Perlin
noise can be used, is the generation of the roughness
of the pit bottom. The roughness is generated
according to the noise amplitude vector. A real
sample (100 laser pulses burned into steel) is shown
in Figure 6a, an example of the Perlin noise
modulated surface of the ideal pit can be seen in
Figure 6b.
a) b)
Figure 6: a) The pit of a real sample; b) Perlin noise
modulated on the surface of the ideal pit.
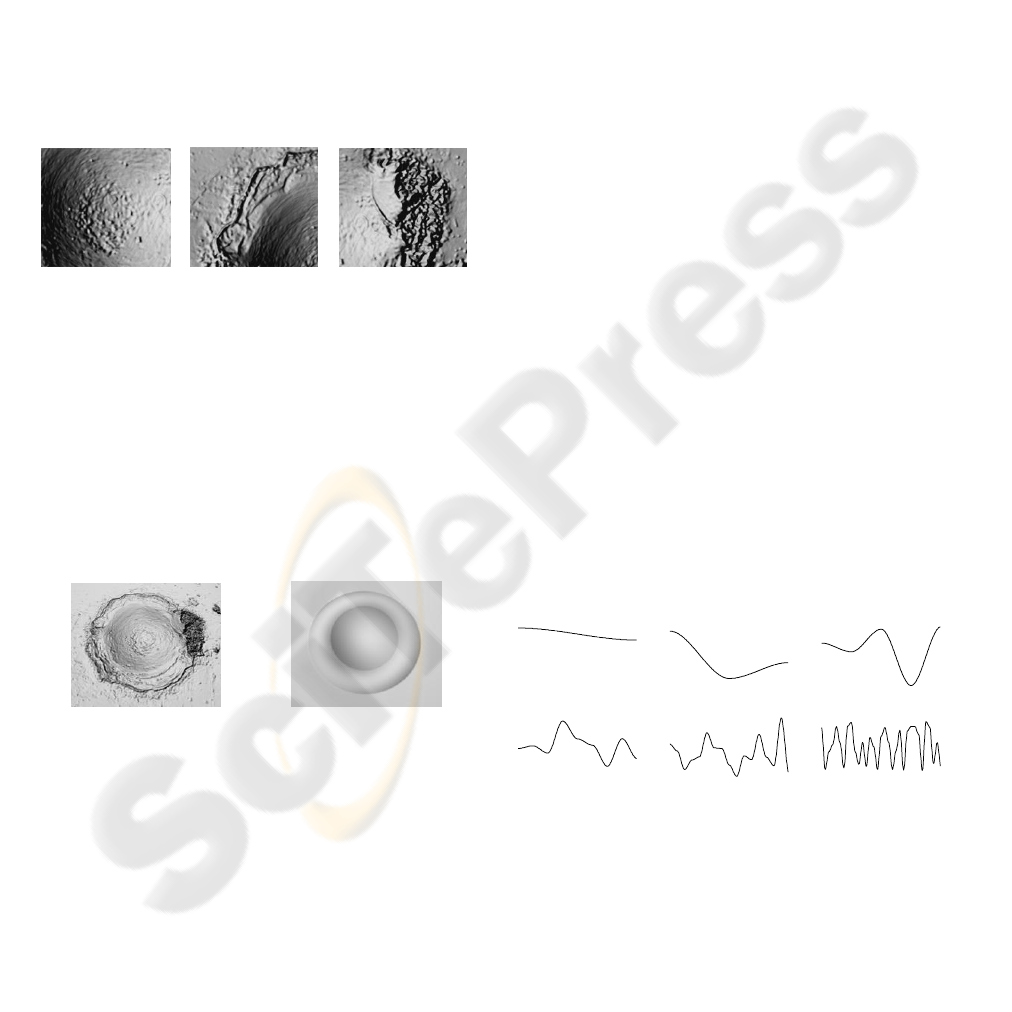
Another area where the usage of the Perlin noise
is appropriate is generating the transition ring, or to
be more precise, some local defects on it. To get a
better imagination how the generated surface looks
like, compare the 3D surface of the real local defects
in two samples in Figure 7a,b and the surface
generated by the Perlin noise in Figure 7c.
For the sample generation, we need to form
several smaller areas representing the local defects.
For this purpose we can also use the Perlin noise. At
the beginning, we generate a mask of the transition
ring (see Figure 8a). Then, we generate another
mask representing the basic shape of the thresholded
Perlin noise (Figure 8b). If we make an intersection
of both masks, we get the result mask shown in
Figure 8c. This result mask serves for the
modulation of the Perlin noise described above
(Figure 8d). To get a more realistic appearance, the
original shape of the transition ring mask could be
slightly changed by a distortion.
a) b) c)
Figure 7: a, b) Local defects in two different samples;
c) surface generated by the Perlin noise.
a) b)
c) d)
Figure 8: a) Mask of the transition ring; b) mask of the
local defect areas; c) intersection of both previous masks;
d) final result after the generation of local defects.
2.2 Waves Modulation
In the real samples, concentric waves are visible in
the area of the transition ring (as shown in Figure
2b). These waves are especially noticeable on the
outer border of the ring, they are relatively thin and
sometimes even discontinuous. Their shape consists
of a number of edges which approximately form an
elliptical shape.
If we want to generate a wave, we have to know
several parameters for its description, e.g. its
diameter, width, height or segmentation. The
segmentation is determined with the set of points
forming a line segment. All line segments are
converted to an arc plane with the given width and
height.
In the real samples more than one wave can often
be recognized. Examples of 20 and 30 waves
modulated on the smooth sample surface can be seen
in Figure 9.
PARAMETERIZATION OF SAMPLES FOR MODELING OF LASER BURNING - Increasing the Lifelikeness of
Synthetically Generated Samples
285

a) b)
Figure 9: Examples of a) 20 and b) 30 waves modulated
on the smooth sample surface.
3 RESULTS
If we put all the generated parts together, we obtain
the final sample. For the basic material, the surface
of the measured real sample is used. Than, the basic
shape of the pit is computed and its bottom is
modified by the Perlin noise. After that, we can
generate the transition ring. Its basic shape is
computed, the masks for the ring and the Perlin
noise are created and then used for its modification.
Results can be seen in Figure 10. The original
samples with 10, 50, and 100 laser pulses burned
into steel are shown are placed in the left column.
They can be compared with the results of the pulse
generation, which are placed in the right column.
a)
b)
c)
Figure 10: Real and generated samples: a) 10; b) 50;
c) 100 laser pulses burned into a single point in steel.
4 CONCLUSIONS
This paper describes methods for the roughness and
noise generation. They serve for increasing the
lifelikeness of samples which are synthetically
generated based on the parameters gained from the
real measured data. This can be used as a basic
approach for the laser burning process simulation.
The set of parameters consists of the parameters
describing the pulse basic shape (such as its inner
and outer border diameters, its depth or the maximal
height of the transition ring) and of several
parameters for the roughness description (such as
amplitude vectors for the Perlin noise, waves
parameters, etc.).
The majority of parameters have to be obtained
automatically to ensure the self-contained data
processing. Some parameters depend on the used
material and the others are typical for a particular
number of laser pulses burned into a single point. As
can be seen in Figure 10, the present results look
very well and the improvement of the generating
process automation is one of the tasks we want to
work on in the future.
ACKNOWLEDGEMENTS
This work was supported by the Ministry of
Education, Youth and Sport of the Czech Republic
“University specific research – 1311”.
REFERENCES
Dahotre, N. B., Harimkar, S. P. 2008. Laser Fabrication
and Machining of Materials, Springer, New York,
USA.
Hájková, J., 2008. Methods of Pulse Detection in Laser
Simulation, Proceedings of the 3rd International
Conference on Software and Data Technologies
ICSOFT 2008, ISBN: 978-989-8111-57-9, pp 186-
191, Porto, Portugal.
Hájková, J., 2009. Parameterization of Laser Burned
Samples and its Usage in Data Description and
Simulation, in preparation. accepted to 23
rd
European
Conference on Modeling and Simulation ECMS2009,
Madrid, Spain, 2009.
Perlin, K. 1985. An Image Synthetizer, Proceedings of the
12th annual conference on Computer graphics and
interactive techniques, ISBN: 0-89791-166-0. ACM
New York, USA, pp. 287-296.
Perlin, K. 2002. Improving noise, Proceedings of the 29th
annual conference on Computer graphics and
interactive techniques, ISBN: 0730-0301. ACM New
York, USA, pp. 681-682.
Žára, J., Beneš B., Felkl P. 2005. Moderní počítačová
grafika, ISBN 80-251-0454-0. Computer Press, Brno,
Czech Republic.
ICSOFT 2009 - 4th International Conference on Software and Data Technologies
286
