
ROBUST VOICE ACTIVITY DETECTION BASED ON PITCH
AND SUB-BAND ENERGY
Zhihao Zhang and Jinlong Lin
School of Software and Microelectronics, Peking University, Beijing 100871, China
Keywords: Voice activity detection, Pitch, Sub-band energy criteria.
Abstract: A new Voice Activity Detection (VAD) method is proposed to track the various background noises and it
can be robust in both stationary and variable noise environments. Many previous VAD methods assume that
the background only contains certain kinds of noises, so they could not deal with the noise in practical
applications efficiently. In proposed approach, determinate speech, determinate noise and potential speech
regions are defined. The first two regions are located with extracted pitch contour information and the
ambiguous region will be further retrieved using updated thresholds of sub-bands energy in obtained
determinate noise’s frequency domain. Experiments are carried out with an exhaustive comparison to three
standard VAD methods: G729b, ETSI AFE and AMR. The result shows that our approach has a more
robust performance than others in the real circumstances.
1 INTRODUCTION
Voice Activity Detection (VAD) is defined as a
procedure to separate speech from silence, noise and
other non-voice segments. Since it can not only
facilitate the speech processing but also increase the
performance of most recognition applications, VAD
has become an essential front-end processing step
for various speech signal processing systems, such
as speech recognition (L. Karray & A. Martin, 2003),
speech coding (ITU-T, 1997) and speech
communication (Syed W.Q. & H. Wu, 2007).
The important status of VAD system for speech
signal processing attracts more and more researchers
to pay attention on it. In the early developed VAD
algorithms, zero crossing rates (ITU-T, 1997), linear
predictive coding coefficients, energy thresholds (K.
Woo et al., 2000) and statistical model have been
used. The Standard VAD methods G729b (ITU-T,
1997) proposed by International Telecommunication
Union ITU, Advanced Front-End: AFE (ETSI, 2007)
and Adaptive Multi-Rate: AMR (3GPP, 2001)
introduced by European Telecommunication
Standards Institute ETSI are used on speech coding
and communication. They can achieve a high speech
detection hit rate, but the non-speech detection does
not efficiently perform as well, especially in the
variable background noises. Recently, the method
(Syed W.Q. & H. Wu, 2007) based on an adaptive
threshold related to the Signal Noise Ratio (SNR) is
proposed. This method can well track the variable
white noise, babble noise and vehicular noise
respectively, but it has a limited test on the voice
detection with practical data. A harmonic plus noise
model VAD has been introduced in (E. Fisher et al.,
2006), which presented a new pitch tracking
algorithm. However, the complex computation of
this method makes it hard to use in the real-time
applications. Based on the available methods, we
find that it is hard to find a robust VAD method
which can achieve real-time performance on both
speech and non-speech detection under the complex
situation.
This paper presents a new robust real-time VAD
method that can track the noise in real world
efficiently. Harmonics, pitch value and sub-band
energy criteria are introduced to locate the speech
region and track time-varying noise respectively
without training time. Firstly, most vowel segments
which named determinate speech region can be
detected by pitch measurement. Then, sub-band
division and energy thresholds from determinate
noise region are updated to retrieve the left voiced
parts in the potential voice region.
This paper is organized as follows: Section 2
presents the principles and framework of proposed
method. In Section 3, pitch measure enhancement
44
Zhang Z. and Lin J. (2009).
ROBUST VOICE ACTIVITY DETECTION BASED ON PITCH AND SUB-BAND ENERGY.
In Proceedings of the International Conference on Signal Processing and Multimedia Applications, pages 44-48
DOI: 10.5220/0002221000440048
Copyright
c
SciTePress
are described to find the determined speech part.
The detailed descriptions to explore the left voiced
part from potential speech region using sub-band
energy method are given in Section 4. Section 5
illustrates compared experimental results with three
standard VAD methods. Finally, conclusion is given
in the last Section.
2 PROPOSED FRAMEWORK
2.1 Principles of Proposed Procedure
The basic principles of proposed algorithm which is
referenced from (X.J. Yang & H.S. Chi, 1995) are
employed in our method as following: First, vowel
phoneme is an absolutely necessary part in every
word for almost all languages. Second, it has been
proved that vowel has the periodic nature, while
most noise and consonant lack of that periodicity
due to their inherent characteristics. Therefore, if no
pitch can be detected during a certain long time, a
determinate noise region must be contained in this
period. Third, the appearances of speech will
increase the energy of signal in either low frequency
or high frequency.
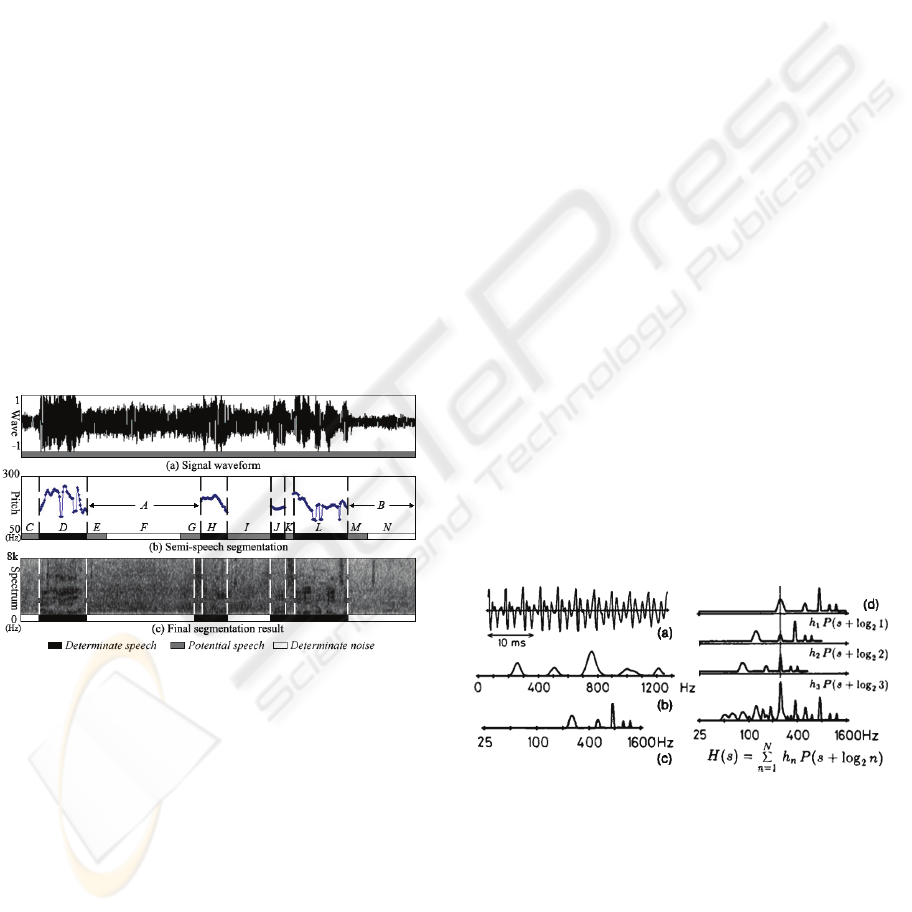
Figure 1: Example of proposed procedure.
2.2 Framework of Proposed Procedure
Based on the principles above, the detailed
framework of our approaches is described below:
The signal waveform is showed in Figure 1(a).
Firstly, pitch values are extracted frame by frame
until the first interval A without pitch value which is
longer than 0.75 second comes forth as shown
Figure 1(b). Then the medial region of interval A is
regarded as determinate background noise marked as
F. The pitch’s contours can be correctly used to
detect the vowels which is also called determinate
speech region marked as D in Figure 1(b). The left
three segments C, E and G are defined as the
potential speeches region in which the consonants
often exist. Four sub-bands in spectrum of
determinate noise F are partitioned to update the
thresholds of background noise to detect the
existence of consonants in potential speech
segments. Comparing the sub-band energies of
intervals C, E and G with those of determinate noise
F, obvious energy increment is only detected in the
tail of interval G between the white vertical lines in
Figure 1(c). The segmentation of this part before
interval H is finished and then this procedure will be
repeated until the end of this signal.
Since the determinate noise region can be found
in nearly every pause during the speech signal,
thresholds of background noise can be updated in
time. Therefore, proposed method can track the non-
stationary noise efficiently and can be robust for the
signal with complex noise.
3 PITCH MEASUREMENT
Pitch, also called fundamental frequency, is an
effective feature to reflect the periodic nature of
most vowels in speech. In this paper subharmonic-
summation (SHS) algorithm in (D. Hermes, 1988)
has been referred due to its fast computing ability,
and SHS method hardly miss all the pitch frames in
a long speech period. Some improvements have
been put forward in proposed method to increase the
accuracy on SHS.
3.1 SHS Process
Figure 2: Pitch Measurement procedure of SHS.
Procedure of pitch calculation with SHS is shown in
Figure 2. The down-sampled amplitude spectrum
P(f) in Figure 2(b) from waveform in Figure 2(a) is
shown in linear frequency abscissa because
frequencies above 1250 Hz are assumed not to be
necessary for the pitch-determination process. Then
peak enhancement is applied only to consider the
values at and around the peaks. In Figure 2(c), a
ROBUST VOICE ACTIVITY DETECTION BASED ON PITCH AND SUB-BAND ENERGY
45

transition from a linear to a logarithmic frequency
abscissa s is accompanied. Figure 2(d) only
represents sub harmonics up to the rank 3. The sub
harmonic summation is calculated on the shifted
logarithmic scale log
2
n
. The sub harmonic sum
spectrum H(s) is showed in formula below.
∑
=
+=
N
n
nsPnhsH
1
2
)log()()(
(1)
Where n is the compression factor, N is set to 15,
and h(n) = 0.84
n-1
. The estimation of pitch f=2
s
is the
value at which maximum of the subharmonic sum
spectrum is calculated.
3.2 False Pitch Detection
SHS’s advantage of low speech missing makes sure
the long non-pitch part contains a determinate noise.
However, the measurement may also contain some
“false pitch”. For a non-silence signal, there is
always a maximum in the sub harmonic sum
spectrum H(s), even when signal only consists of
slight noise. Therefore, not all the extracted pitches
using above method are vowels frames and these
obtained pitch value by mistake are called false
pitches.
Correlation coefficient in time domain has been
applied to wipe off the false pitches because speech
signal often has higher correlation coefficients than
those of noise. Correlation coefficient R between
two signals x
i
and y
i
can be calculated as follows.
()( )
[]
()( )
∑∑
∑
==
=
−⋅−
−⋅−
=
N
i
N
i
ii
N
i
ii
yEyxEx
yEyxEx
R
11
22
1
)()(
)()(
(2)
∑
=
=
N
i
i
x
N
xE
1
1
)(
∑
=
=
N
i
i
y
N
yE
1
1
)(
(3)
Where x
i
starts at T seconds before the middle of the
signal frame for which pitch was estimated and y
i
starts at the middle of the signal. N is the sampling
number in T=1/f seconds and f is the pitch value of
this frame.
After all correlation coefficients have been
calculated, a 5- point median filter is applied to
smooth the sequence of coefficients for the dispersed
points. The threshold for the speech/non-speech
decision is set to 0.52. The extracted pitch values
with correlation coefficients lower than this
threshold are regarded as non-pitch frames.
4 SUB-BAND ENERGY
CRITERIA
Because there are no pitch value for most
consonants and fractional vowel tails (D.J. Liu &
C.T. Lin, 2001), sub-band energy criteria for the
ambiguous region is adopted to retrieve these voiced
segments. For vowels, the distributions of spectral
energy mainly concentrate in the range of low
frequency while the distributions for consonants are
often at high frequency. Moreover, since most of the
background noises are additive noises, the arrival of
a speech will increase the spectral energy of
determinate background noise (A. Davis et al.,
2006). Therefore, sub-band spectral energy criteria
in the range of low and high frequency are
introduced to retrieve the rest voice segments in
potential speech region.
4.1 Sub-bands Division
The whole frequency band is firstly divided into two
sub-bands: low-frequency and high-frequency. Then
each sub-band is further divided into two sub-bands
based on energy distribution and four sub-bands are
partitioned finally.
For each pre-emphasized frame in 16 kHz
sampling rate data, a 512-point FFT is applied to
obtain the amplitude spectrum. There are 256
spectral bins B
[0, 255]
in 0-8 kHz. First, the dividing
frequency for low and high frequency is set to 3 kHz
and the corresponding spectral bin is 95. For low
frequency range division, assuming spectral bin k is
the first division point,
l
E and
h
E are the average
energy of band B
[1, k]
and B
[k, 95]
. We calculate their
variances D
l
and D
h
in low-frequency band as
follows:
∑
−
=
−
−
=
1
1
2
))((
1
1
k
i
ll
Ei
k
D
ε
(4)
2
94
))((
95
1
∑
=
−
−
=
ki
hh
Ei
k
D
ε
(5)
95,...,1,)(
1
)(
1
0
==
∑
−
=
iiE
N
i
N
p
p
ε
(6)
Where )(i
ε
is the average energy in low frequency
sub-band and
)(iE
p
is the p frame’s energy at
spectral bin i.
The best division spectral bin k on energy
distribution will be achieved when summation of D
l
and D
k
reaches to minimum since it can divide band
SIGMAP 2009 - International Conference on Signal Processing and Multimedia Applications
46
according to energy distribution level. Similarly we
can divide the low frequency band into two sub-
bands and then the whole frequency becomes four
sub-bands: two sub-bands in low frequency and two
in high frequency.
4.2 Sub-band Thresholds
The threshold of each sub-band is set by both noise
energy level and the fluctuation in formula 7:
α
/)}()...0(max{ NddEThr
tt
t
t
+=
(7)
t
tt
EnEnd −= )()(
(n=0…N, t=0..3)
(8)
Where N is the frame number of determinate noise
and the threshold of sub-band t is Thr
t
and
α
is
sensitivity coefficient between 0-1. d
t
(n) represents
the difference between energy of frame n E
t
(n) and
average energy in sub-band t
t
E
.
If the smoothed frame’s energy can pass the
threshold, it will be regarded as speech frame. This
threshold reflects the noise energy level
t
E
and its
fluctuation max{d
t
(0)…d
t
(N)}.
5 EXPERIMENT
5.1 Experiment Data
The experimental speech signals are collected from
daily conferences recording and China Central
Television (CCTV) programs.
The conference data were recorded with PCSA1
recorder product and TV programs were recorded
with software Pinnacle TVCenter Pro including
news, entertainment programs, advertisements and
sports commentaries where golf, tennis and
basketball sports are involved. The languages
spoken in these data include Chinese, English and
Japanese. The data are recorded in PCM format, 8-
bit, 16 kHz sampling rate with the total length of 325
minutes.
5.2 Experiment Results
The test data are divided into three groups: Meeting,
TV program and Sports data. VAD results of the
proposed method and three standard VAD
algorithms G729b, ETSI AFE, AMR are given in
table 1. HR means the hit rate for both speech and
non-speech detection at frame level. HR0 and HR1
are defined as speech hit-rate and non-speech
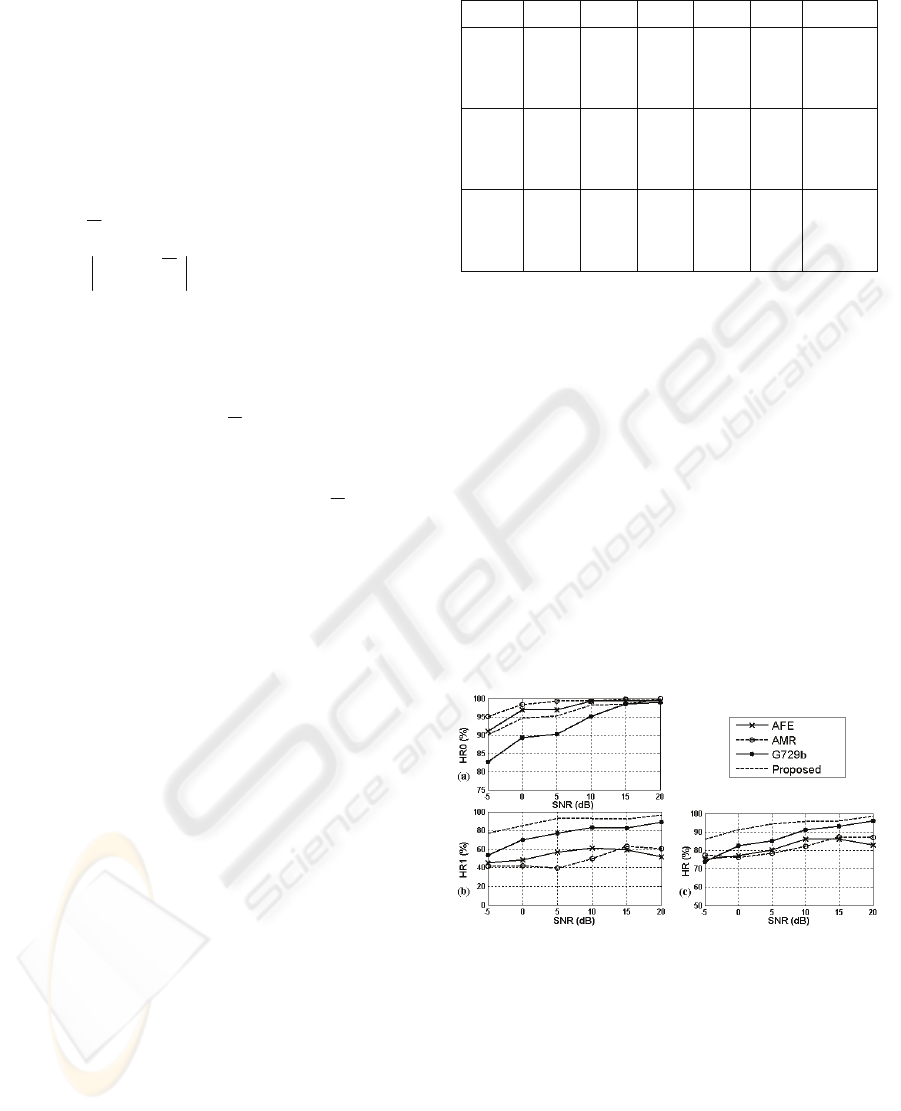
Table 1: Compare proposed method to standard VAD.
Data Length
Result
G729b AFE AMR Proposed
Meeting 65min
HR 91.1% 82.4% 86.8% 97.1%
HR0 98.9% 99.3% 99.7% 99.1%
HR1 84.9% 49.2% 58.9% 93.0%
TV
program
25min
HR 84.8% 83.7% 84.6% 94.8%
HR0 93.4% 99.1% 99.8% 98.7%
HR1 67.9% 52.3% 53.7% 87.2%
Sports 235min
HR 82.6% 80.4% 79.4% 91.4%
HR0 88.9% 96.3% 98.7% 95.5%
HR1 69.3% 47.8% 40.2% 82.8%
detection hit-rate at frame level respectively.
From table 1, we can see that speech detection
hit rate (HR0) of our proposed method for these test
data can reach 99.1%, 98.7% and 95.5% respectively,
which is higher than that of G729b and a little bit
lower than those of AFE and AMR. Moreover,
proposed method reaches to the most efficient non-
speech detection hit rate (HR1). Taking Meeting data
as example, HR1 of our method can reach 93.0%
while 84.9%, 49.2% and 58.9% for G729b, AFE and
AMR respectively. Result shows that our method
achieves best HR for overall speech and non-speech
detection.
To better explore the performance of our method,
detailed comparison of HR, HR0 and HR1 in these
four methods under difference SNR is given in
Figure 3.
Figure 3: Results comparison under different SNR.
It can be seen from Figure 4(a) that these four
methods can achieve more than 97% speech hit rate
(HR0) with SNR values between 15 and 20dB. With
the increasing of noise level, G729b’s HR0
decreases below 85% while our method and AFE,
AMR is still above 90%. In Figure 4(b), our method
obtains 5%~20% improvements than G729b and
20%~50% improvements than AFE and AMR. In
Figure 4(c), experimental results show that proposed
method improves more than 10% overall hit rate of
ROBUST VOICE ACTIVITY DETECTION BASED ON PITCH AND SUB-BAND ENERGY
47

speech and non-speech than these three standard
VAD methods even when these recordings are
dominated with speech over non-speech.
The experiments are tested on a Core2
®
2.13GHz
Windows
®
XP PC and the real-time rate of proposed
method is 1/50. It proves that proposed method is
competent for real-time speech processing system.
6 CONCLUSIONS
This paper presents a robust VAD method based on
pitch measurement and sub-band energy. The
proposed method outperforms G729b, AMR and
AFE under different SNR environments, especially
on the non-speech detection. Experimental result
shows proposed method is more reliable in the
practical circumstances.
ACKNOWLEDGEMENTS
My friend Kun Liu gives great help during the whole
research and the Figure 2 in this paper is modified
by the picture from D. Hermes’ article, author gives
a great appreciation to both of them.
REFERENCES
3GPP, 2001. Speech codec speech processing functions;
Adaptive Multi-Rate-Wideband (AMR-WB) speech
codec; Voice Activity Detector (VAD).
A. Davis, S. Nordholm, S.-Y. Low, R. Togneri, 2006. A
multi-decision sub-band voice activity detector,
Proceedings of EUSIPCO, Florence Italy.
D. Hermes, 1988. Measurement of pitch by subharmonic
summation, The Journal of the Acoustic Society of
America, pp. 257-264.
Der-Jenq Liu, Chin-Teng Lin, 2001. Fundamental
frequency estimation based on the joint time-
frequency analysis of harmonic spectral structure,
IEEE Trans. Speech Audio Process, pp. 609–621.
E. Fisher, J. Tabrikian, S. Dubnov, 2006. Generalized
likelihood ratio test for voiced-unvoiced decision in
noisy speech using the harmonic model, IEEE
Transactions on Audio, Speech and Language
Processing, pp. 502-510.
ETSI, 2007. Speech processing, transmission and quality
aspects (STQ); Distributed speech recognition;
Advanced front-end feature extraction algorithm;
Compression algorithms, ETSI ES 202 050
Recommendation.
ITU-T, 1997. A silence compression scheme for G.729
optimized for terminals conforming to
recommendation V.70, ITU-T Rec. G. 729, Annex B.
K. Woo, T. Yang, K. Park, and C. Lee, 2000. Robust voice
activity detection algorithm for estimating noise
spectrum, Electronics Letters, pp. 180–181.
L. Karray and A. Martin, 2003. Toward improving speech
detection robustness for speech recognition in adverse
environments, Speech Communication, pp. 261–276.
Syed W.Q., Hsiao-Chun Wu, 2007. Speech waveform
compression using robust adaptive voice activity
detection for nonstationary noise in multimedia
communications, Global Telecommunications
Conference, pp. 3096-3101.
X.J Yang., H.S. Chi, 1995. Speech signal digital
processing, Electronic Industry Press, Beijing.
SIGMAP 2009 - International Conference on Signal Processing and Multimedia Applications
48
