
MEASURING DATA QUALITY IN VORTALS
Angélica Caro
Department of Computer Science and Information Technologies, University of Bio Bio, Chillán, Chile
Mª Ángeles Moraga, Carmen Moraga, Coral Calero
Alarcos Research Group – Institute of Information Technologies & Systems, Paseo de la Universidad 4, Ciudad Real, Spain
Keywords: Data quality, Vortals, Web portals.
Abstract: Nowadays, Web portals serve as an important means to access information. It is common for users to use
information obtained from the web to carry out their daily tasks. These users need to ensure that this
information suits their needs. PDQM (Portal Data Quality Model) is a model that assesses the quality of
portal data. PDQM has been defined in such a way that every time that one wishes to evaluate a different
portal context, a specific configuration of the model must be used. In an attempt to go beyond this limitation
and with the idea of making PDQM a more generic model, we have adjusted it to be applied to vortals, the
largest category of portals. This article describes the first phase of adapting PDQM.
1 INTRODUCTION
Increasingly, more companies are deciding to use
web portals to sell their products or as an access
point for the tools that their employees need to
perform their jobs. One of the aims of many web
portals is to select, organize and distribute content
(information or other services and products) in order
to satisfy their users/customers (Domingues et al.,
2006). Therefore, it is essential that the information
contained in a portal meet certain quality standards.
It is important to note that the success of a web
portal depends on whether it receives access from
users. Logically, if users stop using a portal, it will
disappear. Therefore, one of the main features to
evaluate with web portals is the quality of the data
that they provide.
In recent years, the research community has
started to look into the area of data quality (DQ) on
the web (Gertz et al., 2004). However, although
some studies suggest that DQ is one of the relevant
factors when measuring the quality of a web portal
(Moraga et al., 2006), few have addressed DQ in
these portals.
The quality of data can be approached from
different perspectives: the data consumer (the user),
the data producer (who produces it) and the
administrator (responsible for maintaining the data).
In (Caro et al., 2008) the quality of data from the
consumer’s perspective has been studied. In their
model, they have identified four significant features
of data quality: intrinsic DQ, operational DQ,
contextual DQ and representational DQ. Of these
four features, the one that has been analysed in the
greatest detail is representational DQ, for which
measures and a Bayesian network, that processes it,
have been defined.
Moreover, a tool called PoDQA that can
automate calculations, has been built
(http://podqa.webportalquality.com/). The tool
begins with the web portal address and automatically
calculates the indicators using the Bayesian network
to determine the portal’s representational DQ level.
However, despite the novelty and usefulness of the
proposal, it has one limitation: the model and the
Bayesian network must be configured depending on
the domain of web portal to evaluate. That is, using
this proposal, it is necessary to adapt the probability
tables that the Bayesian network uses to estimate the
representational DQ level according to the type of
web portal (university, bank, government, etc.) At
this moment, the model and the tool have been
validated for university web portals.
In this study, we intend to adapt this proposal to
include a larger number of portals. Specifically, we
focus on vortals, which are portals designed to meet
the needs of a specific community, for example,
bank portals, whose objective is to meet the needs of
their clients and employees. In order to carry out this
217
Caro A., Ángeles Moraga M., Moraga C. and Calero C. (2009).
MEASURING DATA QUALITY IN VORTALS.
In Proceedings of the 4th International Conference on Software and Data Technologies, pages 217-222
DOI: 10.5220/0002241602170222
Copyright
c
SciTePress

adaptation, the original model was studied and
modified in an attempt to change its probability
tables to make them more generic, eliminating the
restrictions (or values) that are specific to university
web portals. Finally, to check the usefulness of our
proposal, it was validated using a survey.
This study is structured as follows. Section 2
presents a brief discussion about vortals. Section 3
presents the data quality model for web portals and
section 4 presents the experiment whose objective
was to validate the proposal. Finally, some
conclusions and future works are presented.
2 VORTALS
A web portal is a site that aggregates information
from multiple sources on the World Wide Web and
organizes this material in an easy, user-friendly
manner (Xiao, Dasgupta, 2005). Web portals help
users to locate information on the Internet.
Therefore, portals integrate an increasing amount of
information and functionality (Zirpins et al., 2001).
Portals have several classifications, one of which
divides portals as follows:
- Horizontal Portal, or hortal: provides consumers
with access to a number of different sites in terms
of content and functionality (Xiao, Dasgupta,
2005). They usually offer a broad array of
resources and services in an effort to convince
users to make the site their home page and let
them use it as long and often as they wish
(Zirpins et al., 2001). An example of horizontal
portals is Yahoo (http://es.yahoo.com).
- Vertical Portal, or vortal: portals that specifically
target a particular audience and contain a great
amount of information and content within a
specific category (Clarke, Flaherty, 2003). They
offer content and services aimed at a specific
domain or community (Zirpins et al., 2001). One
kind of vortals is the ‘Enterprise Information
Portal’, also called ‘Corporate Portals’. These are
web applications that integrate all types of data
and services related to a specific company and
offer support information, detailed product
catalogues and the functionality of an online shop
(Zirpins et al., 2001). Corporate portals ensure
that any interested members of a corporation
always have immediate and ready access to all
necessary information and services (Guruge,
2003). A museum web portal is a good example
of a vertical portal. University or bank web
portals are other examples.
3 PDQM: A DATA QUALITY
MODEL FOR WEB PORTALS
PDQM is a data quality model for web portals that
focuses on the perspective of the data consumer.
This essentially means two things. First, the model
only evaluates the portal data accessible to the data
consumer. Second, the model evaluates data in much
the same way as a data consumer.
The development of PDQM was divided into
two stages: the theoretical definition and the
operational definition of the model. The goal of the
theoretical definition was to determine a set of DQ
attributes that are relevant to data consumers when it
comes to evaluating the DQ of any web portal. For
this, a set of DQ attributes proposed in the literature
was selected to evaluate DQ in a web context and
then a selection of the most relevant attributes for a
web portal was made (based on the functionality of a
web portal (Collins, 2001) and the Internet users’
DQ expectations (Redman, 2000)). This set was
empirically validated, producing the result of the
final set of DQ attributes for the model, as shown in
Table 1. More details on the development of the
theoretical version of PDQM can be found in (Caro
et al., 2008).
Once the theoretical version of PDQM was
defined, the second stage consisted of converting it
into an operational model, i.e., a model that could be
used to evaluate DQ. This conversion basically
entailed defining a structure in which the attributes
and their relationships could be organized and
defining measurements, as well as the setting in
which it was going to be applied (in the case of
(Caro et al., 2008), for university portals).
Table 1: DQ Attributes of PDQM.
Attractiveness
Consistent
Representation
Interpretability Response Time
A
ccessibility
Currency
Novelty Security
A
ccuracy
Documentation
Objectivit
y
Specialization
A
mount of Data
Duplicates
Organization Timeliness
Applicability
Ease of
Operation
Relevancy Traceability
Availability Expiration
Customer
Support
Understandability
Believabilit
y
Flexibilit
y
Reliability Validit
y
Completeness
Interactivit
y
Reputation Value added
Concise
Representation
Bearing in mind the subjectivity implicit in the
perspective of data consumers and the uncertainty
inherent in the perception of quality (Eppler, 2003),
in order to create an operational definition of
PDQM, a probabilistic focus was used that relied on
Bayesian networks and diffuse logic (Malak et al.,
2006). Bayesian networks (BN) are used to
structure, refine and represent PDQM for DQ
ICSOFT 2009 - 4th International Conference on Software and Data Technologies
218
evaluation in web portals while diffuse logic is used
to transform the results of the measurements applied
to a portal in valid entries for the Bayesian network.
This will be summarized below, but a more detailed
description can be found in (Caro et al., 2008).
To obtain the operational version of PDQM, the
attributes were first organized into four DQ
categories: intrinsic, operational, contextual and
representational. Then, within each category,
influential relationships were established between
the attributes to determine which attributes were
dependent on other attributes. For example in the
category of representational DQ, it was determined
that data organisation influences understandability.
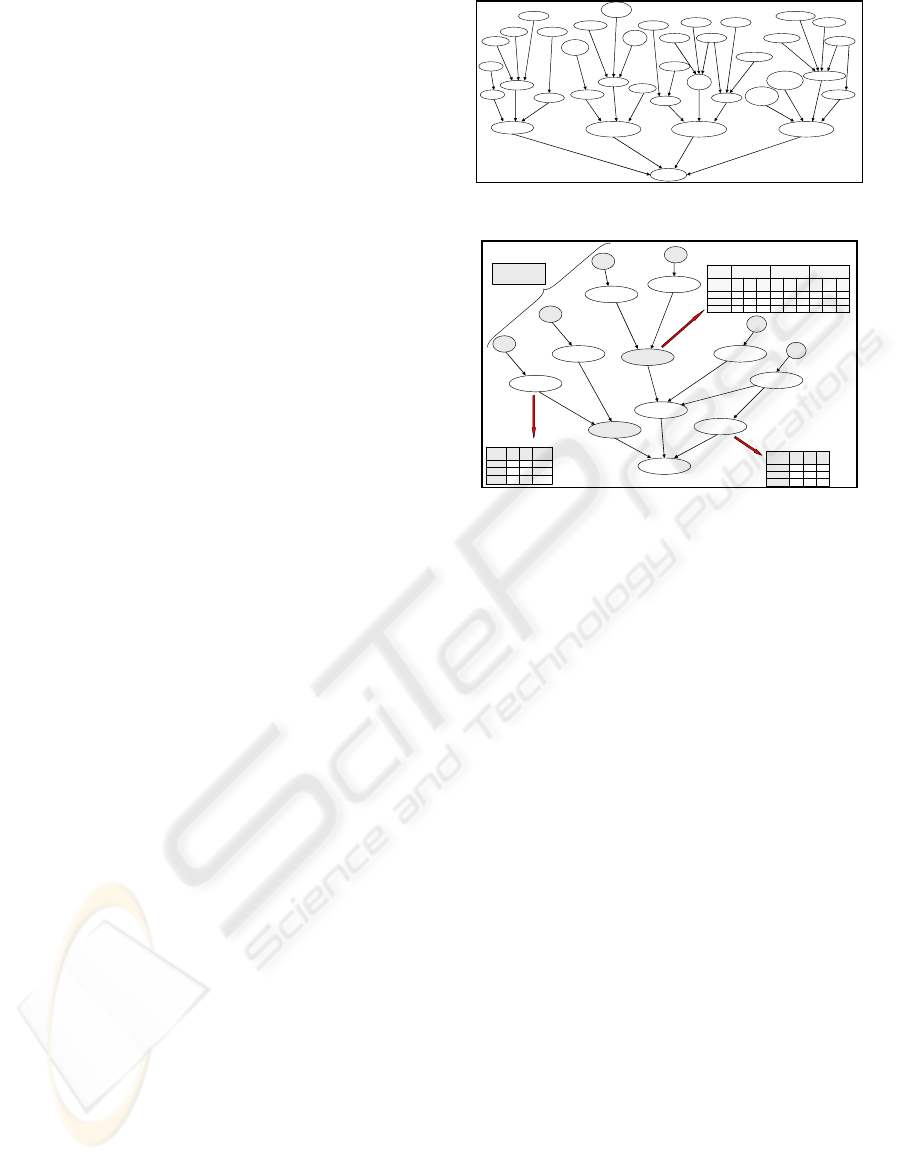
As a result of this, a BN was obtained (see
Figure )
which organizes the 33 DQ attributes into four
network fragments (one for each DQ category).
Once the Bayesian network was defined, it was
necessary to make the model function in a specific
context, for which a probability table was defined
for each node in the fragment (
Figure shows the
probability table for the Consistent Representation,
Volume of Data and Attractiveness nodes). Since
these tables had to be specific for the context of
university portals, their values were defined by
experts in university web portals (the experts were a
group of DQ researchers and university web portal
users). Furthermore, the attributes particular to the
domain, i.e., university portals, were reflected in the
interrelationships.
Then, one indicator, or quantifiable variable, was
defined for each entry node in the fragment (the
indicators were: Level of Consistent Representation
(LCsR), Level of Concise Representation (LCcR),
Level of Documentation (LD), Level of Amount of
Data (LAD), Level of Organization (LO) and Level
of Interpretation (LI), in
Figure ). The value of each
indicator was calculated based on a set of measures
applied to a university portal.
Since each indicator takes a numerical value
between 0 and 1, fuzzy logic was used to transform
this value into discrete variables. The idea here is
that the different values that an indicator may take
are replaced by a set of probabilities which represent
the degree of membership of each value in various
fuzzy labels/classes (for example, ‘High’, ‘Medium’,
‘Low’). Hence, for each indicator, a membership
function was defined that transforms the value of
that indicator into a set of probabilities, each of
which corresponds to a label/class (Malak et al.,
2006). A trapezoidal membership function was used
for this transformation.
Thus, in order to obtain the score for the
representational DQ of a given web portal, PDQM
follows certain steps. First, it calculates the measures
associated with the indicators (the objective
Attractiveness
PDQ
DQ_Intrinsic
DQ_Operational
DQ_Contextual DQ_Representation
Interpretability
Understandability
Concise
Representation
Consistent
Representation
Amount of Data
Documentation
Organization
Validity
Value-
Added
Relevance
Specialization
Timeliness
Novelty
Flexibility
Applicability
Completeness
Reliability
Security
Accessibility
Availability
Response
Time
Interactivity
Easy of
operation
Customer
Support
Accuracy
Believability
Currency
Expiration
Duplicates
Objectivity
Reputation
Traceability
Figure 1: BN graph to represent PDQM.
0.90.60.20.60.30.050.20.050.01Good
0.090.250.30. 250.40.150.30.150.09
Medium
0.010.150.50. 150.30.80.50.80.9
Bad
GoodMedi
um
BadGoodMedi
um
BadGoodMedi
um
BadAmount
of Data
GoodMediumBadDocumen
tation
0.90.60.20.60.30.050.20.050.01Good
0.090.250.30. 250.40.150.30.150.09
Medium
0.010.150.50. 150.30.80.50.80.9
Bad
GoodMedi
um
BadGoodMedi
um
BadGoodMedi
um
BadAmount
of Data
GoodMediumBadDocumen
tation
0.650.080.08High
0.330.80.22
Medium
0.020.120.7
Low
GoodMedi
um
BadOrganiza
tion
0.650.080.08High
0.330.80.22
Medium
0.020.120.7
Low
GoodMedi
um
BadOrganiza
tion
0.820. 120.08Good
0.140. 80.12
Medium
0.040. 080.8
Bad
HighMedi
um
LowLCsR
0.820. 120.08Good
0.140. 80.12
Medium
0.040. 080.8
Bad
HighMedi
um
LowLCsR
Probability Table of Attractiveness
Probability Table of Volume of data
Probability Table of Consistent Representation
DQ_Representational
Attractiveness
Understandability
Representation
Consistent
Representation
Concise
Representation
Volume of Data
Documentation
Organization
Interpretability
Amount of Data
LCsR
LCcR
LD
LAD
LI
LO
Indicators that return
numerical value for the
input-nodes:
Indicators that return
numerical value for the
input-nodes:
Figure 2: The network fragment of representational DQ.
measures are calculated automatically and the user’s
evaluations are requested). From these measures, the
indicators are calculated and transformed into a set
of probabilities for each entry node. These
probabilities are entered into the BN. From each
piece of evidence, and using the corresponding
probability table, each node generates a result that is
propagated, via a causal link, to the child nodes for
the whole network to the level of the
representational DQ. This process is applicable to
the whole PDQM model, although only the
representational DQ quantifying model was
developed in (Clarke, Flaherty, 2003).
Finally, in order to make the PDQM accessible
to web portal users, a tool was developed. The tool
is called PoDQA (Portal Data Quality Evaluation)
and, at this time, only implements the
representational DQ fragment.
4 ADAPTING PDQM TO
VORTALS
As noted above, PDQM was only – and partially –
made operational for university web portals.
However, since it was largely defined without
considering the application domain, we believe that
it can be more generically applicable. For this
reason, we decided to make the model operational
for more generic portals (vortals). To begin, this was
consistent with our focus on the development of the
MEASURING DATA QUALITY IN VORTALS
219

PDQM model in the sense that it contemplates its
adaptation to different web portal contexts or, in
terms of the definition of vortals, to particular
audiences. However, from a practical point of view,
having as many model configurations as there are
portal contexts to be evaluated is complicated. In
order to adapt the model to vortals, we decided to
reconfigure the probability tables for the
corresponding network fragment to the
representational DQ and check this with different
vortals to evaluate whether it is possible to obtain a
generic definition of the model.
Our working hypothesis was that if we achieved
a generic configuration of the probability tables for
this fragment, it would also be possible to do so for
the rest of the PDQM fragments.
The following subsection presents the first
experiment designed to determine the adaptability of
PDQM to vortals.
4.1 The First Experiment to Check the
Proposal
Before developing the experiment, representational
DQ fragment probability tables were adjusted. To do
this, we worked with a group of web portal experts
who redefined the probability tables.
Next, we began to define the experiment to see
whether PDQM could be adapted to evaluate vortals
using a generic configuration. The experiment had to
allow a comparison of the evaluations of a group of
users with respect to a group of vortals with the
evaluation produced by PoDQA. To do this, the
PoDQA tool had to be adapted as well.
The hypothesis was that if the users’ evaluation and
that of the PoDQA agreed, then it would possible to
adapt PDQM to vortals. If there was no agreement,
then it would not be possible to consider a generic
configuration to evaluate any type of vortal.
Consequently, the experiment was based on the
development of a survey to obtain user evaluations.
Each activity that was designed to define and carry
out the survey is described below.
Activity 1: Defining the Survey Objective. The
goal of the survey was defined as follows: ‘To
obtain the opinion of a group of vortal users with
respect to the representational DQ of a group of
vortals’.
Activity 2: Planning and Designing the Survey.
Considering the objective as defined, the survey was
geared towards vortal users (data consumers) and
considered three types of vortals: university,
museum and city councils. So that the users could
evaluate the representational DQ of the vortals, three
activities were defined for each of them and then, on
the basis of that experiment, the users were asked to
evaluate the representational DQ (for this, they had
to answer a total of five questions per vortal being
evaluated).
Activity 3: Verifying the Availability of the
Resources to Carry out the Survey. The resources
needed to create the survey as well as distribute it to
the subjects were available. Specifically, once the
instrument was created, it was distributed to subjects
in two ways: direct delivery in printed form or e-
mail delivery.
Activity 4: Designing the Study. Taking the
objective of the survey into consideration, the survey
was created using a descriptive design. In our case,
we wanted vortal users to describe their opinions
regarding the representational DQ.
Activity 5: Preparing the Study Instrument. A
group of questions was selected in accordance with
the goal of the experiment, i.e., questions relating to
a vortal’s representational DQ. The instrument
contained a first part which explained the survey’s
objective to the subjects and gave them a definition
of the representational DQ of a portal. The second
part gave the subjects the URL of a university vortal
and the description of three activities that they had to
perform within it. Each activity consisted of
searching for information within the portal and
answering a question relating to that activity. This
ensured that the subjects actually used the portal and
consequently were capable of determining its
representational DQ. Following this, they were
given five questions which asked them to evaluate
some specific aspects of the representational DQ and
assess the overall representational DQ. All of these
questions were closed. When assessing the overall
representational DQ, the subjects were asked to
select one of the following categories: Low,
Medium-Low, Medium, Medium-High and High.
The third and fourth parts were the same as the first
two, but gave the subjects the URL of a museum and
a city council vortal respectively. Here as well, the
subjects were given three activities for each site and
then five closed questions about the representational
DQ. Therefore, each user had to give his/her opinion
about three different vortals (university, museum
and city council). Each of the activities included in
the instrument was verified in such a way that there
was none that could not be done by the subjects. The
questions were created using conventional language
and expressing simple ideas. Furthermore, to avoid
confusion, no negative questions were included.
ICSOFT 2009 - 4th International Conference on Software and Data Technologies
220
Activity 6: Validating the Survey Instrument.
Once the survey was designed, it was given to a
small number of colleagues to evaluate (i.e., to point
out any questions that had not been clearly
formulated or were not easy to understand). As a
result of the evaluation, we learned that no questions
needed to be modified.
Activity 7: Selecting the Sample. In order to select
the sample, the condition was that the subjects had
to be regular vortal users. Following this, and using
the convenience sample strategy, a sample of 95
subjects was selected, made up of 54 Spanish
subjects and 41 Latin American subjects.
Activity 8: Applying the Survey. The survey was
sent by e-mail to one part of the chosen subjects and
in printed form to the others. Subjects were given
three weeks to complete the survey. After this time,
we received a total of 64 answers, giving us a
response rate of 67%.
Activity 9: Analyzing the Data. Once we received
all of the surveys, we verified that they were all
complete and contained valid answers. This check
revealed that all of the subjects had answered all of
the questions relating to DQ, but that one of the
proposed activities had not always been completed
correctly. After analyzing these surveys to determine
if they had to be eliminated. However, we decided to
include them since it was clear that although the
subjects had not completed the activity and
answered the associated question, they had had a
sufficient interaction with the vortal to be able to
give an opinion about its representational DQ. It is
important to bear in mind that the objective of the
activities was to be sure that the subjects used the
vortal before giving their opinion of the
representational DQ.
Once the answers were analyzed, the level of the
representational DQ of each vortals was determined
in accordance with the criteria of the subjects
surveyed. To obtain this value, the average of all of
the evaluations obtained for each of the vortals was
calculated. (second colum) shows the results for
each vortal evaluated and represents the evaluation
of the majority of the subjects.
Once these survey data were obtained, the next
step was to evaluate the same group of vortals using
PoDQA. (third column) shows the results of this
evaluation.
When a comparison is made of the data obtained
Table 2: Representational DQ level found in the survey
and with the PoDQA tool.
Portal
Representational DQ level
Survey PoDQ
A
University of Sevilla Medium
Medium-High
University of
Castilla-La Mancha
Medium
Medium
University of
Huelva
Medium-High
Medium-Low
Prado Museum Medium- High
Medium-High
Thyssen-
Bornemisza
Museum
Medium
Medium
Picasso Museum Medium
Medium-Low
Ciudad Real city
council
Medium-High
Medium-High
Coruña city council Medium
Medium
Salamanca city
council
Medium
Medium-Low
from the survey and the data obtained from the
tool, the following observations are possible:
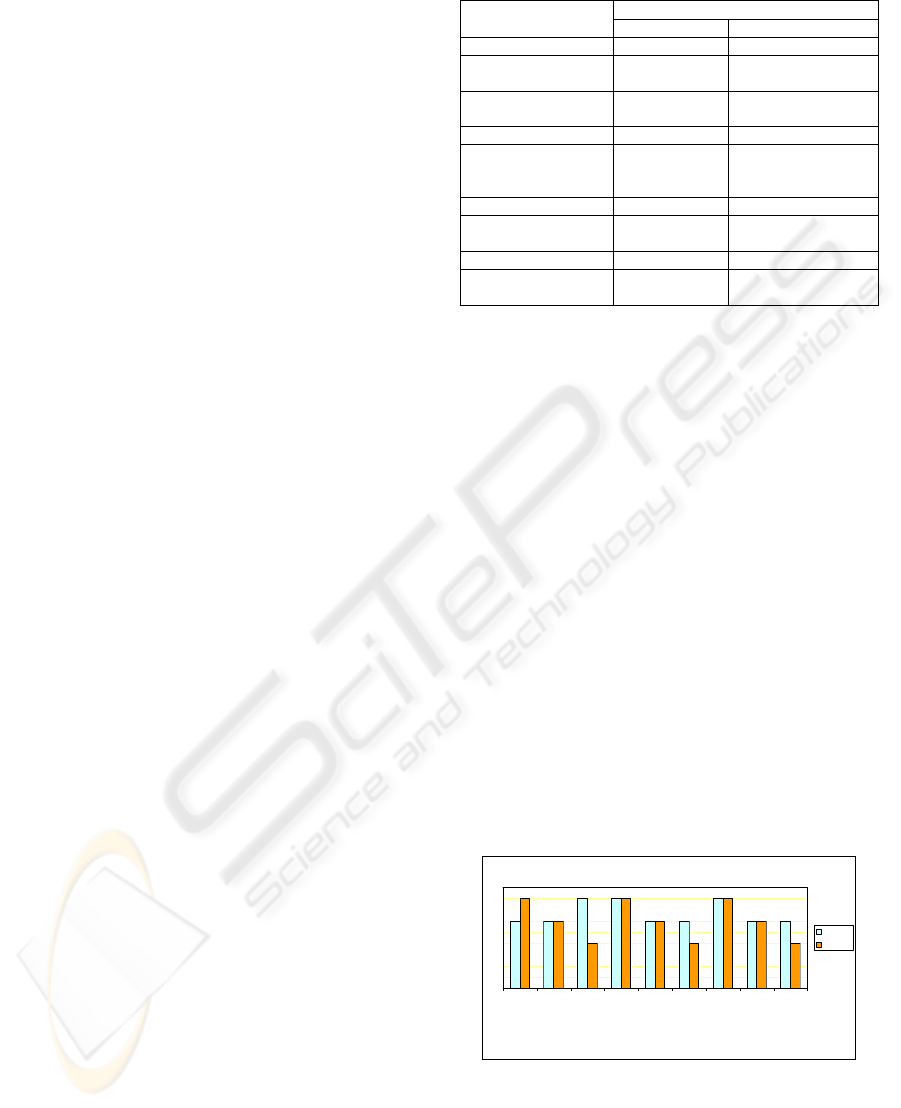
• Of the nine portals evaluated, for five of them,
the evaluations made by the users and the
PoDQA evaluations match completely (see
Figure 3).
• This means that 56% of the PoDQA evaluations
and the surveys matched. Although this is not a
very high percentage, it is possible to say that the
matches are distributed between the different
types of vortals and that this can serve as a
preliminary method to obtain a generic
configuration of the model.
• With respect to the four portals where there is no
match, it must be noted that for three of them,
PoDQA was more demanding in its evaluation
than the subjects and therefore found a lower
level of DQ in the portals. This, again, could be a
sign that it is possible to adjust the measurement
to create a generic configuration.
Finally, there is only one case in which the
opinion of the users and the evaluation obtained
from the PoDQA tool differ completely.
User's DQ versus PoDQA's evaluation
Universidad
de Sevilla
Universidad
de Castilla-
La Mancha
Universidad
de Huelva
Museo del
Prado
Museo
Thyssen-
Bornemisza
Museo
Picasso
Ayuntamiento
de Ciudad
Real
Ayuntamiento
de Coruña
Ayuntamiento
de
Salamanca
Vortals
DQ Level
User s
PoDQA
Figure 3: Comparison of PoDQA and subject evaluations.
Therefore, regarding our initial objective, it is
possible to affirm that PDQM can be used to
evaluate vortals with the modifications that have
been made. It has been confirmed that the PoDQA
tool, which implements PDQM, provides a similar
MEASURING DATA QUALITY IN VORTALS
221

number of matches between its evaluations and the
evaluations provided by the users regardless of the
web portal type. This means that it is not limited to
evaluating only university portals, but is also valid
for other portals like those of museums and city
councils.
5 CONCLUSIONS AND FUTURE
WORKS
PDQM is a data quality model for web portals that
focuses on the perspective of the data consumer.
Consequently, PDQM evaluates only those portal
data that are available to the user and evaluates the
data quality taking into consideration the
subjectivity of the users.
Earlier studies, which have defined the
theoretical version of the model (which provides the
set of attributes needed to evaluate the DQ of a
portal) and the operational version (the definition
that makes it possible to use it in evaluating DQ),
have been partially completed. Specifically, the
operational version of the model has been divided
into 4 subsystems (intrinsic DQ, operational DQ,
contextual DQ and representational DQ) but only
one of them has been completely defined and even
implemented in a tool.
In the first operational version of PDQM, the
definition of a specific configuration for each web
portal context to be evaluated was considered as an
evaluation strategy. However, from a practical point
of view, having as many model configurations as
there are portal contexts to be evaluated is
complicated. Due to this, and before making the rest
of the model operational, we wanted to try to obtain
a generic version of the configuration of the model
that could be applied to any vortal.
This article has presented a first experiment
geared at obtaining a generic configuration of
PDQM and PoDQA. To do this, the earlier
configuration of the model (defined for university
portals) was adjusted and adapted considering
vortals, web portals oriented towards a particular
audience. As a result, we obtained a preliminary
approach that seems encouraging and has given us
cause to continue searching for a generic
configuration.
In future studies, we wish to continue adapting
probability tables to achieve a higher degree of
matches between the opinion of the vortal users and
the PoDQA tool. Furthermore, it will be necessary
to create new surveys that can be used for two
purposes. First, the survey results will make it
possible to determine the evolution of the model,
verifying whether it can be used for any vortal.
Second, and due to the fact that the new survey will
ask questions about all of the nodes that form the
Bayesian network, the results obtained from the
survey will be used to help the network learn. This
will exploit one of the great advantages in Bayesian
networks: their capacity to learn from a specific set
of data.
ACKNOWLEDGEMENTS
This work is part of: INCOME (PET2006-0682-01)
and DQNet (TIN2008-04951-E) from Ministerio de
Educación and IVISCUS (PAC08-0024-5991) from
the Consejería de Educación y Ciencia (JCCM).
REFERENCES
Caro, A. Calero, C., Piattini, M., 2008. A Proposal for a
set of Attributes relevant for Web Portal Data Quality.
Software Quality Journal (SQJ). Published on line, 15
March 2008
Clarke, I., Flaherty, T., 2003.Web-based B2B portals.
Journal of IndustrialMarketing Management.32:15-23
Collins, H., 2001. Corporate Portal Definition and
Features. AMACOM.
Domingues, M.A., Soares, C., Jorge, A.M., 2006. A Web-
Based System to Monitor the Quality of Meta-Data in
Web Portals. In: IEEE/WIC/ACM International
Conference on Web Intelligence and Intelligent Agent
Technology (WI-IATW'06) pp. 188-191.
Eppler, M., 2003. Managing Information Quality:
Increasing the Value of Information in Knowledge-
intensive Products and Processes. Springer.
Gertz, M., Ozsu, T., Saake, G., Sattler, 2004. Report on
the Dagstuhl Seminar "Data Quality on the Web".
SIGMOD Record. vol. 33, Nº 1: 127-132
Guruge, A., 2003. Corporate Portals Empowered with
XML and Web Services. Digital Press. Amsterdam.
Malak, G., Sahraoui, H., Badri, L., Badri, M., 2006.
Modeling Web-Based Applications Quality: A
Probabilistic Approach. In: 7th International
Conference on Web Information Systems Engineering.
Wuhan,LNCS.4255/2006.Springer.pp. 398-404.
Moraga, M.Á., Calero, C., Piattini, M., 2006. Comparing
different quality models for portals. Online
Information Review. Vol. 30(5): 555-568
Redman, T., 2000. Data Quality: The field guide. Digital
Press. Boston.
Xiao, L., Dasgupta, S., 2005. User Satisfaction with Web
Portals: An Empirical Study, in Web Systems Design
and Online Consumer Behavior, chapter 11, In Gao.
Y., (Ed), Idea Group Publishing. Hershey. PA. pp.
193-205
Zirpins, C. Weinreich, H., Bartelt, A., Lamersdorf, W.,
2001. Advanced Concepts for Next Generation
Portals. 12th International Workshop on Database and
Expert Systems Applications pp. 501-506.
ICSOFT 2009 - 4th International Conference on Software and Data Technologies
222
