
TEXT CLASSIFICATION THROUGH TIME
Efficient Label Propagation in Time-Based Graphs
Shumeet Baluja, Deepak Ravichandran and D. Sivakumar
Google, Inc. 1600 Amphitheatre Parkway, Mountain View, CA, 94043, U.S.A.
Keywords: Text analysis, Text Classification, Machine Learning, Graph Algorithms, Preference Propagation, Semi
supervised learning, Natural Language Processing, Adsorption.
Abstract: One of the fundamental assumptions for machine-learning based text classification systems is that the
underlying distribution from which the set of labeled-text is drawn is identical to the distribution from
which the text-to-be-labeled is drawn. However, in live news aggregation sites, this assumption is rarely
correct. Instead, the events and topics discussed in news stories dramatically change over time. Rather than
ignoring this phenomenon, we attempt to explicitly model the transitions of news stories and classifications
over time to label stories that may be acquired months after the initial examples are labeled. We test our
system, based on efficiently propagating labels in time-based graphs, with recently published news stories
collected over an eighty day period. Experiments presented in this paper include the use of training labels
from each story within the first several days of gathering stories, to using a single story as a label.
1 INTRODUCTION
The writing, vocabulary, and topic of news stories
rapidly shift within extremely small periods of time.
In recent years, new events and breaking, “hot”,
stories almost instantaneously dominate the majority
of the press, while older topics just as quickly recede
from popularity (Project for Excellence in
Journalism, 2008). For typical automated news-
classification systems, this can present severe
challenges. For example, the ‘Political’ and
‘Entertainment’ breaking news stories of one week
may have very little in common, in terms of subject
or even vocabulary, with the news stories of the next
week. An automated news classifier that is trained to
accurately recognize the previous day/month/year’s
stories may not have encountered the type of news
story that will arise tomorrow.
Unlike previous work on topic detection and
tracking, we are not attempting to follow a particular
topic over time or to determine when a new topic
has emerged ((
http://www.nist.gov/speech/tests/tdt/) ,
(
Allen, 2002),(Mori et al., 2006)). Instead, we are
addressing a related problem of immediate interest
to live news aggregation sites: given that a news
story has been published, in which of the site’s
preset categories should it be placed?
The volume of news stories necessitates the use
of an automated classifier. However, one of the
fundamental assumptions in machine learning based
approaches to news classification is that the
underlying distribution from which the set of
labeled-text is drawn is identical to the distribution
from which the text-to-be-labeled is drawn. Because
of the rapidly changing nature of news stories, this
may not hold true. In this paper, we present a graph-
based approach to address the problem of explicitly
capturing both strong and weak similarities within
news stories over time and to use these efficiently
for categorization. Our approach combines the
paradigm of Min-Hashing and label propagation in
graphs in a novel way. While Min-Hashing is well-
understood in information retrieval applications, our
application of it to create a temporal similarity graph
appears to be new. Label propagation is gaining
popularity in the field of machine learning as a
technique for semi-supervised learning. Our
approach to label propagation follows our previous
work (Baluja et al., 2008) , where equivalent views
of a basic algorithm termed Adsorption were
established, and the technique was successfully
employed for propagating weak information in
extremely large graphs to create a video
recommendation system for YouTube.
The aims of this paper are to present the
following techniques that we anticipate will have
general applicability for data mining in industrial
settings: formulation of temporal similarities via
graphs created using Min-Hashes, and the
application of label propagation as an off-the-shelf
tool for classification tasks when very little ground
truth is available.
174
Baluja S., Ravichandran D. and Sivakumar D. (2009).
TEXT CLASSIFICATION THROUGH TIME - Efficient Label Propagation in Time-Based Graphs.
In Proceedings of the International Conference on Knowledge Discovery and Information Retrieval, pages 174-182
DOI: 10.5220/0002303001740182
Copyright
c
SciTePress
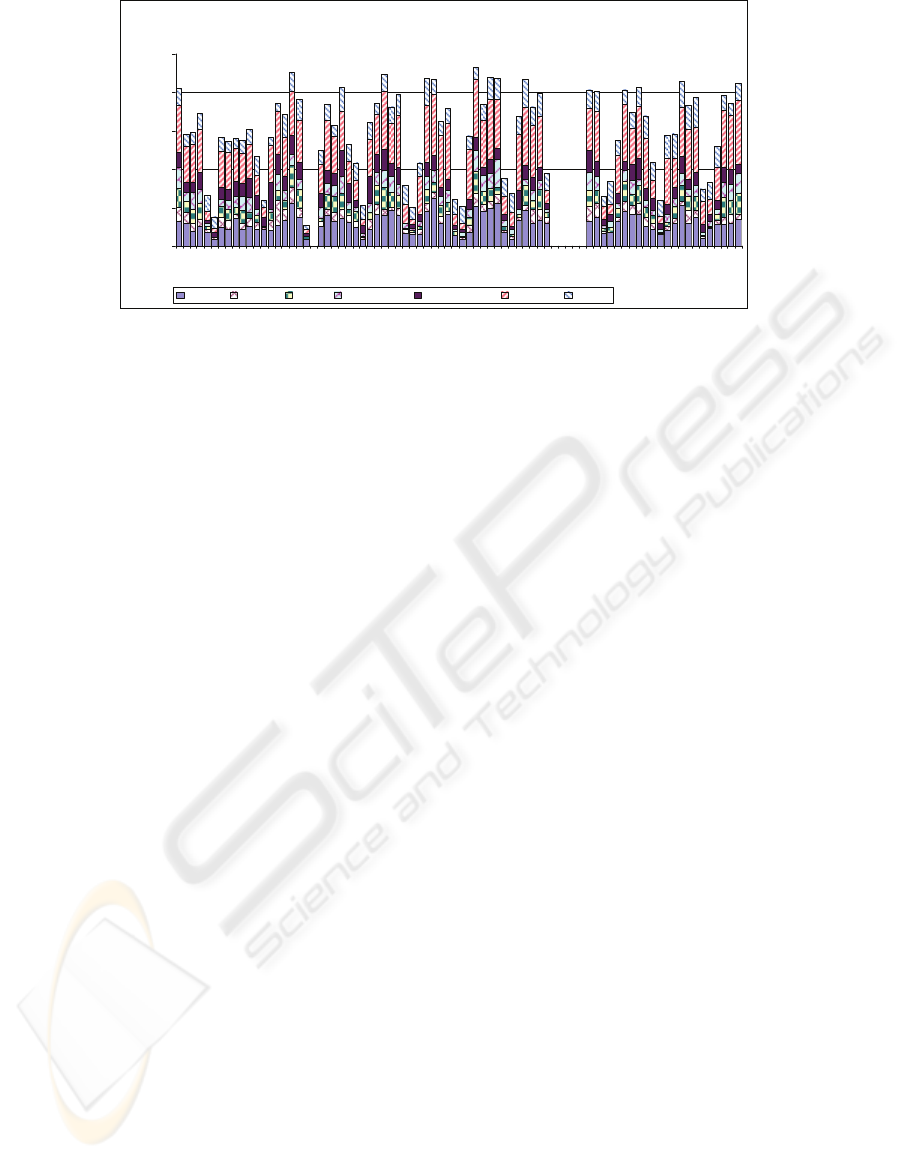
Stories Acquired over Days
0
50
100
150
200
250
1 6 11 16 21 26 31 36 41 46 51 56 61 66 71 76
Day
Number Acquired
Politics Internet Health Environment Entertainment Business Sports
Figure 1: Distribution of Stories Acquired over Testing Period.
The next section describes the data collected and
presents a series of experiments to develop strong,
realistic, baselines for performance. Section 3 gives
a detailed description of the Adsorption algorithm.
Section 4 presents the empirical results to establish
the Adsorption baselines for this task. Section 5
presents extensive results with tiny amounts of
labeled data (e.g., a single labeled example). Section
6 concludes the paper and offers avenues for future
exploration.
2 DATA AND INITIAL
EXPERIMENTS
For the experiments conducted in this paper, we
examined 11,014 unique news stories published
over an 80 day period in 2008. The news stories
were manually placed into one of seven categories
(% composition): “Politics” (19.8%),
“Internet”(6.0%), “Health”(8.8%),
“Environment”(8.3%), “Entertainment”(10.8%),
“Business”(31.6%), or “Sports”(14.5%). Figure 1
shows the number of stories gathered each day from
each class. Note that a few of the entries are 0; due
to errors, no stories were gathered on those days.
Although there are numerous methods to pre-
process and represent text ((Pomikalek and
Rehurek, 2007), (McCallum and Nigam, 1998)), we
chose an extremely simple technique for
reproducibility. Alternate, more sophisticated, pre-
pre-processing techniques will improve all of the
results obtained in this paper. For simplicity, we
only generated a binary bag-of-words representation
for each news story by determining the presence (or
absence) of each word in the vocabulary. The
vocabulary consisted of all words in the complete
set of articles, except those words that occurred in
less than 10 news stories (too infrequent) or those
that occurred in more than 15% of the documents
(too frequent); these words were simply discarded.
2.1 Initial Experiments
In the first set of experiments, we examine how two
standard machine learning techniques, support
vector machines ((Cortes and Vapnik, 1995),
(Joachims, 2002)) and k-nearest neighbor, perform
on the standard task of classifying news stories into
the 1-of-7 categories described earlier. This task is
constructed as a standard machine learning
classification task; a total of 3900 news stories are
used (the first 3900 of the set described in Section
4).
In Table 1, we vary the number of labeled
examples between 100 and 500, and label the
examples 500-3900 using an SVM with linear
kernel (Joachims, 2002). Additionally, a full set of
experiments were conducted with non-linear
kernels, such as Radial Basis Functions. The
performance did not improve over using a linear
kernel, this may be due to the little labeled data
provided. Note that because the SVM is a binary
classifier, we train 21 SVM models to distinguish
each class from each other class. The performance
of the SVM-system dramatically improved with
more labeled samples. Additionally, if we continue
to ignore the temporal nature of the task, we can use
the test set as unlabeled data and take advantage of
unlabeled-training methods. We attempted this in
the training process for the SVM through the use of
transductive learning (in SVM-Light ((Joachims,
2002), (Joachims, 1999)); however, that did not
significantly impact the performance (Ifrim and
Weikum, 2006) reported similar results).
Besides the overall performance, to view the
effects of degradation of performance over time, we
also examine the performance of the first (in time)
100 samples classified in the test set compared with
TEXT CLASSIFICATION THROUGH TIME - Efficient Label Propagation in Time-Based Graphs
175
the last 100 samples classified; these results are
shown in the last two columns of Table 1. Note that,
as expected, the unlabeled stories that are classified
close to the period from which the labeled stories
were taken are labeled more accurately than those
that are labeled further away.
2.2 k-Nearest Neighbor
The experiments with k-nearest neighbor (k-NN)
mirror those conducted with SVMs in the previous
section. However, in order to make the k-NN
process efficient, there must be a rapid method to
find the nearest-neighbors. For this, we use a
hashing scheme based on sparse sketches of the
news stories. The sketches are created using a Min-
Hash scheme (Cohen, et al., 2001) that is then
looked up using an approximate hashing approach
termed LSH. Previously, this technique has been
successfully applied to the large-scale lookup of
music and images (Baluja and Covell, 2008).
Although a full discussion of these approaches is
beyond the scope of this paper, both will be briefly
described since the distance calculations are also
used as the basis of the weights in the Adsorption
graph.
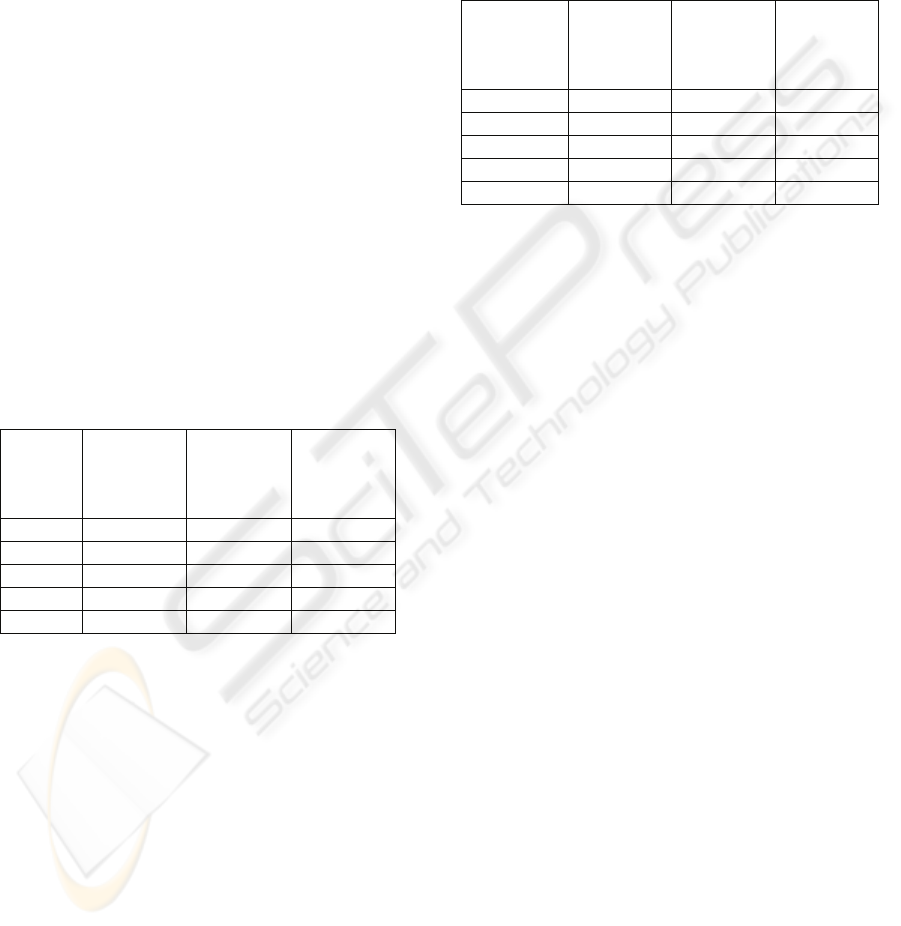
Table 1: SVM Performance, measured with varying
Labeled Samples.
Labeled
Examples
Overall
Performance
(Samples
500-3900)
Initial
Performance
(Samples
500-600)
Later
Performance
(Samples
3800-3900)
0-100 58.5 66 41
0-200 76.0 86 68
0-300 81.6 84 72
0-400 85.2 92 81
0-500 86.2 95 83
Min-Hash creates compact fingerprints of sparse
binary vectors such that the similarity between the
two fingerprints provides a reliable measure of the
probability that the two original vectors were
identical. Because of the sparseness of the bag-of-
words presence vector that is used for the news
stories, it is an ideal candidate for this procedure.
Min-Hash works as follows: select a random, but
known, reordering of all the vector positions. We
call this a permutation reordering. Then for each
story, (for a given permutation reordering) pick the
minimum vector-element that is ‘on’ (in our that is
present in the news story). It is important to note
that the probability by which two news stories will
have the same minimum vector-element is the same
as its Jaccard coefficient value. Hence, to get better
estimates of this value, we repeat this process p
times, with p different permutations to get p
independent projections of the bit vector. Together,
these p values are the signature of the bit vector.
Various values of p were tried. For the remainder of
this paper, we use p=500; this is the signature length
of each vector, and is therefore the length of the
representation of each news story.
Table 2: k-Nearest Neighbor, with Varying Labeled
Samples, Best Value for k given in Column 1.
Labeled
Examples
(best value
of k shown)
Overall
Performance
(Samples
500-3900)
Initial
Performance
(Samples
500-600)
Later
Performance
(Samples
3800-3900)
0-100 (10) 81.3 85 79
0-200 (1) 80.9 86 78
0-300 (10) 82.2 90 76
0-400 (10) 83.3 90 79
0-500 (10) 83.4 92 80
Even with the compression afforded with Min-
Hash, efficiently finding near-neighbors in a 500
dimensional space is not a trivial task; naïve
comparisons are not practical. Instead, we use
Locality-Sensitive Hashing (LSH) (Gionis et al.,
1999). In contrast to standard hashing, LSH
performs a series of hashes, each of which examines
only a portion of the sub-fingerprint. The goal is to
partition the feature vectors (in this case the Min-
Hash signatures) into sub-vectors and to hash each
sub-vector into separate hash tables. Each hash table
uses only a single sub-vector as input to the hash
function. Candidate neighbors are those vectors that
have collisions in at least one of the sub-fingerprint
hashes; the more collisions the more similar.
Together with Min-Hash, LSH provides an effective
way to represent and lookup nearest neighbors of
large, sparse binary vectors. The results with the k-
NN system are given in Table 2. In order to make
the baselines as competitive as possible, we
searched over a large range of possible k-values for
each trial to find the best answer; it is given below.
Note that for smaller number of training examples,
k-NN outperformed SVMs; as the number of
training examples increased, the performance of k-
NN dropped below SVMs.
3 ADSORPTION
The genesis of the family of algorithms that we
collectively call Adsorption (Baluja et al., 2008) is
the following question: assuming we wish to
classify a node in a graph in terms of class-labels
present on some of the other nodes, what is a
KDIR 2009 - International Conference on Knowledge Discovery and Information Retrieval
176

principled way to do it? Perhaps the easiest answer
to this question is to impose a metric on the
underlying graph and classify the label by adopting
the labels present on its nearest neighbor. There are
a variety of metrics to choose from (e.g., shortest
distance, commute time or electrical resistance,
etc.), but most of these are expensive to compute,
especially for large graphs. Furthermore,
conceptually simple ones like shortest distance have
undesirable properties; for example, they do not take
into account the number of paths between the
labeled and unlabeled nodes. Adsorption provides
an intuitive, iterative, manner in which to propagate
labels in a graph.
The first step is setting up the problem in terms
of a graph. For the news story classification task, the
embedding is straightforward: each story is a node
in the graph, and the weights of the edges between
nodes represent the similarity between two news
stories. The similarity is computed via the MIN-
HASH/LSH distance described previously; if there
is a collision via the LSH procedure, then an edge
exists and the weights is non-zero and positive. In
the simplest version of the algorithm, the stories that
are labeled, are labeled with a single category. The
remaining nodes, those to be labeled, will gather
evidence of belonging to each of the seven classes
as Adsorption is run. At the end of the algorithm, for
each node, the class with the largest accumulated
evidence is assigned to the node (and therefore the
news story). When designing a label propagation
algorithm in this framework, there are several
overarching, intuitive, desiderata we would like to
maintain. First, node v should be labeled l only
when there are short paths, with high weight, to
other nodes labeled l. Second, the more short paths
with high weight that exist, the more evidence there
is for l. Third, paths that go through high-degree
nodes may not be as important as those that do not
(intuitively, if a node is similar to many other nodes,
then it being similar to any particular node may not
be as meaningful). Adsorption is able to capture
these desiderata effectively.
Next, we present Adsorption in its simplest
form: iterated label passing and averaging. We will
also present an equivalent algorithm, termed
Adsorption-RW, that computes the same values, but
is based on random walks in the graphs. Although
not presented in this paper, Adsorption can also be
defined as a system of linear equations in which we
can express the label distribution at each vertex as a
convex combination of the other vertices. Our
presentation follows our prior work (Baluja et al.,
2008), which also includes additional details. These
three interpretations of the Adsorption algorithm
provide insights into the computation and direct us
to important practical findings; a few will be briefly
described in Section 3.3.
Figure 2: Basic adsorption algorithm.
3.1 Adsorption via Averaging
In Adsorption, given a graph where some nodes
have labels, the nodes that carry some labels will
forward the labels to their neighbors, who, in turn,
will forward them to their neighbors, and so on, and
all nodes collect the labels they receive. Thus each
node has two roles, forwarding labels and collecting
labels. The crucial detail is the choice of how to
retain a synopsis that will both preserve the essential
parts of this information as well as guarantee a
stable (or convergent) set of label assignments.
Formally, we are given a graph
),,( wEVG =
where
V denotes the set of vertices (nodes),
E denotes the set of edges, and R→Ew : denotes
a nonnegative weight function on the edges. Let
L denote a set of labels, and assume that each node
v in a subset
VV
L
⊆
carries a probability
distribution
v
L on the label set L . We often refer to
L
V
as the set of labeled nodes. For the sake of
exposition, we will introduce a pre-processing step,
where for each vertex
L
Vv
∈
, we create a “shadow”
vertex
v
~
with exactly one out-neighbor, namely
v
,
connected via an edge
),
~
( vv ; furthermore, for each
L
Vv
∈
, we will re-locate the label distribution
v
L
from
v to v
~
, leaving v with no label distribution.
Let
V
~
denote the set of shadow vertices,
{
}
L
VvvV ∈= |
~
~
. From now on, we will assume that
at the beginning of the algorithm, only vertices in
V
~
have non-vacuous label distributions. See Figure
2 for the full algorithm.
Some comments on Adsorption: (1) In the
algorithm, we say that convergence has occurred if
the label distribution of none of the nodes changes
in a round. It can be shown that the algorithm
Al
g
orithm Adsorption:
Input:
L
VLwEVG ,),,,(
=
repeat
for each
VVv
~
∪∈ do:
Let
∑
=
u
uv
LvuwL ),(
end-for
Normalize
v
L to have unit
1
L norm
until convergence
Output: Distributions
}|{ VvL
v
∈
TEXT CLASSIFICATION THROUGH TIME - Efficient Label Propagation in Time-Based Graphs
177

converges to a unique set of label distributions. (2)
Upon convergence, each node
VVv
~
∪∈ carries a
label distribution, provided there is a path from
v
to
some node
L
Vu ∈ . (3) We do not update the label
distribution in each round; rather, we recompute it
entirely, based on the distributions delivered by the
neighbors. (4) Adsorption has an efficient iterative
computation (similar to PageRank (Brin and Page ,
1998)), where, in each iteration, a label distribution
is passed along every edge.
Recalling that our goal was to maintain a
synopsis of the labels that are reachable from a
vertex, let us remark that the normalization step
following the step of computing the weighted sum
of the neighbors’ label distribution is crucial to our
algorithm. Labels that are received from multiple (or
highly-weighted neighbors) will tend to have higher
mass after this step, so this normalization step
renders the Adsorption algorithm as a classifier in
the traditional machine learning sense. The
algorithm, as presented, is a modification of the
label propagation algorithm of Zhu et. al. ((Brin and
Page , 1998), (Zhu et al., 2003)), where they
considered the problem of semi-supervised classifier
design using graphical models. They also note that
their algorithm is different from a random-walk
model proposed by Szummer and Jaakkola
(Szummer and Jaakkola, 2001); in the next section
we will show that there is a very different random
walk algorithm that coincides exactly with the
Adsorption algorithm. The latter fact has also been
noticed independently by Azran (Azran, 2007). This
aspect of the Adsorption algorithm distinguishes it
from the prior works of Zhu et al; the enhanced
random walk model we present generalizes the work
of Zhu et al., and presents a broader class of
optimization problems that we can address
1
. The
approach of Zhu et al. is aimed at labeling the
unlabeled nodes while preserving the labels on the
initially labeled nodes and minimizing the “error”
across edges. In Adsorption, there is a subtle, but
vital, difference, the importance attached to
preserving the labels, as well as the importance of
near vs. far neighbors is explicitly controlled
through the use of the injection-label weights and
abandonment probabilities. These will both be
described in detail in Section 3.3. The random walk
equivalence, under the mild conditions of
ergodicity, immediately implies an efficient
algorithm for the problem, a fact not obvious from a
general formulation as minimizing a convex
1
We thank P. Talukdar (personal communication,
November 2008) for pointing this out.
function. From a broader standpoint, it is interesting
to note that this family of “repeated averaging”
algorithms have a long history in the mathematical
literature of differential equations, specifically in the
context of boundary value problems (i.e., estimating
the heat at a point of a laminar surface, given the
boundary temperatures).
3.2 Adsorption via Random Walks
The memoryless property of the Adsorption
algorithm that we alluded to earlier immediately
leads to a closely related interpretation. Let us
“unwind” the execution of the algorithm from the
final round, tracing it backwards. For a vertex
Vv
∈
, denote by
v
N the probability distribution on
the set of neighbors of
v
described by
)),(/(),()(
∑
=
u
v
vuwvuwuN that is, the probability
of u
is proportional to the weight on the edge
),( vu . The label distribution of a vertex v is simply
a convex combination of the label distributions at its
neighbors, that is,
∑
=
u
uvv
LuNL )( ; therefore, if
we pick an in-neighbor u
of
v
.at random according
to
v
N and sample a label according to the
distribution
u
L , then for each label Ll ∈ , )(lL
v
is
precisely equal to
[
]
)(Exp lL
uu
, where the
Figure 3: Adsorption in terms of random walks.
expectation arises from the process of picking a
neighbor u
according to
v
N . Extending this to
neighbors at distance 2, it is easy to see that for each
label
[]
)(ExpExp)(,
uw
lLlLLl
wv
=
∈
where an in-
neighbor
u of
v
is chosen according to
v
N
and an
in-neighbor w of u is chosen according to
u
N .
Expanding this out, we see that
() ( ) ( ) ()
vvuw
wu
L
lNuNwLl=
∑
∑
.
Algorithm Adsorption-RW
Input:
L
VLwEVG ,),,,(
=
, distinguished vertex
v
Let
}},|)
~
,{(,
~
(
~
wVvvvEVVG
L
∈= ∪∪
Define 1)
~
,(
=
vvw for all
L
Vv ∈
done := false
vertex :=
v
while (not done) do:
vertex := pick-neighbor
),,( wEv
if (neighbor
V
~
∈ )
done := true
en
d
-while
KDIR 2009 - International Conference on Knowledge Discovery and Information Retrieval
178
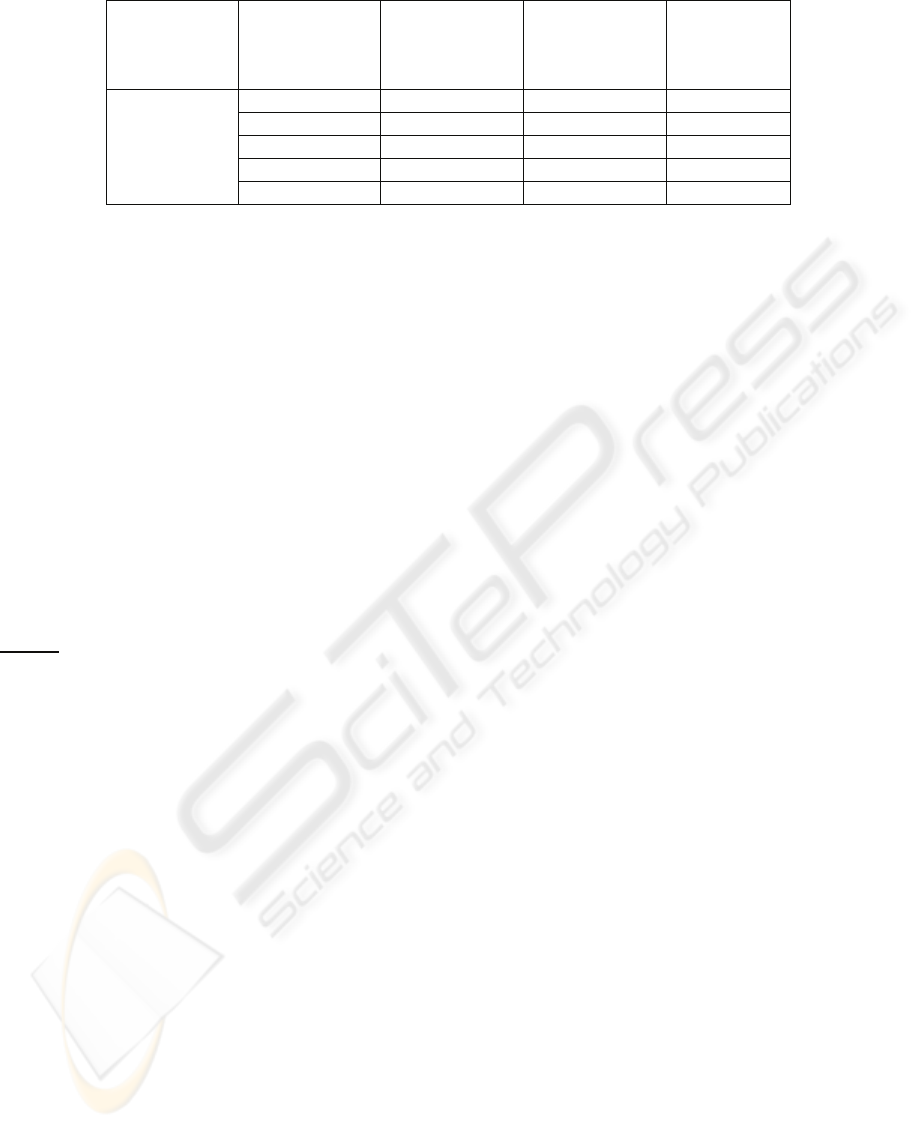
Table 3: Adsorption, with Varying Number of Connections Per Node, 200 Labeled Nodes.
Maximum
Number of
Connections
per Node
Overall
Performance
(Samples
500-3900)
Initial
Performance
(Samples
500-600)
Later
Performance
(Samples
3800-3900)
Adsorption 10 80.1 90 72
100 88.1 92 83
500 86.6 91 84
1000 85.8 91 82
Unlimited 82.4 94 80
Notice that
)(uN
v
is the probability of reaching
u from
v
in one step of a random walk starting
from
v
and picking a neighbor according to
v
N ,
and similarly,
)(wN
u
is the probability of picking a
neighbor
w
of
u
according to
u
N . Notice also the
crucial use of the Markov property
(memorylessness) here: conditioned on the random
walk having reached
u , the only information used
in picking w
is
u
N , which depends only on u , and
not on where we initiated the random walk from.
Finally, note that if the random walk ever reaches
one of the shadow vertices
z
~
where
L
Vz ∈ , then
there is no in-edge into
z
, so the random walks
stops. Thus vertices in
V
~
are “absorbing states” of
the Markov chain defined by the random walk. A
simple induction now establishes that the
Adsorption algorithm is equivalent to the following
variation, described in terms of random walks on the
reverse of the graph G together with the edges
from
V
~
to V . See Figure 3. Here, pick-
neighbor
),,( wEv returns a node u such that
Evu ∈),( (so that there is an edge from
v
to u in
the reversed graph) with
probability
)),(/(),(
∑
u
vuwvuw .
In our exposition below, the algorithm takes a
starting vertex
v
for the random walk, and outputs
a label distribution
v
L for it when it reaches an
absorbing state. Thus, the label distribution for each
node is a random variable, whose expectation yields
the final label distribution for that vertex. To obtain
label distributions for all vertices, this procedure
needs to be repeated many times for every vertex,
and the average distributions calculated. This yields
a very inefficient algorithm; therefore, in practice,
we exploit the equivalence of this algorithm to the
averaging Adsorption algorithm in Section 2.2,
which has very efficient implementations.
It is instructive to compare algorithm
Adsorption-RW with typical uses of stationary
distributions of random walks on graphs, such as the
PageRank algorithm (Brin and Page , 1998). In the
case of PageRank, a fixed Markov random walk is
considered; therefore, the stationary probability
distribution gives, for each node of the graph, the
probability that the walk visits that node. In the
absence of any absorbing node (and assuming the
walk is ergodic), the initial choice of the node from
which the random walk starts is irrelevant in
determining the probability of reaching any
particular node in the long run. Consequently, these
methods do not allow us to measure the influence of
nodes on each other. In our situation, labeled nodes
are absorbing states of the random walk; therefore,
the starting point of the walk determines the
probability with which we will stop the walk at any
of the absorbing states. This implies that we may use
these probabilities as a measure of the influence of
nodes on each other.
3.3 Injection and Abandonment
Probabilities in Adsorption
The three equivalent renditions of the algorithm
(averaging, random walk, system of linear
equations) lead to a number of interesting variations
that one may employ. For example, in the viewpoint
of a linear system of equations, it is easy to see how
we can restrict which labels are allowed for a given
node. In another variation, we can model the
“amount of membership” of a node to a class. Recall
the notion of a “shadow” node
v
~
that act as a
“labelbearer” for
v . A judicious choice of edge
weight along the edge to the label-bearer, or
equivalently the label injection probability, helps us
control how the random walk behaves (this is
equivalent to choosing the transition probability
from
v to v
~
in the reversed graph). For example,
lower transition probabilities to the shadow nodes
may indicate lower membership in the label class
(e.g. a news story is ½ in politics as it is only
tangentially related, etc). Note that indicating ½
politics label does not imply that the other ½ must
be assigned to another class. This will be used in
experiments described in Section 5.
Another important insight is realized when
examining Adsorption in terms of random walks.
Instead of considering the standard random walk on
an edge-weighted graph, one may consider a
“hobbled walk,” where at each step, with some
probability, which we call the abandonment proba-
TEXT CLASSIFICATION THROUGH TIME - Efficient Label Propagation in Time-Based Graphs
179
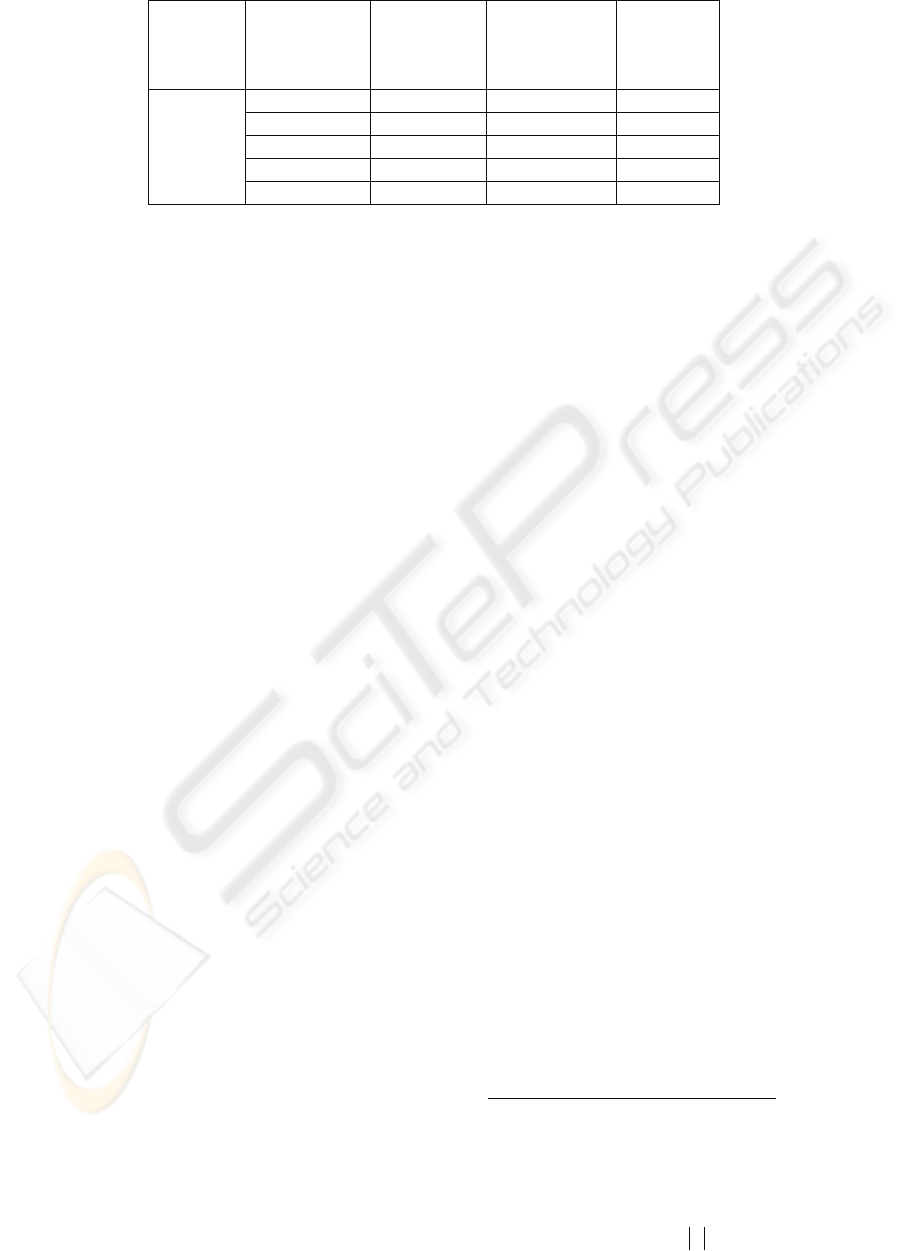
Table 4: Adsorption Performance, with Varying Labeled Samples, 500 connections per node.
Labeled
Examples
Overall
Performance
(Samples
500-3900)
Initial
Performance
(Samples
500-600)
Later
Performance
(Samples
3800-3900)
Adsorption
0-100 86.4 91 84
0-200 86.6 91 84
0-300 86.4 91 82
0-400 86.8 92 84
0-500 86.5 93 83
bility; the algorithm abandons the random walk
without producing any output label. Our
experiments (here and in other applications) have
confirmed that abandoning the random walk with a
small probability at each iteration is a very useful
feature. It slows down the random walk in a
quantifiable way: the influence of a label
l on a
node
u falls off exponentially in the number of
nodes along the paths from nodes that carry
l to u .
This strengthens the effect of nearby nodes; this has
proven crucial to obtaining good results in large
graphs.
4 INITIAL EXPERIMENTS WITH
ADSORPTION
In the experiments presented in this section, we use
the same data that was presented in Section 2, and
apply the Adsorption algorithm. Given the similarity
measurements that were computed via the MIN-
HASH & LSH combination described earlier, the
graph and weights are constructed by simply setting
each story as a node in the graph, and the weights of
the edges between stories as the distance as
specified by the distance computation mentioned
above. The stories that are in the labeled set have
shadow nodes attached to them with the correct
label; stories outside of the labeled set do not have
shadow nodes. Adsorption computes a label
distribution at each node; the label with the
maximum value at the end of the Adsorption run is
considered the node’s (and therefore story’s)
classification. In constructing the graph to use with
Adsorption, a number of options are available.
Encoding domain-specific information into the
graph topology may be a powerful way to express
any a priori or expert knowledge of the task. For
example, knowing that the most accurate
classifications are likely to happen in stories
temporally close to the labeled stories, connections
to nodes representing earlier news stories may
receive a higher weighting; or connections to the
labeled set may be prioritized over other
connections, etc. Nonetheless, to avoid confusing
the causes of the performance numbers and
introducing ad-hoc, domain specific, heuristics, we
experimented with only domain-independent
parameters. One of the most salient is when we
construct the graph, we can limit the number of the
closest neighbors that we connect with each node. In
Table 3, we experiment with connecting each
neighbor only with, at most
2
, its S=10, 100, 500,
1000 most similar stories
3
. Perhaps the most
interesting observation is that increasing the number
of connections does not necessarily increase the
performance. As the number of maximum
connections is increased, eventually the connections
encode such weak similarities between the news
stories that it better not to use them. Currently, we
set the maximum number of connections empirically
(to 500); in the future, other methods will be
explored.
Having set the connection count, we examine
the effects of the number of labeled training
samples. The Adsorption algorithm reveals
performance with 100 labeled examples that is
comparable or exceeds in overall and long-term
performance to the best k-NN and SVM
performance with 500 labeled examples. Results are
shown in Table 4.
In the next section, we continue the empirical
evaluation by looking at larger numbers of news
stories, and the effects of even fewer labels
5 FULL-SCALE EXPERIMENTS
The first full-scale experiment parallels the
experiments presented to this point. We assume that
we have 100 labeled examples and that we would
2
Because there may be fewer than S collisions for a news story in
the LSH hash-tables that are used to rapidly estimate
similarity, every node may not have the maximum S
connections.
3
Recall that since the connections are undirected, a node may
have more than S connections. The total number of undirected
connections will not exceed
VS *
.
KDIR 2009 - International Conference on Knowledge Discovery and Information Retrieval
180
Adsorption (avg=.878)
0.7
0.75
0.8
0.85
0.9
0.95
1
1 11213141516171
Days
Accuracy
k
-nn (avg=0.825)
0.7
0.75
0.8
0.85
0.9
0.95
1
1 11213141516171
Days
Accuracy
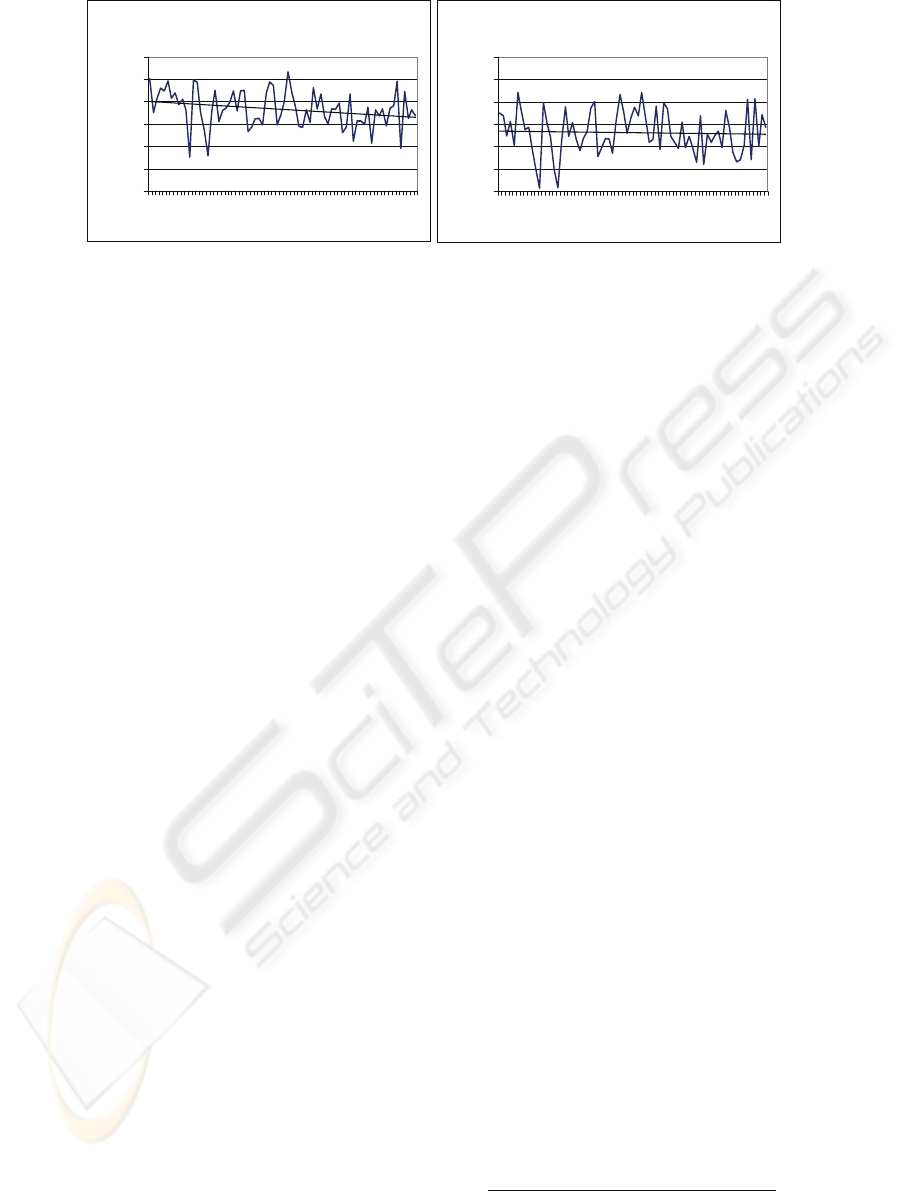
Figure 4: Performance of Adsorption and k-NN over 81 days.
like to categorize examples that appear up to 80
days later after the labeled examples were classified.
The performance is shown in Figure 4, each day in
which a news story was gathered is shown in the
graph. In Figure 4 (right), the comparative results
for k-NN are given. The average performance for
Adsorption is 87.8%, k-NN: 82.5%. Other
techniques such as Naïve-Bayes and SVMs were
also tried; of these other techniques, k-NNs
performed the best. Specifically, Naïve-Bayes
performed worse than both SVMs and k-NNs, and
SVMs performed worse than k-NNs.
In our second experiment, we explore the
ramifications of having two orders of magnitude
less
training data. Only a single example is labeled on
day 1. The goal is to examine the articles in the last
three days (days 78-81), and to rank them according
to the probability of being in the same class as the
single labeled example from the first day. This
scenario is a proxy for a very common scenario
encountered in practice in sites like
news.google.com and other news aggregation sites.
A user may read only a small number of articles one
day, and then come back to the site many days later.
Although there is not much evidence of the user’s
preferences, we know simply that of all the articles
the user could have chosen to read on day 1, (s)he
read a single one. In this case, the labels from the
first day’s article are simply
0: article was not read
or
1: the article was read. For Adsorption, we
weighted the examples with label 0 with an injection
probability of 0.1 to reflect uncertainty of why the
user did not read the article, was it because of
interest, time, or simply not noticing it? The articles
labeled 1 (“read”), continued to have an injection
probability of 1.0.
The performance was measured as follows. 500
articles from the last few days of the experiment
were ranked according to their probability of being
from the same class as the ‘read’ article. The full
Adsorption connectivity graph was used, as
described in the previous experiments, to propagate
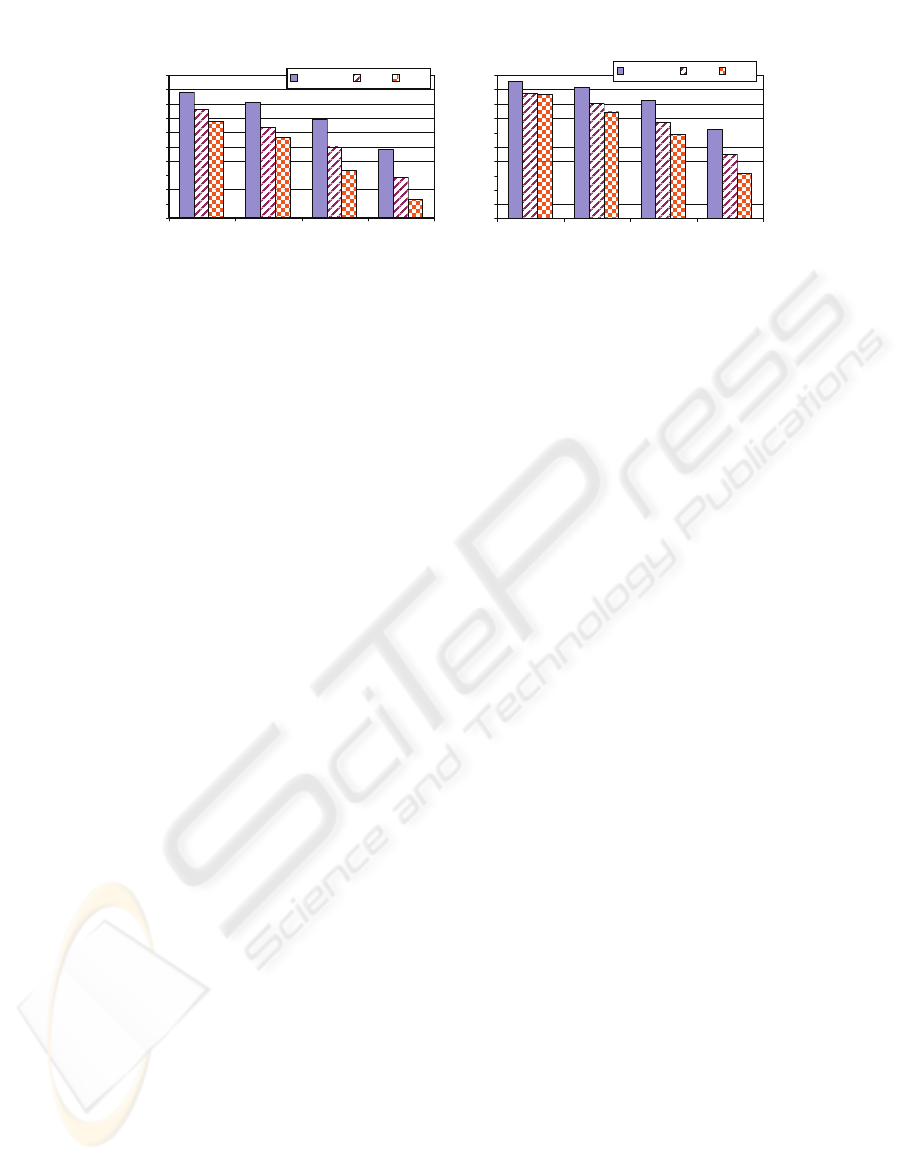
the label through time. In Figure 5, we examine the
top-N (N = 5, 10, 25, 50) of the ranked articles, and
give the percentage of the N that are from the same
class. As can be seen, Figure 5 (Left), even with a
single example, the average precision rate is
approximately 84% with Adsorption for the top-5
examples, and over 80% for the top-10. In Figure 5
(Right), the same experiment is performed, but
measures the effect of having added a second
labeled example (from the same class as the first).
All algorithms improve dramatically over all ranges
of N. Interestingly, a single additional labeled
example provides information that all the algorithms
effectively exploit. Adsorption continues to
outperform K-NN and SVMs
4
in both tests, for all
values of N.
6 CONCLUSIONS & FUTURE
WORK
In this paper, we have presented an efficient and
simple procedure in which to incorporate an often
ignored signal into the task of news classification:
time. Although the writing, vocabulary and topics of
the news stories rapidly change over time, we are
able to perform the classification of news stories
with very little training data that is received only in
the beginning of the testing period.
There are many avenues for future research, both in
this task and in the development of Adsorption.
First, a comparison with different unlabeled data
learning systems is warranted. Although, in this
study, we used transductive SVMs as means to
incorporate unlabeled data, it did not improve
performance significantly. Other methods, such as
spectral clustering may do better. Although most
other techniques do not incorporate a notion of time,
perhaps combinations of the other methods with the
4
The use of unlabeled samples through transductive
learning for the SVM was again used here. It slightly
improved performance in a few trials; the best of both
is given here.
TEXT CLASSIFICATION THROUGH TIME - Efficient Label Propagation in Time-Based Graphs
181
Experiments with a Single
Labeled Example: Precision
0.4
0.45
0.5
0.55
0.6
0.65
0.7
0.75
0.8
0.85
0.9
5102550
Examples Examined
Precision
Adsorption K-NN SVM
Experiments with Two Labeled
Examples: Precision
0.4
0.45
0.5
0.55
0.6
0.65
0.7
0.75
0.8
0.85
0.9
5102550
Examples Examined
Precision
Adsorption K-NN SVM
Figure 5: Experiments with 1 & 2 labeled examples. Precision at 5,10,25, and 50 results in retrieving examples from the
same class as the single labeled example (left) or two labeled examples (right).
ones presented here can be devised; this is
potentially large area of interest. Second, we used a
simple graph structure that did not incorporate all of
the available domain information (e.g. all the labeled
examples are at the beginning). Using the graph
structure to encode domain knowledge will be very
relevant in new domains as well. Further, graph
pruning algorithms are of interest, especially in the
cases in which domain knowledge may not be
readily available; as was seen in the experiments,
more connections do not imply improved
performance. Finally, this test was conducted over a
period of approximately 3 months with real
examples of rapidly shifting news stories that
exemplify current news-aggregation-site challenges;
longer tests are forthcoming.
REFERENCES
Topic Detection and Tracking Evaluation,
http://www.nist.gov/speech/tests/tdt/
Allen, J. (2002) Topic Detection and Tracking: Event-
Based Information Org., Springer.
Mori, M. Miura, T. Shioya, I. (2006) Topic Detection
And Tracking for News Web Pages, IEEE/WIC/ACM
International Conference on Web Intelligence, 2006.
Baluja, S., Seth, R., Sivakumar, D., Jing, Y., Yagnik, J.,
Kumar, S., Ravichandran, D., Aly M., (2008) Video
Suggestion and Discovery for YouTube: Taking
Random Walks Through the View Graph (WWW-
2008).
Pomikalek, J., Rehurek, R. (2007) The Influence of
preprocessing parameters on text categorization,
Proceedings of World Academy of Sci, Eng. Tech, V21
McCallum A. and Nigam, K. (1998) A comparison of
event models for Naïve Bayes text classification,
AAAI-98 Workshop on Learning for Text
Categorization.
Cortes, C. & Vapnik, V. (1995). Support-Vector
Networks. Machine Learn. J., 273-297.
Joachims T. (2002), Learning to Classify Text Using
Support Vector Machines. Dissertation, Kluwer, 2002.
(code from svm-lite: http://svmlight.joachims.org/)
Joachims T. (1999), “Transductive Inference for Text
Classification using Support Vector Machines”.
International Conference on Machine Learning
(ICML), 1999.
Cohen, E.; Datar, M.; Fujiwara, S.; Gionis, A.; Indyk, P.;
Motwani, R.; Ullman, J.D.; Yang, C. (2001) Finding
interesting associations without support pruning.
Knowledge and Data Engineering, V13:1
Gionis, A., Indyk, P., Motwani, R. (1999), Similarity
search in high dimensions via hashing. Proc.
International Conference on Very Large Data Bases,
1999.
Brin, S. and Page, L. (1998). The anatomy of a large-scale
hypertextual web search engine. Comp. Nets 30
Zhu, X. (2005) Semi-Supervised Learning with Graphs.
Carnegie Mellon U., PhD Thesis.
Zhu, X., Ghahramani G., and Lafferty, J. (2003). Semi-
supervised learning using Gaussian fields and
Harmonic Functions , in International Conference
on Machine Learning-20.
Szummer, M. & Jaakkola, T. (2001) Partially labeled
classification with Markov random walks. NIPS-2001.
Azran, A. (2007) The Rendezvous Algorithm: Multiclass
semi-supervised learning with markov random walks.
In International Conference on Machine Learning -24,
2007.
Baluja, S. & Covell M. (2008) Audio Fingerprinting:
Combining Computer Vision & Data Stream
Processing, Int. Conf. Acoustics, Speech and Signal
Processing (ICASSP-2008).
Ifrim, G. & Weikum, G.,(2006) Transductive Learning for
Text Classification using Explicit Knowledge Models,
PKDD-2006
Project for Excellence in Journalism (2008). “A Year in
the News”, The State of News Media 2008: An Annual
Report on American Journalism.
http://www.stateofthenewsmedia.org/2008/index.
php
KDIR 2009 - International Conference on Knowledge Discovery and Information Retrieval
182
