
MODELING ERP BUSINESS PROCESSES USING LAYERED
QUEUEING NETWORKS
Stephan Gradl, Manuel Mayer, Holger Wittges and Helmut Krcmar
Technische Universität München, Boltzmannstrasse 3, Garchin, Germany
Keywords: Performance Modeling, ERP Systems, Layered Queueing Networks.
Abstract: This paper presents an approach how to simulate enterprise resource planning systems (ERP) using Layered
Queueing Networks (LQN). A case study of an existing production planning process shows how LQN
models can be exploited as a performance analysis tool. To gather data about the internal ERP system’s
architecture, an internal trace is analyzed and a detailed model is built to evaluate system’s performance and
scalability in terms of response times with an increasing number of users and CPUs. It is shown, that the
solving results match the characteristics in practice. Depending on the number of CPUs, constant response
times are observed up to a certain number of concurrent users.
1 INTRODUCTION
When dealing with performance analysis of modern,
multi-tiered enterprise resource planning systems
(ERP), many system developers rely on their
intuition or expert opinions instead of methodically
evaluated data. However, a systematic approach is
vital for effective performance evaluation, to
identify potential bottlenecks, and to increase
efficiency and productivity.
In this paper we are looking into the internal
structure of a SAP® ERP system measuring
performance data, namely, response times of
different components the ERP system consists of.
The architecture is then modeled using Layered
Queueing Networks (LQN), an extension of the
commonly used Queueing Networks (QN). The
layered structure of LQN is especially suited to
model component-based, multi-tiered applications
(Ufimtsev and Murphy, 2006) and will be described
in detail in Section 2. As shown in (Gradl et al.,
2009) by simulating an exemplary business
transaction, the proposed LQN approach delivers
reasonable data. To take a step forward, in this paper
we analyze an entire production planning process
and simulate the model using LQNs (Woodside,
2002).
The paper is organized as follows:
Section 2 gives an overview on related work in
this research area. Section 3 provides an
understanding of SAP ERP system components,
while in Section 4, a short introduction to the LQN
modeling formalism is given. Section 5 presents a
detailed case study of simulating a realistic business
process using LQN. Finally, the paper is
summarized in Section 6.
2 RELATED WORK
Due to their robustness and flexibility, LQN Models
are used for the performance prediction of a great
variety of objects. Much work is done in the area of
creating LQN models from existing models of
different types. In the area of service oriented
architectures, D’Ambrogio and Bocciarelli (2007)
introduce a transformation framework that creates
LQN models of composite services out of an UML
Activity Diagram which is derived in the step before
from a BPEL description of composite service.
In the area of component based software
engineering, there is another transformation
framework which creates LQNs out of a Palladio
Component Model (Koziolek and Reussner, 2008) to
predict response time, throughput and further
important performance characteristics.
Wu and Woodside (2004) present the
“component-based modeling language”, which is an
extension of LQN to support the performance
255
Gradl S., Mayer M., Wittges H. and Krcmar H. (2010).
MODELING ERP BUSINESS PROCESSES USING LAYERED QUEUEING NETWORKS.
In Proceedings of the 12th International Conference on Enterprise Information Systems - Information Systems Analysis and Specification, pages
255-260
DOI: 10.5220/0002907202550260
Copyright
c
SciTePress
modeling of software consisting of sub-models of
components that are used several times.
A challenge when using LQN is the problem to
get enough accurate data to build the model. To
solve this problem, Jin et al. (2007) use the BMM
method to obtain necessary data for performance
prediction of legacy information systems. We
overcame this problem by using detailed traces.
Usage of SAP traces is also mentioned in the
work of Schult and Kassem (2008). Here, the traces
are utilized for recommendations regarding the
automatic customizing of a SAP system.
3 SAP ERP SYSTEM
ARCHITECTURE
To provide an understanding of the ERP system
architecture, we derive the system components from
the ERP process step-by-step by analyzing the
recorded trace and the abstraction of the trace
entries. These components are described in detail in
SAP (2010a) and Schneider (2005).
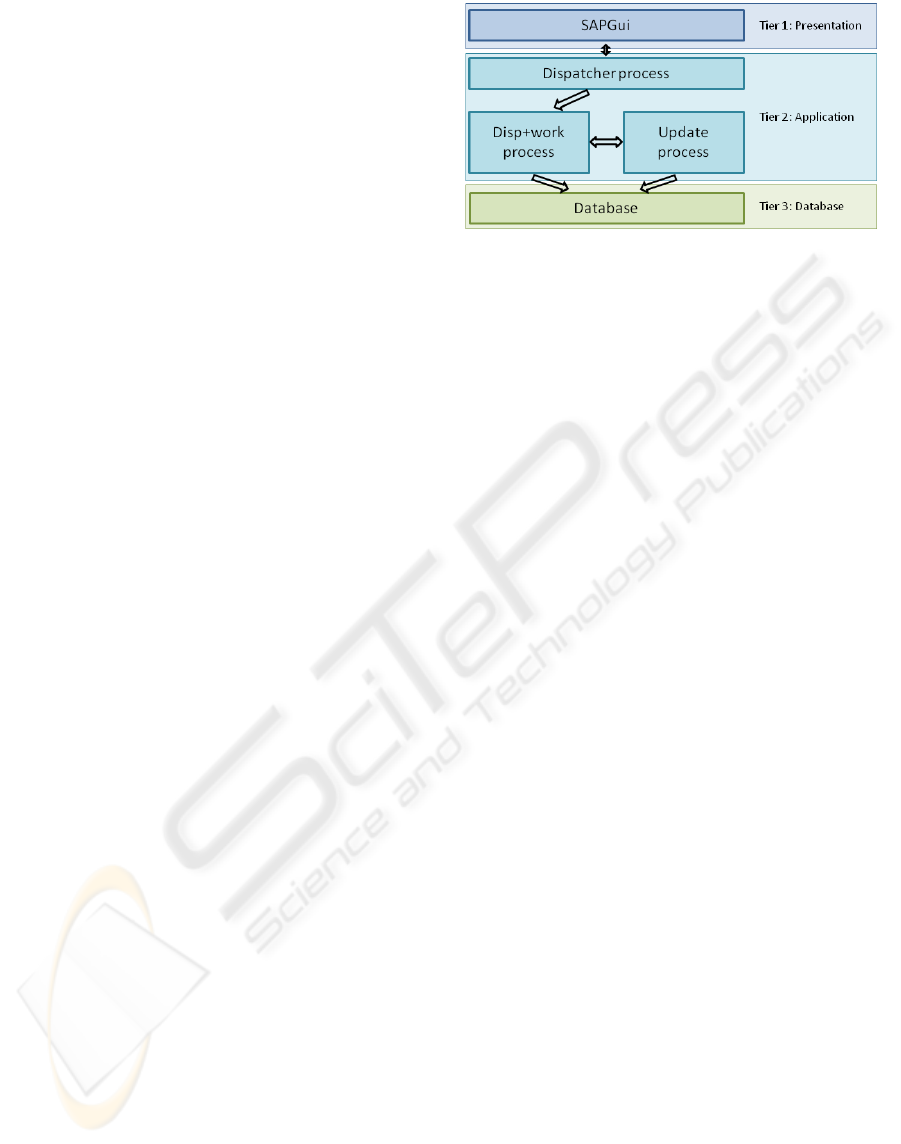
The process step of calling a program involves
many components of the SAP system (see figure 1).
Calling the transaction code causes the SAP system
to search for the associated program. These
programs are processed by the so called disp+work
processes of the SAP system after the request has
been dispatched by the dispatcher process. Such
processes are responsible for executing programs,
work on user requests and access the database. We
assume the database as a black box in our model.
The graphical output of the program is sent to the
SAPGui, and the user can start entering some data.
In the meantime, the disp+work process is free and
can process other user requests.
After the user has completed all necessary data
and decides to save the data, the SAPGui sends
those data to the disp+work process. The disp+work
process performs a validity check, and if some of the
data is not correct, an error is prompted. The user
can correct the data and try to save it again.
As soon as the input is correct, the data should be
saved to the database. This is done by the disp+work
process(es) together with a process called update
process. The process receives the data from the
SAPGui and stores the data in the corresponding
database tables.
Figure 1: Simplified SAP system’s architecture (own
exhibition).
4 THE LQN MODELING
APPROACH
4.1 Layered Queuing Networks
The main concept of LQN is the so called task. A
task can represent either a hardware resource like a
processor or a software entity. Each task has its own
infinite queue to store all the incoming requests until
they can be processed, in the case of software
entities the requests are processed by the services the
task consists of. Both software entities and hardware
can be single- or (infinite) multi-servers depending
on the number of requests that can be processed
concurrently. In the case of a software entity, an
object can be instantiated more than one time. More
CPUs or one CPU with more cores are an example
for multi-servers on the hardware side. A task may
provide more than one service. Three types of tasks
exist in a LQN model: pure client task, pure server
task, and network task. A pure client task sends
requests to other tasks only, whereas pure server
tasks are receiving requests from other tasks only.
Each service has at least one phase. A phase
consists of receiving a request, working on it, and
sending the results back. Due to minimization of the
response time, there is often work to be done after a
request was processed. This work can be modeled as
a second phase of a service.
A correctly modelled system with correct
layering results in a directed and acyclic graph that
shows all possible sequences in this model. This
prohibits the model from dead-locks and infinite
loops.
ICEIS 2010 - 12th International Conference on Enterprise Information Systems
256

4.2 Special Modeling Requirements for
ERP systems
ERP systems usually consist of three tiers, namely,
the presentation, the application, and the database
layer. The application layer processes user requests
from the presentation layer and executes calculations
as well as data queries to the database layer. In
addition, layered sub-components exist within these
tiers. To be able to model such a hierarchical
architecture, the modeling approach should allow to
easily modeling different layers and their
associations. As shown by Rolia and Sevcik (1995)
and Woodside (2002), the layered composition of
LQN suites the hierarchical architecture of
enterprise applications very well.
Since enterprise ERP systems must be scalable to
handle an increasing amount of user requests,
replicated servers (known as dialog instances in SAP
ERP systems) are often needed. Therefore it is
essential for an adequate modeling approach to
support multiple server architectures. As stated by
Omari et al. (2007), LQN support fast and efficient
solving of systems with replicated servers and an
accuracy that is for some cases within the bounds of
the confidence levels of the simulation.
Multiple servers, such as dialog instances, are
composed of identical sub-components. To avoid
redundancies by modeling identical architectures
within different components, the modeling approach
should support reuse of sub-models. Xu et al. (2005)
points out, that LQN are adequate for modeling and
simulation of systems with sub-models and internal
activities.
To increase the performance of data availability
in distributed enterprise applications, frequently
accessed data persists in the application server’s
main memory. In SAP ERP systems, the cache
configuration is essential for the overall system
performance. Data requests answered from internal
caches are up to 100 times faster (Schneider, 2005).
Bacigalupo et al. (2005) argue that it is non-trivial to
extend the layered queuing models to predict the
effect of caching, using analytical solving for these
models. However, in well configured systems, the
cache hit rate while answering data requests should
be at least 99 percent. In addition, to predict the
effect of caches, the LQN models can be simulated.
To reduce complexity, at this point we restrict our
model to analyze concurrent user accesses, assuming
that all data requests are handled by caches.
Therefore, at this stage we analytically solve the
ERP system model for efficiency reasons.
5 CASE STUDY: PERFORMANCE
ANALYSIS OF PRODUCTION
PLANNING PROCESS
A main task of ERP systems is the management and
monitoring of business processes. In our case study
we look into an exemplary production planning
process, since it demands many core functionalities
like master data management or work organization.
The process is based on a SAP University
Competence Center (SAP, 2010b) case study and
includes the creation of material master data, bills of
materials, and routing (work processing sheets) for a
motorcycle, consisting of the engine, cylinder block,
cam shaft, and the chassis. For the semi finished
product, the engine, and the finished product, the
motorcycle, bills of materials and work processing
sheets are defined. These work steps, and
consequently the whole business process, are core
business processes and frequently needed in
commerce.
5.1 Procedure and Focus of Interest
First we set some goals for the performance
modeling effort and define the exemplary ERP
production planning process. Then we characterize
the system topology and the components it is
comprised of. In the third step, we characterize the
workload and develop a performance model using
LQN. After validating and refining the model, we
use it to predict system performance by running the
simulation tool. Finally, we analyze the results,
addressing the goals set in the first step as shown in
figure 2.
Figure 2: Methodology overview (own exhibition).
With more concurrent users working on the system,
the workload increases and consequently the
response times. The exact behavior of increasing
response times is of particular interest when dealing
with performance problems. In addition, the
knowledge about effects of different hardware
settings are essential for efficient system sizing.
Therefore we analyze two different aspects: in a first
step, we increase the number of concurrent users and
evaluate the corresponding response times,
expecting increasing response times with a certain
number of users, once a certain workload threshold
has been reached. The second step will be extending
Define exemplary
ERP process
Determine ERP
system’s
components
Define LQN Simulate LQN Verify
MODELING ERP BUSINESS PROCESSES USING LAYERED QUEUEING NETWORKS
257
the hardware resources by adding additional CPUs,
looking into the amount of performance
enhancement achieved
.
5.2 Develop LQN
To find the right level of abstraction, it is important
to gather enough data for the parameterization and to
have enough knowledge about the correlation and
the activities of the model components. Therefore,
we use the abstraction layer introduced in figure 1,
which is a simplified view of the structure
introduced in Schneider (2005). The SAPGui is a fat
client and the main user interface for the SAP
system. It sends requests to the system and receives
the system’s output, e.g. when starting a transaction.
As this instance is handled by users, it also includes
a so called think time, which characterizes the time
needed for user inputs. Think time is “the time
between successive commands” (Jain, 1991). We set
the time to 3 sec, which is a common value
mentioned in literature (Bacigalupo, 2005). The
dispatcher is called when a transaction is requested,
and it forwards the request to a free disp+work
process within a measured mean time of 2 ms. The
value of 2 ms has been derived from system
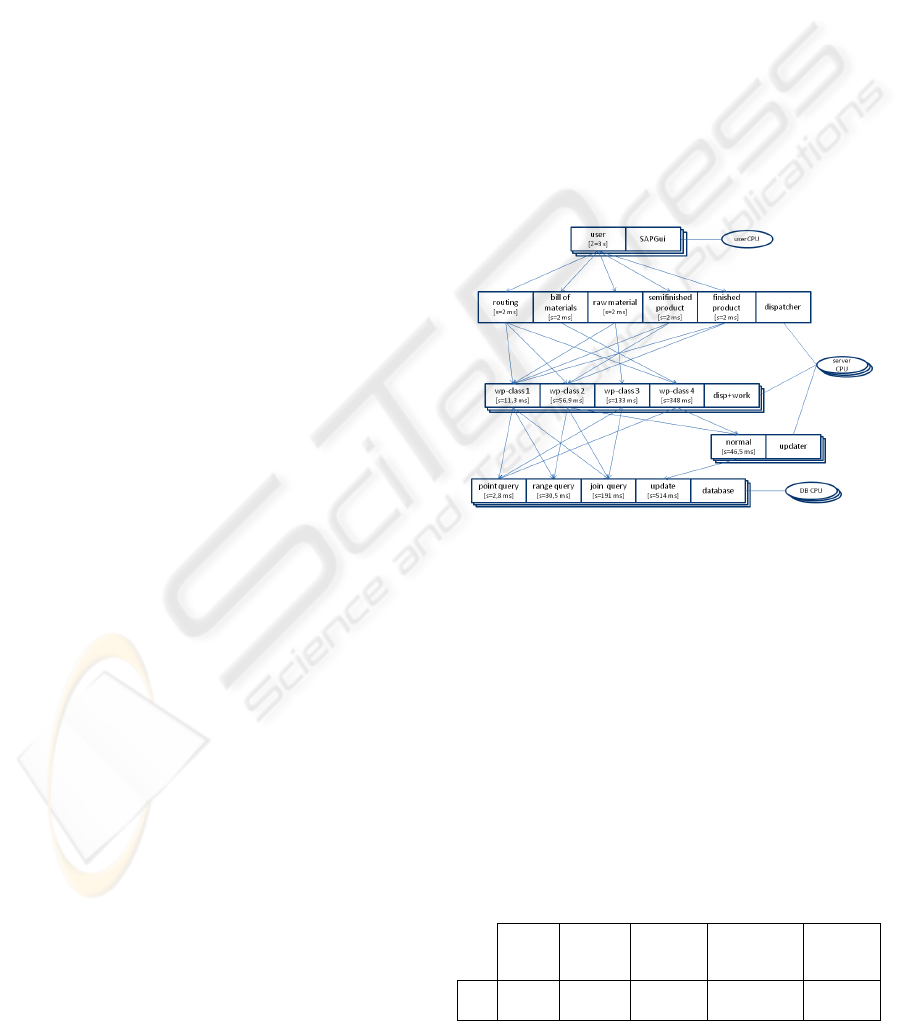
performance traces. Disp+work processes execute
the whole transaction. As this work examines the
technical performance of an ERP based business
process, there is more than one transaction involved.
Depending on the structure of the transaction and the
activities disp+work processes have to execute, we
differentiate the service times by introducing four
entries of the work process task in the model as
shown in figure 3. Updating a SAPGui screen is a
typical activity that takes only a small amount of
processing time and is aggregated in the entry “wp-
class 1” with an average service time of 11.3 ms.
Assembling data for comprehensive views takes
more processing time. Depending on the complexity
of the views and the time needed for processing, we
introduce “wp-class 2”, “wp-class 3” and “wp-class
4” with average service times of 56.9 ms, 133 ms
and 348 ms to minimize the error. The update
process is called once during program execution,
after the user presses the save button. The disp+work
process prepares the data set and activates the update
process. The trace shows an average service time of
46.5 ms.
The LQN distinguishes between four entries
depending on the type of query that is processed.
Point queries are commonly very fast, as only one
data set has to be found using fast indices. In the
average range, queries take longer as more data sets
have to be examined. The commonly longest
processing times for read accesses to the database
are shown by queries on joined tables. The longest
execution times we found in our traces are for
updates on the database. Write accesses are very
time consuming, as in the SAP environment a single
update process includes several database commits.
Therefore we introduce 4 entries for the database
task in the model, labeled “point query” (2.8 ms),
“range query” (30.5 ms) “join query” (191 ms) and
“update” (514 ms).
The program execution was performed twice, as
a warm-up phase so that internal program buffers
were filled. After the warm-up phase, the test was
executed several times to identifier potential outliers.
The LQN model uses the average of these test run
results. During the test runs, access to the SAP
system was restricted to guarantee the best
performance for the processes.
Figure 3: LQN for exemplary business process (own
exhibition).
Table 1 to 3 show how often each entry in the model
is called. Using the gathered data from the traces, an
entire LQN is built up for the exemplary business
process. Now, this model can be used for simulation
to validate the LQN. The model is said to be valid if
the performance metrics predicted by the model
match the measurements on the real system within a
certain acceptable margin of error (Kounev, 2006).
If this is not the case, the model must be refined or
calibrated to more accurately reflect the system and
workload modeled (Kounev, 2006 and Menascé et
al., 1994).
Table 1: Calls of dispatcher entries by user task.
routing
bill of
material
raw
material
semifinished
product
finished
product
user 2 2 2 2 1
ICEIS 2010 - 12th International Conference on Enterprise Information Systems
258
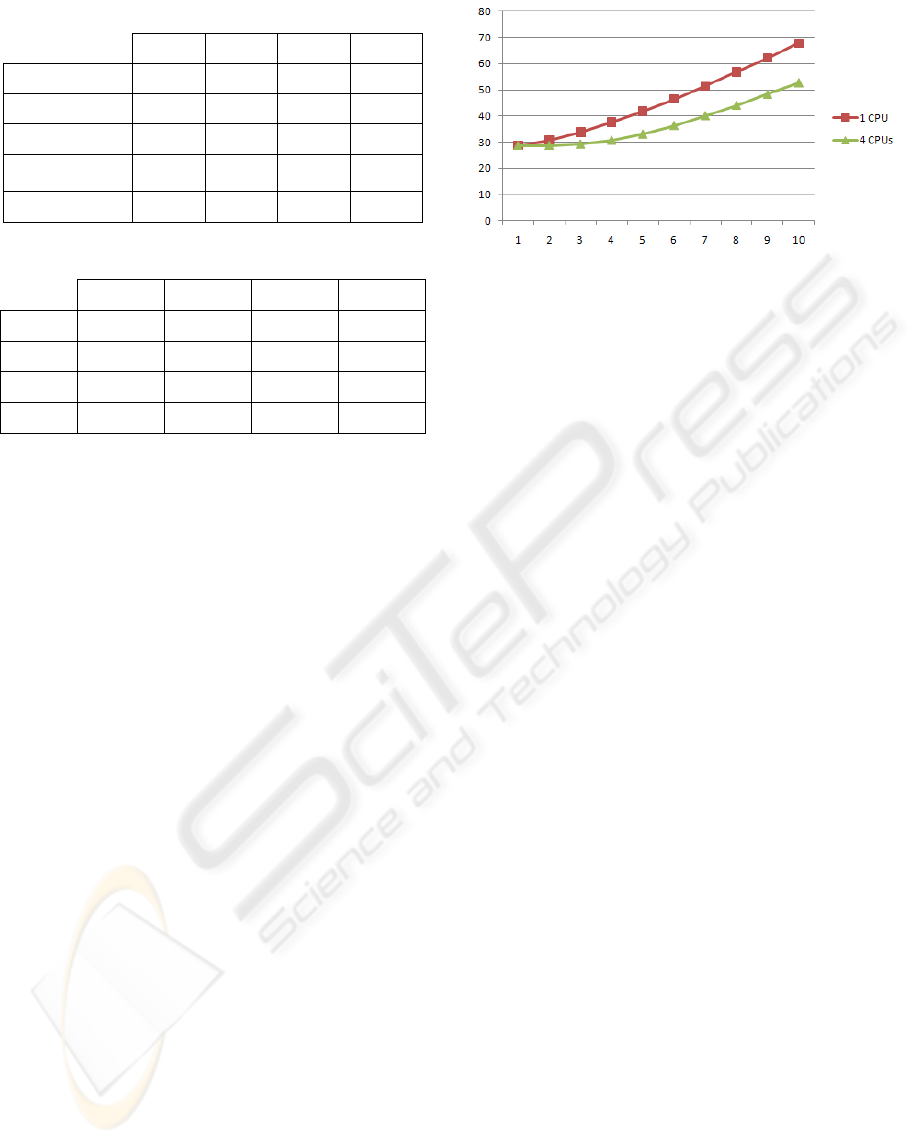
Table 2: Calls of disp+work entries by dispatcher entries.
wp-class 1 wp-class 2 wp-class 3 wp-class 4
routing 1 2 0 3
bill of material 0 0 0 1
raw material 2 0 3 0
semifinished
product
2 2 0 0
finished product 3 3 0 0
Table 3: Calls of database entries by disp+work entries.
point query range query join query update
wp-class 1 1 1 1 0
wp-class 2 0 1 1 1
wp-class 3 1 0 1 0
wp-class 4 1 0 0 1
5.3 Solving and Verifying the LQN
To the best of our knowledge, there is currently one
tool supporting LQN solving and simulation, the
LQN Solver and Simulator presented in Woodside
(2002).
Solving of layered queuing networks can be
performed by a tool called LQNS. This tool has been
developed at Carleton University upon the research
of the Real-Time and Distributed Systems Group of
Prof. C.M. Woodside.
The output of a simulation run contains lots of
information about the behavior of the elements. This
work focuses on the service time of the task
SAPGui, as this performance criterion is very
important for the correct sizing of an ERP system.
In our introduced LQN model and the measured
service times of the aggregated tasks, the ERP
process is simulated with 14 copies of the disp+work
service, and a variable number of clients by
repeating the simulation run with 10 different
configurations for the number of concurrent clients.
The focus lies on the response time at the client
level, which is an important metric for the
performance of the entire system, as this is directly
perceived by the users. Figure 4 shows the response
times of an increasing number of users in relation to
the number of processors.
In this scenario, five transactions of one ERP
process were solved. The findings based on solving
our model match the characteristics of an ERP
system in practice while processing the business
Figure 4: Response time of an increasing number of users
in relation to the number of CPUs (own exhibition).
process introduced in this case study. For validation,
we used statistical performance traces written by the
SAP system by default. By adding response times up
to get the overall response time of the whole
business process, we were able to identify a similar
behavior of response times with an increasing
number of concurrent users. Both, real system
observation and model solving, delivered constant
response times until a certain number of concurrent
users has been reached (in our case 20 users). More
concurrent users resulted in increasing response
times.
5.4 Limitations
A problem when modeling complex software
systems is the decision how many components
should be integrated in the model. Even in this little
example, the paper demonstrates that a lot of data is
gathered from several components in the SAP
system and that even the database can be described
in a more detailed way. In Herrmann (2007) an eight
level architecture was presented to limit the effort of
building the architecture of the SAP system. By
analyzing the SAP system and its traces, it was
discovered that the lowest level is the response time
level of the database. As the SAP system does not
provide more detailed information about the
database, the approach is to cut the simulation model
at this level and to treat the database as a black box.
Service time values of the database are derived
directly from the SAP system.
6 CONCLUSIONS
This paper proposes an approach towards simulating
ERP systems using Layered Queuing Networks.
Therefore, in our case study, an exemplary ERP
business process is traced inside the ERP system.
MODELING ERP BUSINESS PROCESSES USING LAYERED QUEUEING NETWORKS
259

This trace is used to determine the ERP system
components and to build the LQN. The LQN is
solved by using the LQNS tool.
The paper shows, that adding more CPU’s enables
the system to provide the same performance to a
bigger number of clients. Further research will focus
on LQN simulation, to extend system evaluation by
analyzing response time distributions and to evaluate
caching behavior as mentioned in section 4.2. In
addition, different methodologies, e.g. using QPN or
montecarlo simulation, will be compared to these
results. In the long run, a comprehensive analysis
and methodology recommendations to evaluate and
simulate ERP performance is aimed.
REFERENCES
Bacigalupo, D. A., Jarvis, S. A., He, L., Spooner, D. P.,
Dillenberger, D. N., Nudd, G. R., 2005. An
Investigation into the Application of Different
Performance Prediction Methods to Distributed
Enterprise Applications. The Journal of
Supercomputing, Vol. 34, pp. 93-111.
D’Ambrogio, A.; Bocciarelli, P., 2007. A Model-driven
Apporach to Describe and Predict the Performance of
Composite Services. WOSP’07, Buenos Aires,
Argentinia.
Gradl, S., Bögelsack, A., Wittges, H., Krcmar, H., 2009.
Layered Queuing networks for simulating Enterprise
Resource Planning systems. 7th International
workshop on Modelling, Simulation, Verification and
Validation of Enterprise Information Systems.
Herrmann, F., 2007. SIM-R/3: Softwaresystem zur
Simulation der Regelung produktionslogisti-scher
Prozesse durch das R/3-System der SAP AG.
Wirtschaftsinformatik, Volume 49, Number 2, pp.
127-133.
Jain, R., 1991. The art of computer systems performance
analysis: techniques for experimental design,
measurement, simulation, and modelling. John Wiley
& sons, Inc., Littleton, Massachusetts.
Jin, Y., Tang, A., Han, J., Liu, Y., 2007. Performance
Evaluation and Prediction for Legacy In-formation
Systems. 29th International Conference on Software
Engineering.
Kounev, S., 2006. Performance Modeling and Evaluation
of Distributed Component-Based Systems Using
Queuing Petri Nets. IEEE Transactions on Software
Engineering, Vol. 32, No. 7, July.
Koziolek, H., Reussner, R.,2008. A Model Transformation
from the Palladio Component Model to Layered
Queuing Networks. SIPEW 2008, Darmstadt,
Germany.
M. Woodside, 2002. Tutorial Introduction to Layered
Modeling of Software Performance, third ed.
http://www.sce.carleton.ca/rads/lqns/lqn-
documentation/tutorialg.pdf, accessed on: 2009/12/14.
Menasce´, D., Almeida, V., Dowdy, L., 1994. Capacity
Planning and Performance Modeling - From
Mainframes to Client-Server Systems. Englewood
Cliffs, N.J.: Prentice Hall.
Omari, T., Franks, G., Woodside, M., Pan, A., 2007.
Solving Layered Queuing Networks of Large Client-
Server Sytems with Symmetric Replication. The
Journal of Systems and Software. Vol. 80, pp. 510-
527.
Rolia, J. A., Sevcik, K. ., 1995. The Method of Layers.
IEEE Trans. on Software Engineering. Vol. 21 No. 8,
pp 689-700.
SAP 2010a, http://help.sap.com/erp2005_ehp_04/
helpdata/DE/84/54953fc405330ee10000000a114084/f
rameset.htm, accessed on: 01/18/2010.
SAP 2010b, http://www.sap-ucc.com/emea, accessed on:
01/19/2010.
Schneider, T., 2005: SAP-Performance optimierung.
Galileo Press GmbH, Bonn.
Schult, R.; Kassem, G.: Self-Adaptive Customizing With
Data Mining Methods - A Concept for the Automatic
Customizing of an ERP System with Data Mining
Methods. In Proceedings of ICEIS 2008.
Ufimtsev, A., Murphy, L., 2006. Performance Modeling of
a JavaEE Component Application using Layered
Queuing Networks: Revised Approach and a Case
Study. 5th International Workshop on Specification
and Verification of Component-Based Systems
(SAVCBS).
Wu, X., Woodside, M., 2004. Performance Modeling from
Software Components. Workshop on Simulation and
Performance.
Xu, J., Oufimtsev, A., Woodside, M., Murphy, L. 2005.
Performance modeling and prediction of enterprise
javaBeans with layered queueing network templates.
ACM SIGSOFT Software Engineering Notes, Vol. 31,
No. 2.
ICEIS 2010 - 12th International Conference on Enterprise Information Systems
260
