
TOWARDS A FINGER BASED ECG BIOMETRIC SYSTEM
Andr´e Lourenc¸o
1,2,3
, Hugo Silva
2,3
, Daniel Perna Santos
1
and Ana Fred
2,3
1
Instituto Superior de Engenharia de Lisboa, Lisboa, Portugal
2
Instituto de Telecomunicac¸˜oes, Lisboa, Portugal
3
Instituto Superior T´ecnico, Lisboa, Portugal
Keywords:
Biometric system, ECG, Unintrusive, Wireless
Abstract:
The ECG signal has been shown to contain relevant information for human identification. Even though results
validate the potential of these signals, data acquisition methods and apparatus explored so far compromise user
acceptability. In this paper we propose an ECG based biometric system that uses signals collected at the fingers
through a minimally intrusive 1-lead ECG setup. Time domain ECG signal processing is performed, following
the usual steps of filtering, peak detection, heartbeat waveform segmentation, and amplitude normalization.
We introduce two additional steps of synthetic waves generation and time normalization. Through a simple
one nearest neighbor classifier, results have revealed this to be a promising technique.
1 INTRODUCTION
As a biometric trait, electrocardiographic (ECG) sig-
nals have very appealing intrinsic characteristics as
they provide intrinsic liveliness detection, and are
strongly correlated to the subjects arousal level (Ma-
lik and Camm, 2004). Therefore, the application
of ECG for biometric purposes has been studied for
long, both under controlled and unrestrained scenar-
ios (Riera et al., 2008; Shen et al., 2002).
Recent work has shown the validity of the ECG
signal for human identification (Coutinho et al., 2010;
Li and Narayanan, 2010; Silva et al., 2007b). While
results enhance the potential of these signals, user ac-
ceptance may be limited by the data acquisition meth-
ods and apparatus. State-of-the art research has re-
vealed that, for biometric applications, a 1-lead setup
suffices; nonetheless, a chest-mounted sensor appara-
tus with pre-gelled electrodes is typically used (Shen
and Tompkins, 2005; Silva et al., 2007a).
We propose an ECG based biometric system for
human identification, that recurs to a minimally intru-
sive 1-lead setup for signal acquisition at the fingers.
Our apparatus uses dry electrodes as interface with
the skin, further improving its usability.
This work relies on time domain processing of the
ECG signal. Due to the inherent heartbeat waveform
variability, normalization must be performed in order
to obtain invariant characteristics usable for identifi-
cation. The typical steps consist of filtering, peak de-
tection, heartbeat waveform segmentation, and ampli-
tude normalization; our approach further improves on
prior art by adding two additional steps in the final
part of the process that consists of adding synthetic
waves to the collected signals and performing time-
normalization of the features.
The rest of the paper is organized as follows: Sec-
tion 2 introduces an overview of the system; Sec-
tion 3 presents the proposed signal acquisition appa-
ratus; Section 4 details the signal processing; Section
5 shows the experimental evaluation; and finally Sec-
tion 6 outlines the main results and conclusions.
2 SYSTEM OVERVIEW
The system architecture is depicted in figure 1. At the
hardware level we have the 1-lead ECG sensor setup
connected to the signal acquisition unit, that transmits
the data through a Bluetooth wireless connection to a
base station (PC).
At the base station, Matlab was used for data ac-
quisition, processing, and storage. A specific API,
BioMLab, was implemented to interface Matlab with
the wireless acquisition unit, handling the low-level
communication and signal acquisition tasks.
A signal processing block implements the signal
348
Lourenço A., Silva H., Perna Santos D. and Fred A..
TOWARDS A FINGER BASED ECG BIOMETRIC SYSTEM.
DOI: 10.5220/0003286803480353
In Proceedings of the International Conference on Bio-inspired Systems and Signal Processing (BIOSIGNALS-2011), pages 348-353
ISBN: 978-989-8425-35-5
Copyright
c
2011 SCITEPRESS (Science and Technology Publications, Lda.)
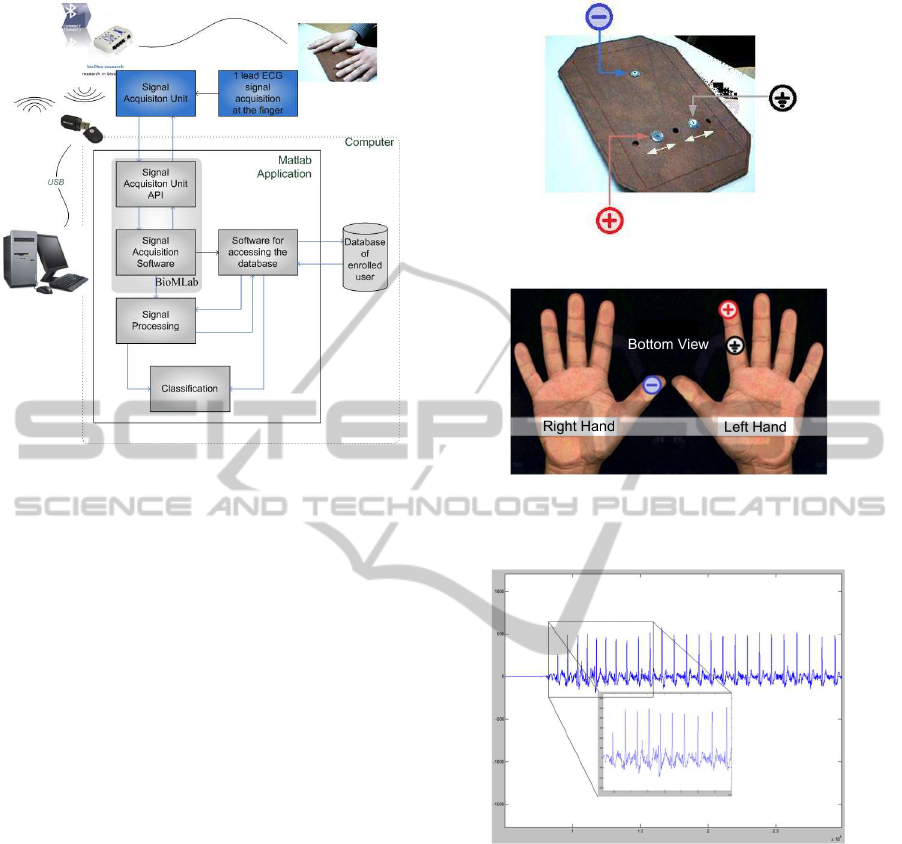
Figure 1: System Architecture.
analysis algorithms and feature extraction. Classifi-
cation is performed using the features provided by
the signal processing stage, and a database is used for
data persistence.
A simple set of functions was implemented to han-
dle the data storage and retrieval from the database.
The database itself is based on text files containing
the set of features collected from each user during the
enrollment.
3 DATA ACQUISITION
3.1 Measurement Apparatus
Advances in biosignal acquisition have led to wire-
less, wearable and unobtrusive technologies for col-
lecting ECG signals (Gamboa et al., 2010; Leonov,
2009; Cunha et al., 2007). Still, current systems are
mostly targeted at wellness and medical applications,
requiring physical contact with the subjects body at
the trunk and/or legs level. Furthermore, conductive
paste or pre-gelled electrodes are generally required.
We propose a method and apparatus for ECG sig-
nal acquisition, through a single lead setup at the fin-
gers, recurring to dry electrodes. This setup intends to
bring the usability of ECG based biometric systems to
the level of other biometric traits, in terms of signals
acquisition (Duta et al., 2002; Jain et al., 1999).
Our adjustable sensor mount andmeasurement ap-
paratus prototype is depicted in Figure 2(a). A rigid
base integrates three leads which, due to the underly-
(a) Adjustable sensor mount.
Bottom View
(b) Hands placement.
Figure 2: Signal acquisition setup.
Figure 3: Sample of an ECG signal collected at the fingers.
ing sensor design correspond to the ground, positive
and negative poles. The right hand thumb is used as
negative active pole, and the left hand index finger si-
multaneously as the positive electrode and ground, as
illustrated in figure 2(b).
The base sensor is an ecgPLUX active ECG tri-
ode, and its specifications are listed in Table 1. The
interface with the skin is done through dry AgCl elec-
trodes without the need of any gel or conductive paste.
For signal acquisition and transmission we used
a Bluetooth wireless bioPLUX research biosignal ac-
quisition unit. Table 2 describes the main specifica-
tions of this system.
Figure 3 shows an example of the signals acquired
at the fingers using the proposed setup, where the ex-
TOWARDS A FINGER BASED ECG BIOMETRIC SYSTEM
349
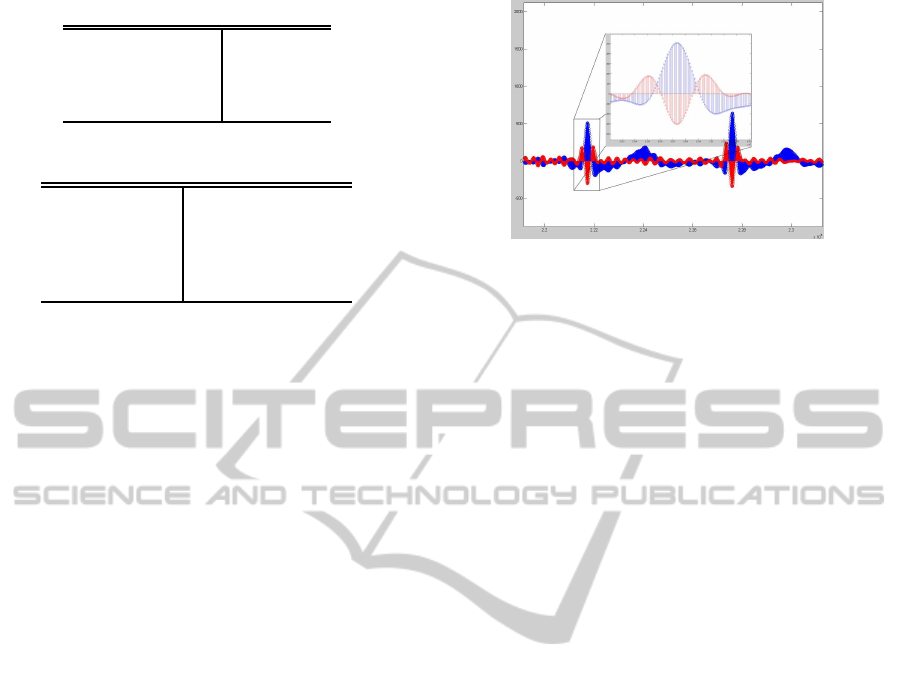
Table 1: ecgPLUX sensor specifications.
Gain 1000
Filtering 0.05-30Hz
CMRR 110dB
Input Impedance >1MOhm
Table 2: bioPLUX research specifications.
Connectivity Bluetooth Class II
Sampling Rate 1000Hz
Channels 8 An. + 1 Dig.
Size 84x53x18mm
Weight 86g
istence of the different complexes can be easily ob-
served.
3.2 Heartbeat Waveform Segmentation
The first step consists of a band pass digital filtering
of the signal, in the [0.5, 30] Hz band using a FIR fil-
ter. Theses frequencies retain the necessary informa-
tion for the proposed task while eliminating both the
baseline wander and eventual high frequency noise.
The QRS detection is performed following an
adaptation of the Englese and Zeelenberg algorithm
(Englese and Zeelenberg, 1979), found to be one of
the more robust for this purpose (Friesen et al., 1990).
The filtered ECG signal is passed through a dif-
ferentiator (eq. 1), and then by the sequence of filters
(eq. 2 and 3)
y
0
[n] = x[n] − x[n− 1], (1)
y
1
[n] = y
0
[n] − y
0
[n− 4], (2)
y
2
[n] =
4
∑
i=0
c
i
.y
1
[n− i], where c
i
= [1, 4, 6, 4, 1] (3)
In figure 4 we illustrate x[n] (in blue) and y
2
[n]
(in red). The presence of an R spike will induce a
pronounced negative lob and two positive lobs with
lower amplitude in y
2
[n].
The R peaks detection is based on two thresholds
masking the amplitude of these positive and negative
lobs. Instead of using the ones proposed in (Friesen
et al., 1990), we calculated thresholds through exper-
imental analysis of the data.
The masking the ”real” R spikes, is concluded
by computing the RR intervals based on neighbor
R spike, and using an additional verification based
on knowledge of the physiological limits of these
intervals (Chung, 2001). We consider as valid R
spikes, the ones whose neighbor R spikes rhythm is
Figure 4: Peak detection using an adaptation of (Englese
and Zeelenberg, 1979) algorithm.
within the interval [minLatency, maxLatency], where
minLatency corresponds to 150BPM and maxLatency
to 30BPM.
After the determination of the R spikes we con-
tinue with the segmentation of the ECG signal, iden-
tifying the Q and S complexes. For the identification
of these complexes we continue to use y
2
[n].
Taking as reference the identified R spike, we an-
alyze the y
2
[n] signal within its neighborhood, de-
termining the time instants were it starts to be posi-
tive and comes down to negative again, determining
the intervals [iStartQ, iEndQ] and [iStartS, iEndS].
Within these intervals we take the minimum value of
x[n] as the Q and S complexes.
The final step for determining the heartbeat wave-
form is finding the P and T complexes. For the P
complex, we look for the maximum value of x[n]
in the interval [leftMostIndex, iStartQ], where the
le ftMostIndex was determined as the R spike time
subtracted by the typical PQR latency interval upper
bound.
For the determination of the T complex we fol-
low a similar process, finding the maximum value of
x[n] in the interval [iEndS, rightMostIndex], where
rightMostIndex was determined as the R spike time
plus the typical RST latency upper bound.
We consider as valid P+QRS+T complexes, se-
quences of signals, where: a) P and T peak values
are higher than zero amplitude; and b) the P complex
starts at least within 30ms before the Q complex.
4 SIGNAL PROCESSING
4.1 Time Normalization
Changes in the heart rate typically result in the time
compression/expansion of the heartbeat waveform.
The normalization of the segmented heartbeat signal
BIOSIGNALS 2011 - International Conference on Bio-inspired Systems and Signal Processing
350
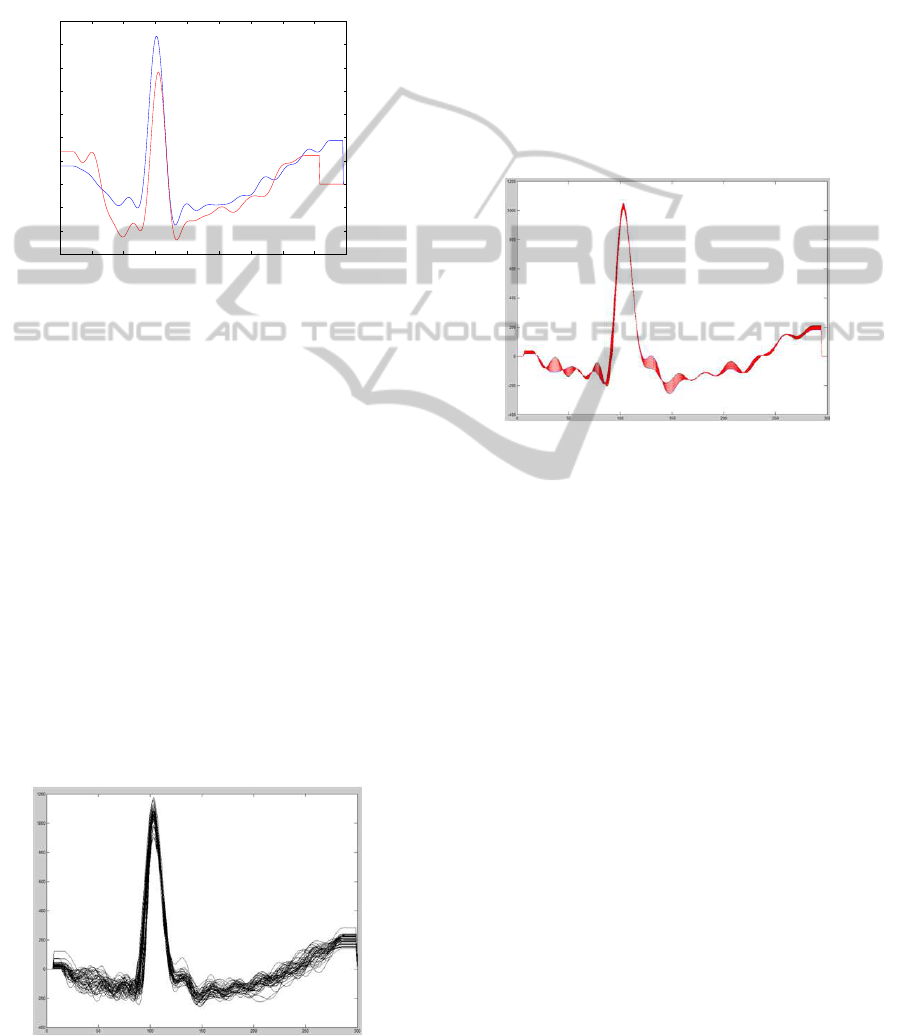
will ensure that the variability of the latencies of each
complex is reduced. Figure 5 illustrates one exam-
ple of an acquisition where the subject presented a
computed heart-rate of 133 beats per minute (BPM)
at the beginning the acquisition, and 70 BPM at the
end, showing the expansion/compressioneffect on the
waveform caused by different heart rate values.
0 50 100 150 200 250 300 350 400 450
−300
−200
−100
0
100
200
300
400
500
600
700
Figure 5: Hearbeat waveforms at different heart rates (133
BPM and 70 BPM).
Usually, the normalization of the segmented sig-
nals is performed decimating the signal in between a
fixed window centered around the R spikes. In this
work we followed a non-uniform decimation proce-
dure which doesn’t use fixed time windows, but the
ECG signal fiducial points themselves. This proce-
dure is dividedin two parts: decimation of the interval
between the beginning of the P complex until the R
spike; decimation of the interval between the R spike
and the end of the T complex.
The devised algorithm samples these intervals so
that each pattern has the same number of samples
independently of the expansion/compression of the
heartbeat waveforms. The resulting normalized sig-
nals will all have the same number of samples and the
R peak in the same time instant. In figure 6 we present
an example of the time normalized signals obtained
during one acquisition.
Figure 6: Example of time normalized signals.
4.2 Mean Waves vs. Synthetic Waves
In previous works (Coutinho et al., 2010; Silva et al.,
2007b), in order to minimize the effect of outliers, the
mean wave computed from 10 consecutivesegmented
heartbeat waveforms was used.
We propose an approach based on the generation
of synthetic waves based on the waves already seg-
mented. This procedure generates synthetic waves
with increasing amplitudes between the envelope de-
limited by the amplitudes of two consecutive waves
collected from the signal. Figure 7 illustrates in
red synthetic waves generated between two original
waves.
Figure 7: Synthetic wave generation.
4.3 Amplitude Normalization
The ECG signal processing is only concluded with
the amplitude normalization step. We followed two
different approaches. In the first approach we take
the segmented time-normalized signals and normalize
it to a constant amplitude. We use as normalization
factor the average of the amplitude of the obtained R
peaks.
In the second approach we start with the previous
procedure, but followed by the addition of a constant
with the value of 10% of the normalization factor.
This value normalizes the intra-subject heartbeat am-
plitude while preserving the inter-subject amplitude
differences. The percentage was empirically deter-
mined by experimentally analyzing the data.
5 EXPERIMENTAL EVALUATION
5.1 Classification
Our identification system is based on pattern match-
ing; the individual heartbeat waveforms are extracted
from the ECG signal trace, added together, and the
TOWARDS A FINGER BASED ECG BIOMETRIC SYSTEM
351

amplitudes from each sample of the normalized heart-
beat waveforms are the features used by the classifier.
We recurred to a simple 1−NN classifier with the
Euclidean distance as a metric function. In the identi-
fication stage, the distance between the unknown pat-
tern, X
u
, and each pattern, X
i
, in the database is com-
puted, and the unknown pattern is considered to be-
long to the same class w
i
of the pattern X
i
with lower
Euclidean distance.
ˆw
u
= w
i
: i = argmin
i
|X
u
− X
i
| (4)
For the evaluation of the system we populated a
database with acquisitions of 11 subjects. For each
user we collected 2 minutes of ECG signal at the fin-
gers using the proposed apparatus. The first minute
was used for enrolment and the second for test.
5.2 Results
Different experiments were conducted evaluating the
different possible combinations of signal processing.
Due to space limitation we present only two:
Experiment (A). Non-uniform time normalization
of the segmented heartbeat; normalization in am-
plitude; mean wave; no synthetic waves genera-
tion; as features we consider the full wave.
Experiment (B). Non-uniform time normalization
of the segmented heartbeat; normalization in am-
plitude; addition of synthetic waves; as features
we consider the full wave.
Figure 8 presents the distance matrices obtained
with the proposed methodology for experiments (A)
and (B). The element i, j of the matrix represents the
distance from the subject i to the subject j, accord-
ing to the set of features used. In the presented color
scheme, blue is attributed to values close to zero, rep-
resenting subjects with very similar features, and red
is attributed to values close to one, representing sub-
jects very dissimilar.
In the matrices of Figure 8 we see that there are
very few entries with blue color, except in the diag-
onal, which represents the distance from the subject
to himself. This characteristic is important in order
to have a high true positive rate (TPR). The main dif-
ference from figure 8(a) to figure 8(b) is that in the
later the diagonal matrix is closer to one giving better
results concerning the TPR.
If we use as threshold for decision th = 0.87 over
figure 8(a), we obtain as decision the matrix found in
figure 9, corresponding to the situation of equal error
rate (EER) of 9,09%, and to a true positive rate of
(TPR) 90,91 %.
(a) Experiment (A).
(b) Experiment (B).
Figure 8: Distance matrix for the performed experiments.
Figure 9: Decision for the experiment (A) using as thresh-
old 0.87.
In Figure 10 we show the ROC curve for experi-
ments (A) and (B), summarizing the performance of
the proposed system.
6 CONCLUSIONS
This paper describes a methodology and apparatus for
human biometric identification based on 1−lead fin-
ger ECG signals. Our goal wasto provide the building
BIOSIGNALS 2011 - International Conference on Bio-inspired Systems and Signal Processing
352

Figure 10: ROC curve.
blocks for an unintrusive real-time biometric system
based on the ECG.
We have devised a measurement apparatus that
only requires contact with the subject hands with-
out the need of pre-gelled electrodes or conductive
paste, providing a signal acquisition setup similar to
the ones already used by other, largely accepted, bio-
metric traits.
Experimental evaluation has shown promising re-
sults, as the proposed approach allowed us to obtain
a 9.09% EER and 90.91% TPR on a group of 11 sub-
jects, from the signals collected at the fingers.
Future work will focus on extending the subject
base and experimenting alternative feature analysis
and classification methods, targeting a continuous
real-time system.
ACKNOWLEDGEMENTS
This work was partially funded by Fundac¸˜ao para a
Ciˆencia e Tecnologia (FCT) under grants PTDC/EIA-
CCO/103230/2008 and SFRH/BD/65248/2009 and
Departamento de Engenharia de Electr´onica e
Telecomunicac¸˜oes e de Computadores, Instituto Su-
perior de Engenharia de Lisboa, whose support the
authors gratefully acknowledge.
REFERENCES
Chung, E. (2001). Pocket Guide to ECG Diagnosis, 2nd Ed.
Willey-Blackwell.
Coutinho, D. P., Fred, A., and Figueiredo, M. (2010). Per-
sonal identification and authentication based on one-
lead ECG using ziv-merhav cross parsing. In Proc.
International Workshop on Pattern Recognition in In-
formation Systems, pages 15–24.
Cunha, J., Cunha, B., Xavier, W., Ferreira, N., and Pereira,
A. (2007). Vital-jacket: A wearable wireless vital
signs monitor for patients’ mobility. In Proceedings
of the Avantex Symposium.
Duta, N., Jain, A., and Mardia, K. (2002). Matching of
palmprint. Pattern Recognition Letters, 23(4):477–
485.
Englese, W. and Zeelenberg, C. (1979). A single scan algo-
rithm for QRS detection and feature extraction. IEEE
Comp in Card, pages 37–42.
Friesen, G., Jannett, T., Yates, M.J. S., Quint, S., and Nagle,
H. (1990). A comparison of the noise sensitivity of
nine QRS detection algorithms. IEEE Transactions
on Biomedical Engineering, 37(1):85 –98.
Gamboa, H., Silva, H., and Silva, F. (2010). Patient tracking
system. In Proc. ICST International Conf. on Perva-
sive Computing Technologies for Healthcare.
Jain, A., Ross, A., and Pankanti, S. (1999). A prototype
hand geometry-based verification system. In Proc.
of the 2nd Int‘l Conference on Audio- and Video-
based Biometric Person Authentication (AVBPA),
pages 166–171.
Leonov, V. (2009). Wireless body-powered electrocardiog-
raphy shirt. In Proceedings of the Smart Systems Inte-
gration European Conference.
Li, M. and Narayanan, S. S. (2010). Robust ECG biometrics
by fusing temporal and cepstral information. In Proc.
of the 20th Int’l Conf. on Pattern Recognition (ICPR).
Malik, M. and Camm, A. (2004). Dynamic Electrocardiog-
raphy. Willey-Blackwell.
Riera, A., Dunne, S., Cester, I., and Ruffini, G. (2008). Star-
fast: a wireless wearable EEG/ECG biometric system
based on the enobio sensor. In Proceeding of the Inter-
national Workshop on Wearable Micro and Nanosys-
tems for Personalised Health 2008.
Shen, T. and Tompkins, W. (2005). Biometric statistical
study of one-lead ECG features and body mass index
(BMI). In Proc. of the 27th Int’l Conf of the IEEE
EMBS, pages 1162–1165.
Shen, T., Tompkins, W., and Hu, Y. (2002). One-lead QRS
for identity verification. In Proceedings of the Second
Joint EMBS/BMES Conference, pages 62–63.
Silva, H., Gamboa, H., and Fred, A. (2007a). Applicability
of lead v2 ECG measurements in biometrics. In Med-
e-Tel 2007 Proceedings, pages 177–180.
Silva, H., Gamboa, H., and Fred, A. (2007b). One lead
ECG based personal identification with feature sub-
space ensembles. In 5th International Conference on
Machine Learning and Data Mining, pages 770–783.
TOWARDS A FINGER BASED ECG BIOMETRIC SYSTEM
353
