
EXPLORING THE RELATIONSHIP BETWEEN BUSINESS AND
IT ARCHITECTURE AND TO DEVELOP A MEASUREMENT
MODEL FOR BUSINESS CRITICAL SERVICES
Péter Fehér and Zoltán Szabó
Department of Information Systems, Corvinus University, Fővám tér 8, Budapest, Hungary
Keywords: IT service management, Service measurement, Architecture modelling, Complex architectures, Service
structures.
Abstract: This research paper summarises the experiences of a research and development project that was aimed to
explore the relationship between business and IT architecture and to develop a measurement model for
Business Critical Services. The paper presents the main research milestones and results, while summarising
the research experiences and challenges. The document includes not only the research results, but also the
used methodology and approach. The research, utilising architecture modelling frameworks, elaborated an
architecture based structure for services and measurement in a Hungarian Bank. By combining service,
process and infrastructure models the KPIs of different architecture levels have been aligned and a
systematic and integrated measurement concept was developed.
1 INTRODUCTION
Researching the relationship between business and
IT architectures is a popular, although complex and
challenging research area, in which researchers can
analyse the relationship between different services,
documentation of IT infrastructure or measuring and
interpreting architecture elements.
In the complex environment of IT dependent
organisations, such as telecom and financial
institutions, raises the challenge of defining and
controlling IT enabled business services. In these
organisations business dependent services mainly
rely on virtual internal IT environments that can be
changed dynamically, based on the changing
requirements. This environment – that can be
labelled as internal cloud – has serious impact on
business performance.
In our research, the practice of a Hungarian Bank
was analysed. The research had to face the
challenge, that both business and IT services are
only weakly defined, and the link between the two
areas in just hypothetical.
The research targeted to explore the following
questions, based on specific organisational data:
1. How to model the relationship between
business process, business operations and IT
services (business and IT architecture
alignment)
2. What is the required granularity of IT service
definition, in order to effectively support
business operations.
3. How to model the relationship between the
required support of business operation and IT
infrastructure items?
4. How to define and interpret business and IT
service availability?
5. How to measure business and IT service
availability?
In order to answer these questions, the research
aims to explore the business and IT architecture of
the organisation (business processes, business
products and services, IT services), and to model the
relationship between architecture items.
2 ARCHITECTURE MODELLING
APPROACHES
An architecture is the fundamental organization of
something, embodied in its components, their
relationships to each other and the environment, and
the principles governing its design and evolution.
319
Fehér P. and Szabó Z..
EXPLORING THE RELATIONSHIP BETWEEN BUSINESS AND IT ARCHITECTURE AND TO DEVELOP A MEASUREMENT MODEL FOR BUSINESS
CRITICAL SERVICES.
DOI: 10.5220/0003393703190322
In Proceedings of the 1st International Conference on Cloud Computing and Services Science (CLOSER-2011), pages 319-322
ISBN: 978-989-8425-52-2
Copyright
c
2011 SCITEPRESS (Science and Technology Publications, Lda.)

Enterprise Architecture is the organizing logic
for business processes and IT infrastructure
reflecting the integration and standardization
requirements of the firm’s operating model. EA is
conceptual blueprint that defines the structure and
operation of an organization. (Spewak,1993)
An architecture framework is a toolkit which can
be used for developing a broad range of different
architectures.
Architectural domains are a structuring criterion
for a collection of architecture products.
Architecture frameworks defines usually 3-4
domains/ areas, that structures the outcomes of
architecture planning. Typical results are: Business
architecture, Information systems architecture, often
subdivided into Data architecture, Application
architecture, and Technical architecture.
During the research several architecture
frameworks were analysed, in order to find which
approach should be selected for service modelling.
The Enterprise Architecture Reference
Traditional Model offers clear distinction between
the architecture domains (Business, Information/
Data, Application/Integration and Technical/
Infrastructure).
The Zachman Framework is an Enterprise
Architecture framework for enterprise architecture,
which provides a formal and highly structured way
of viewing and defining an enterprise.
Capgemini’s Integrated Architecture Framework
has evolved based on the real-world experience, and
continues to provide strong focus on the need to
understand the business needs and drivers, and for
all aspects of the architecture and all architectural
decisions to be traceable back to these business
priorities (Mulholland and Macaulay, 2006).
The GAME architecture approach is strongly
based on the general categories of business,
application, data and infrastructure, but completes
with security and governance architecture.
The Department of Defense Architecture
Framework (DoDAF) provides a foundational
framework for developing and representing
architecture descriptions, it establishes data element
definitions, rules, and relationships and a baseline
set of products for consistent development of
systems, integrated, or federated architectures.
TOGAF (2009) is a high level and holistic
framework for assisting in the acceptance,
production, use, and maintenance of enterprise
information architectures. Practical and proven, it is
based on an iterative process model supported by
best practices and a re-usable set of existing
architectural assets.
The approach of McKinsey for architecture
structures (Buckow-Rey, 2010) tends to integrate the
Business and IT views of an organisation. This
approach focuses on the problem of architecture
complexity that became common in big
organisations with diversified activities.
Analysing the methodological part of the
projects 8 architecture modelling approaches were
analysed. The analysis focused on the following
issues:
• Modelling structure, layers, categories and
relationships
• Service definitions
• Measurement requirements
Based on these main aspects the TOGAF and
DoDaF architectures were the most suitable for
further investigation, although neither approaches
can be used as they are.
During modelling, the project has strongly built
on the previously presented architecture modelling
approaches, and the project follows the generally
accepted main architecture groups, as: business
architecture, service architecture, IT architecture
(including data, application and technology
architecture). As the part of the business architecture
the research emphasise the importance of processes,
as part of the business architecture. Services for
customers and even internal services are created
through processes.
3 MEASUREMENT MODEL
Enterprise Architecture approaches covers both
business and IT areas. These frameworks define
building components, relationships, that often
determined by a specific goal. In order the
emphasize the importance of business and IT
performance measurement, not only output
indicators, but hidden factors should be also
explored. Business indicators inherited in business
performance (Kellen, 2003), but fails to incorporate
IT performance.
The service can be seen as the aggregate of key
business functions. In order to be able to manage
and improve the value creation ability of the service
we have to control the process which provides the
service therefore measure the process.
The more sophisticated control we want over a
process, the more depth we should measure.
What can we gain from the measurement:
• know the current state of the services, therefore
know the service availability,
CLOSER 2011 - International Conference on Cloud Computing and Services Science
320

• notice trends (both in business and it processes)
hence predict incidents before the occur, be
prepared for changes,
• get better resolution times by finding the root
causes earlier,
• know the utilisation of resources therefore
optimise capacity.
Although every organisation uses the same or
very similar technologies – the system architectures
and business processes are different, there is no
commonly agreed and fit for all set of measurement
points.
The measurement possibilities are infinite – the
used technologies and the available tools should
define what an organisation should measure. Too
many measurement points and too many events
would result in dismissing important events. It is an
optimisation effort. Monitoring or management tools
can provide a pre-set of measurements but they
differ from solution to solution.
The important factor is to know what we are
currently measuring and to be able to manage the
monitoring activities. To provide transparency and
assist the management of monitoring it is advised to
create measurement packages based on technology
and the goal of measurement.
Reactive - health-check type of measurement:
The general infrastructure measurement methods are
measuring the basic functions and parameters of
infrastructure elements e.g. fan speed, processor
temperature. The measured values are not stored in
any database, only the exceptions are logged in a file
or forwarded as an event message therefore there is
no way of analysing trends in a the series of data.
Proactive - trend analysis type of measurement:
In case of business critical IT services shareholders
do not want a single minute of disruption in the
value creation because this would mean business
losses. In order to foresee possible incidents IT has
to analyse the critical IT components measure the
operational parameters and analyse trends.
There are many levels of the architecture, where
we can measure performance parameters. For
example blade chassis and the management of the
blade farm dynamically manages the physical blade
configurations – there is no need to know the
utilisation of each blade. Performance parameters
should be measured, aggregated and stored at the
level of management.
The key performance indicators of business
services are the main factors of value creation. These
KPIs should be especially important for the
customer of the business process analyzed.
The defined KPIs of the business service are:
• Waiting time
• Process cycle times of services (e.g. Account
identification time, Customer identification
time, Customer data recording time,
transaction recording time, etc.)
The above mentioned KPIs tend to measure the
performance of business services, but lack the
measure the patterns of the real business
requirements. Patterns of Business Activities are
measured to analyse the workload profile of business
activities. These patterns present the changing
demand for a specific customer business service,
based on a special period of a day, week, month or a
year (e.g. tax day, salary day, holiday season, etc.)
The analysis of direct IT services showed that
the total business process can be broken down into
components, with two distinctive time frame – the
data input time and data processing time. Based on
interviews with the business representatives the data
processing time is low, related with the waiting time.
The Direct IT Service KPIs are usually paired with
the Support Business Service KPI-s because they are
always an action-reaction type of activity.
Application level performance indicators are rarely
measured. The performance of an application is
usually described as the performance of an
application server.
Business processes provide Customer Business
Services that require Direct IT Services. Direct IT
services are functions of application frontends. The
business activity defines the demand for Direct IT
Services (e.g. the number of queries), which are
provided by the applications with a specific
performance (e.g. response time). Performance
depends on the processing capacity provided for the
application by the technology resources (e.g.
application server).
Technology resources have utilisation and we
assume that the performance of a Direct It Service
correlates with it. Therefore application level
performance is measured on both business level, and
IT infrastructure level. Application levels indicators
are the aggregation of health check measures.
The main performance indicators of the IT
infrastructure are commonly known and accepted
because they are strongly tied with physical
hardware components. These five measures are
important because they can describe the capacity and
performance of the main infrastructure elements:
servers, network components and storages. These
measurements should be continuous; measurement
data should be collected and analyzed. These
standard measurements can contribute to all of the
potential goals of measurement.
Figure 1 summarises the project results of the
measurement structure:
EXPLORING THE RELATIONSHIP BETWEEN BUSINESS AND IT ARCHITECTURE AND TO DEVELOP A
MEASUREMENT MODEL FOR BUSINESS CRITICAL SERVICES
321
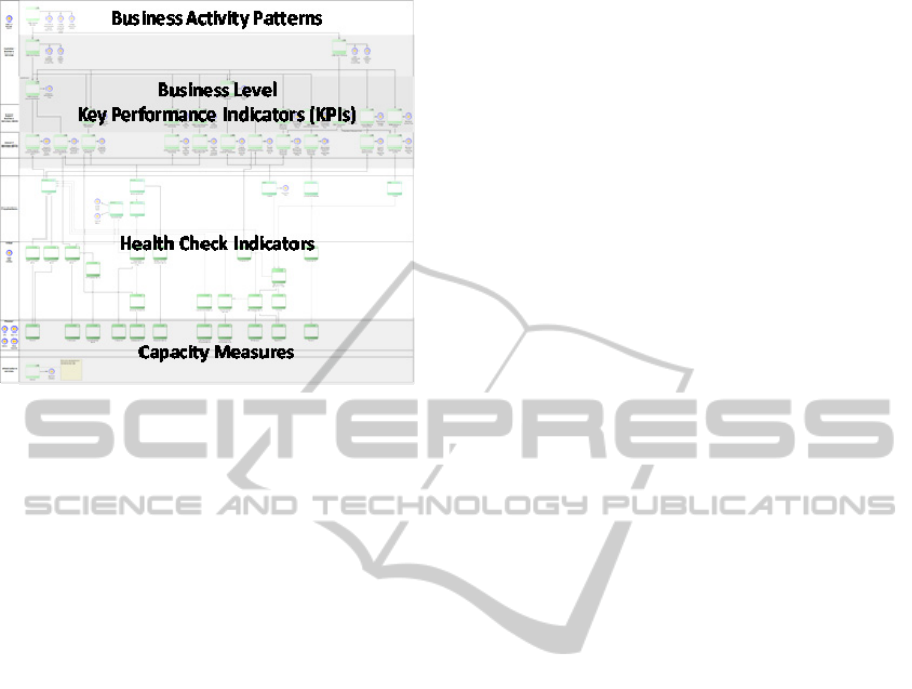
Figure 1: Top level overview of Business and IT
architecture, and related measures.
• the top layer consists of the measurement of
business activity patterns (e.g. no. of
transactions, waiting customers, etc.), that
represents the demand for IT services.
• The next layer covers customer business
services and directly supporting IT services.
These service levels can be easily measured
with performance indicators, practically
with response times.
• The next layer consists of the application and
virtual technology architecture. In this layer
performance indicators are hard to be
defined, but health-check indicators (even in
large number) can be easily measured and
visualised.
• At the bottom layer covert the physical
technology infrastructure, where capacity
data can be measured.
4 CONCLUSIONS
In complex organisations, it is rare to see detailed
models that describe business and it architectures, or
the relationship between these two areas. The
description certain architecture components are
complex in itself, exploring and recording
relationships and dependencies is more complex
challenge.
Although business-IT alignment researches have
decades long history, the theories are not adequately
represented in practice, and only partial results and
successful projects exist. Because IT services are the
gates to business (and to IT), it is vital to explore
adequate information on them. As a challenge,
international best practices (ITIL, MOF, eSCM,
eTOM, etc.) address these questions in a very high
level, and IT services expectations and interpretation
possibilities are defined very generally.
REFERENCES
Buckow, H., & Rey, S. (2010). Why business needs
should shape IT architecture. McKinsey on Business
Technology, Number 19(Spring 2010), 4-11.
Cannon, D., & Wheeldon, D. (2007). Service Operation
(United Kingdom.). TSO (The Stationery Office).
Kellen, V. (2003). Business Performance Measurement -
At the Crossroads of Strategy, Decision-Making,
Learning and Information Visualization. DePaul
University. Retrieved from http://www.kellen.net/
bpm.htm
Mulholland, A., & Macaulay, A. (2006). Architecture and
the Integrated Architecture Framework (p. 16). Cap
Gemini.
Spewak, S. H. (1993). Enterprise Architecture Planning:
Developing a Blueprint for Data, Applications, and
Technology. Wiley.
TOGAF. (2009). The Open Group Architecture
Framework, Version 9. The Open Group.
CLOSER 2011 - International Conference on Cloud Computing and Services Science
322
