
MOBILE TIMELINE
Mobile Charting System that Provides
a Graphical Summary of a Patient’s Medical Record
Keisuke Ogawa
1
, Kazunori Matsumoto
1
, Masayuki Hashimoto
1
, Tatsuaki Hamai
1
,
Akiko Shibuya
2,3
and Yoshiaki Kondo
2,3
1
KDDI R&D Labs Inc., 2-1-15, Ohara, Fujimino-shi, Saitama, Japan
2
Nihon University School of Medicine, 30-1, Oyaguchi Kami-cho, Itabashi-ku, Tokyo, Japan
3
Tohoku University Graduate School of Medicine, 1-1, Seiryo-cho, Aoba-ku, Sendai-shi, Miyagi, Japan
Keywords: TimeLine, XML, Mobile, Electronic medical records, Event merge, Medical support system, Physician.
Abstract: In this paper, we introduce a novel medical information system that works on smartphones. This system
provides chronological graphs of a patient’s medications and medical examinations over an extended period
of years as graphical summaries of the patient’s medical history so that physicians can gain a clear
understanding of the patient’s status and develop treatment plans easily. In our system, we implemented the
original algorithm that reduces the amount of medical data by merging adjacent data hierarchically when the
time span for displaying the data is changed. By implementing this algorithm, the system proposed here was
shown to be about 30 times faster than the system with a conventional method. Also, we evaluated our
system through the experiment in medicine using real medical records. The results indicate that physicians
would benefit significantly by using our system especially in situations where they cannot use another
medical information system through their PC, such as the patient’s bedside.
1 INTRODUCTION
In recent years, the use of mobile phones as a client
device in medical information systems that display a
patient’s medical data has become increasingly
popular (G.Benelli et al. 2010). Implementation of
such systems promises significant advances in
patient care because of their mobility and flexibility.
This is because today’s mobile devices, such as
smartphones, now have the capacity for a variety of
medical applications and can be used from any
location (M. Watson 2006, J. Sammon et al., 2006,
A. Kumar et al., 2009). For example, a system that
allows physicians to see and share the electronic
health records of their patients (G. Benelli et al.,
2010, F. Andry et al., 2011) has been proposed.
However, in order to diagnose a patient with a
chronic disease such as diabetes, physicians often
need not only recent medical data from the patient’s
medical record but also a chronological graph of the
medications and medical examinations that the
patient may have undergone over an extended period
of years as a graphical summary of the patient’s
medical history. Since their overall treatment time is
very long, physicians often use these graphical
summaries to analyze and ascertain a patient’s status
and develop a treatment plan. While mobile devices
are very flexible, it is extremely difficult for them to
display a graphical summary because they do not
have sufficient computing and processing capacities.
In view of these problems, we propose a brand new
mobile medical information system that overcomes
these shortcomings (K. Ogawa et al., 2011). In this
paper, we introduce actual implementations of the
system and results of a small-scale experiment
conducted at Tohoku University Hospital.
2 CONVENTIONAL MEDICAL
INFORMATION SYSTEMS
In this section we give an overview of an EMR
system and an electronic patient chart as examples
of conventional systems used in medicine.
23
Ogawa K., Matsumoto K., Hashimoto M., Hamai T., Shibuya A. and Kondo Y..
MOBILE TIMELINE - Mobile Charting System that Provides a Graphical Summary of a Patient’s Medical Record.
DOI: 10.5220/0003708300230029
In Proceedings of the International Conference on Health Informatics (HEALTHINF-2012), pages 23-29
ISBN: 978-989-8425-88-1
Copyright
c
2012 SCITEPRESS (Science and Technology Publications, Lda.)
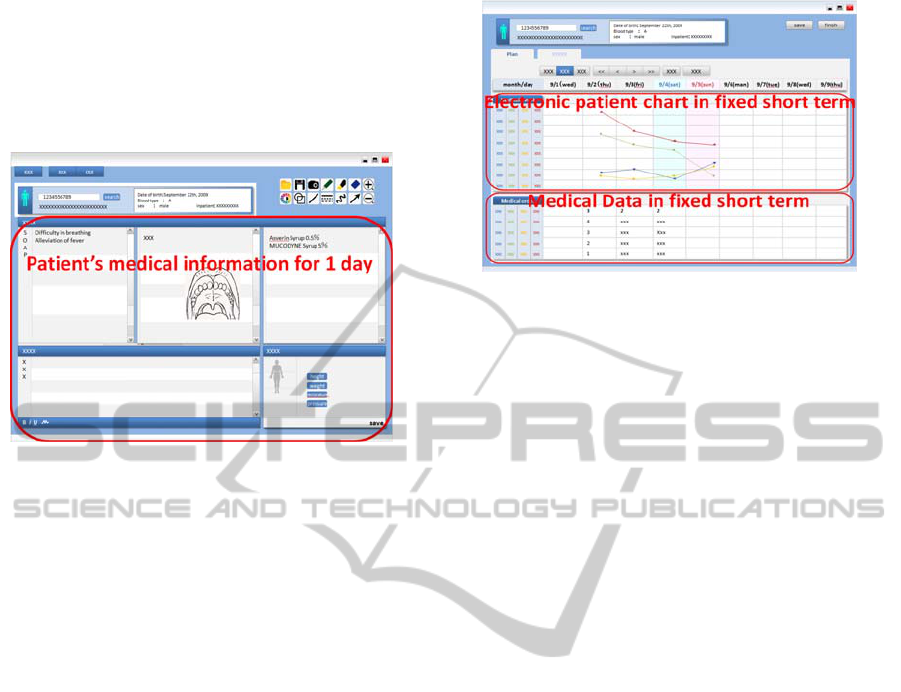
2.1 Example of EMR System
Fig.1 shows an example of a conventional EMR
system. This system has a user interface similar to
legacy paper medical records and displays the
patient’s medical information for one day.
Figure 1: EMR system.
Such systems that present first-hand medical data
obtained from a patient’s medical record are also
implemented on smartphones (F. Andry et al., 2011).
However, physicians often need to analyze a
patient’s medical history over several years (H.
Smith et al., 2006, G. L. Warnock et al., 2008). For
example, to determine a treatment plan for diabetes,
physicians must analyze medical data that have been
accumulated over several years because the disease
often progresses over a prolonged period. Therefore,
the problem with this system is that it displays the
medical data for only one day whereas the medical
data physicians need to perform a proper analysis
varies according to the patient and the disease.
2.2 Example of Electronic Patient Chart
Fig. 2 shows an example of an electronic patient
chart system. This system allows physicians to
analyze the medical information such as a patient’s
body temperature and blood pressure for a fixed
period.
However, different kinds of medical data are
generated over different intervals. For example, if a
physician needs to analyze and determine the
medications for a patient with diabetes who has the
flu, the doctor must examine the changes in the
patient over a long time span and investigate any
contraindications to a possible drug therapy over a
short time span. So the problem with this system is
that physicians cannot analyze medical data and
change the time span freely.
Figure 2: Electronic patient chart.
2.3 Limitations of Conventional
Systems
To summarize, conventional systems are unable to
sufficiently support the medical analysis that
physicians need to conduct. This is because these
systems do not have the ability to display the
patient’s chart for various diseases that occur over a
range of time spans.
3 PROPOSED TIMELINE
INTERFACE
As described in section 2, conventional medical
systems have a problem in that they are unable to
display the patient’s medical chart over a range of
time spans.
Furthermore, there is an increasing need
to be able to see patient medical data in locations not
restricted to those where they can access a
conventional medical system via a PC (M.Watson
2006, J.Smith et al. 2006, A.Kumar et al. 2009).
3.1 System Overview
In view of these problems, we propose a brand new
system that consists of a server and an application on
a mobile device. In this section, we introduce the
system implementation that we developed for use in
actual clinical practice. In our system, the server
transmits the medical data from a conventional EMR
system’s server and optimizes it. An application on a
mobile device displays the patient’s medical chart
with the TimeLine interface.
3.2 TimeLine Interface
The TimeLine interface has a function that displays
a chronological chart of the patient’s medical data
HEALTHINF 2012 - International Conference on Health Informatics
24
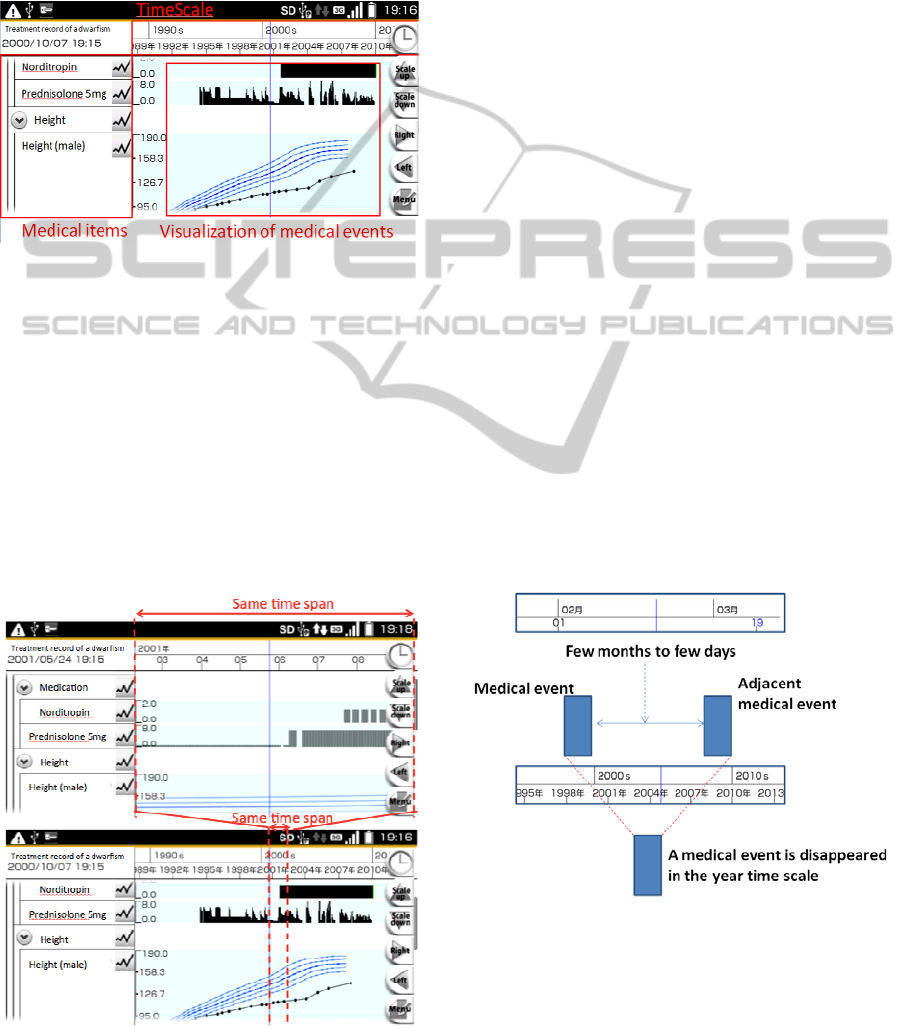
over various time spans. By means of this function,
medical data can be divided into categories called
medical items. Medical items are, for example, types
of medication or types of medical tests and so on.
Also, under each medical item, there are numerous
medical events that represent the medical services
the patient has received as shown in Fig.3.
Figure 3: TimeLine interface.
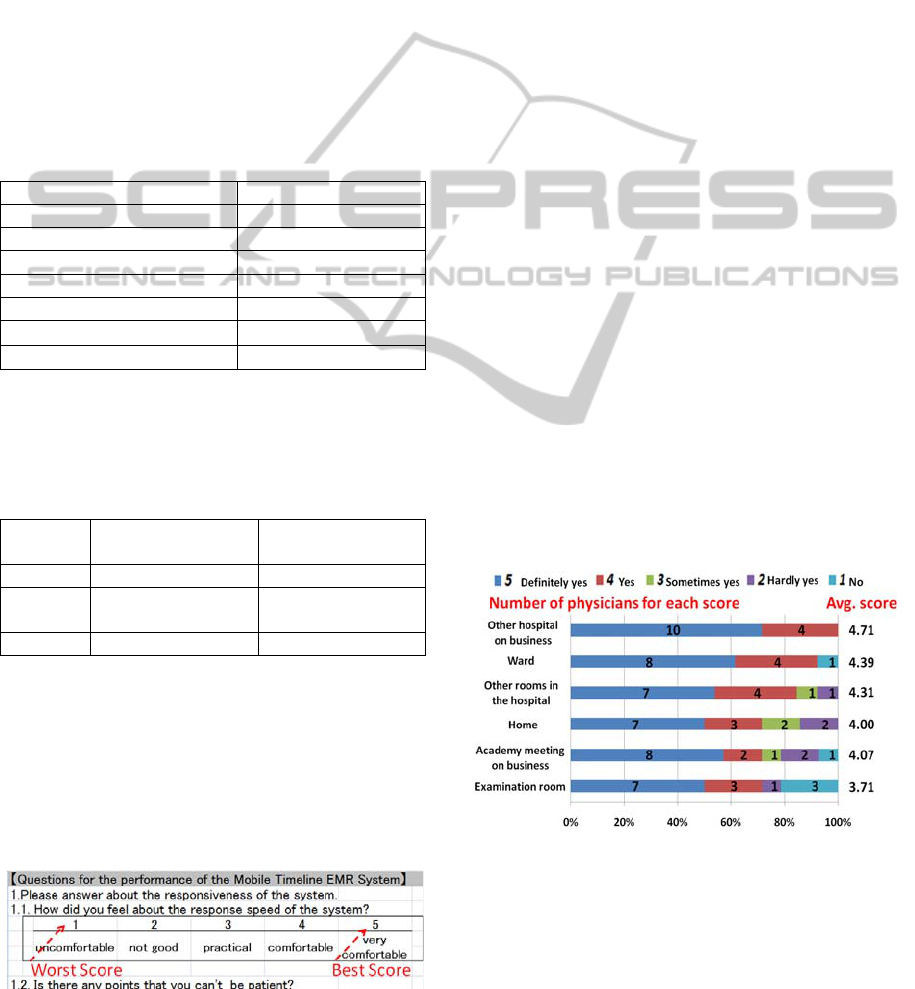
Also, TimeLine has a multistage time scale of years,
months, days, hours and so on. With the TimeLine
interface, physicians can change the time scale and
its length to display with a single easy operation
such as pinch-in/pinch-out operations on a screen of
a smartphone. For example, the time scale can be
changed from hours to days or to months. By
changing to a short time scale, physicians can
analyze medical data over a short period in more
detail. Conversely, by changing to a longer time
scale, physicians can analyze medical records over a
long period. Fig.4 shows the operation of time scales.
Figure 4: Time scale in TimeLine interface.
In this manner, physicians can analyze a range of a
patient’s medical history.
3.3 Adaptive Event Merge Algorithm
However, TimeLine requires the processing of a
large volume of data and high processing ability to
draw the charts because physicians tend to record a
large number of medical events. Take the case of a
patient with a chronic disease; medical events are
generated over a period of time measured in decades.
It takes a lot of time to process such large volumes
of data; consequently, the response speed of our
system goes down. So this is the most serious
problem of TimeLine interface. The best way to
solve this problem is to reduce the volume of data to
process. In order to do this, we developed the
adaptive event merge algorithm in TimeLine. The
purpose of this algorithm is data reduction. Because
of the resolution limit, if the user expands the time
span to be shown, all the data plots are not displayed
on the screen. Making use of this feature, the system
can reduce the volume of data to process by
reducing the data for each time scale. In other words,
if the system can process only the visible data plots
for display on a chart over a long time span, such as
the time scale for a year or ten years, we can reduce
the workload on the system. Now, the medical
events that our system processes tend to consist of
the data from medical inspections or medications
generated once a day and once every month in
average. So, the visible number of total data plots
tends to vary for a time scale of a year or longer.
Figure 5: Typical medical events in our system.
So, we created several DB tables for various
expansion rates across longer time spans, as well as
the minimum number of data tables for shorter time
spans. By using these DB tables, the system can
process only visible data for each time span. In fact,
MOBILE TIMELINE - Mobile Charting System that Provides a Graphical Summary of a Patient's Medical Record
25

we created the 20 data tables below:
Figure 6: DB tables and expansion rates.
The lower numbered tables store visible data for
shorter time spans (i.e. smaller expansion rates), on
opposite, while the higher numbered tables store
visible data for larger time spans. Also, the 3
rd
column means the expansion rates from lower
numbered tables to higher numbered tables. As can
be seen, these DB tables are designed so that the
system can process the smaller number of data when
the system represents the chart of larger time spans
(i.e. the time spans that the number of visible data
tends to change).
Now, we briefly describe the steps of this algorithm
below:
1. The algorithm represents a medical event as
structured data that includes the start time, end time,
the value, and other factors.
2. For each expansion rate, the system calculates the
distance to adjacent data objects using the formula
below.
In the formula, we use for the “nth” data object of
a patient, for the start time, for the end time, C
for a coefficient, and E for the expansion rate
between each DB table.
Formula:
3. If the distance is smaller than the threshold, the
system generates a new data object that represents
the original two data objects. This threshold
represents the distance that a person can visually
recognize. In general, this threshold is one dot on the
screen. Fig. 7 shows an example of the merging of
two medical events in XML format.
Figure 7: Event Merge in XML.
4. The system registers the data in each of the DB
tables.
5. The system generates the chart using new data
objects. Fig.8 shows how it looks like in the
TimeLine interface.
Figure 8: Adaptive Event Merge in TimeLine.
As can be seen, if the time scale changes, several
events merge adaptively. In addition, to reduce the
time required to draw the charts, we had the server
draw the chart and transmit the image to the client
device. In this manner, the system reduces data
processing and improves responsiveness.
n
d
n
ts
n
te
C
E
tets
nn
⋅
−
+1
HEALTHINF 2012 - International Conference on Health Informatics
26
4 EXPERIMENTAL RESULT
AND EVALUATION
To evaluate our system, we held a small-scale
experiment in medicine. So in this section, we
present the evaluation results obtained by physicians.
4.1 Experimental Conditions
First, the experimental conditions are introduced.
4.1.1 Evaluators
Fourteen physicians from six departments were
chosen as evaluators (Table.1).
Table 1: Evaluators.
Department Number of ph
y
sicians
Pediatrics 7
Circulator
y
Medicine 1
General Internal Medicine 1
Respirator
y
Medicine 3
Fixed Prosthodontics 1
Dentistry 1
Total 14
A smartphone and PC was used as the system’s
client device and the system’s server, respectively.
The specifications are presented in Table.2.
Table 2: Specifications of the device.
Client Mobile
Device
Server PC
OS Androi
d
Windows 7 32-
b
i
t
CPU
Snapdragon 1
GHz
Intel Core i7-
620UM 1.06 GHz
Memory 256 MB 4 GB
4.1.2 Form of the Questionnaire
All physicians answered a questionnaire designed to
evaluate the system. For each question, there were
five choices. A score of 5 represents the most
positive answer. Conversely, a score of 1 was the
most negative answer. Fig. 9 shows an example of
the questionnaire we used.
Figure 9: Example of the questionnaire.
4.1.3 Evaluation Items
The main evaluation items are listed below:
1. The situation in which physicians used the
system:
We asked where the physician used the system for
analyzing inpatients’ and outpatients’ medical data.
This result corresponds to the TimeLine evaluation
in our system.
2. The response speed of the system:
The response speed of the system is an important
factor when determining the system’s usability.
This result corresponds to the adaptive event merge
algorithm evaluation in our system.
4.2 Results
The experimental results for each evaluation item
are presented in this section.
4.2.1 Location of Use
Fig.10 shows the evaluation result for the location
where physicians analyzed outpatients’ medical data.
Each horizontal bar represents the evaluation scores
for each answer listed on the left side. Also, average
evaluation scores for each answer are shown on the
right side of the bar. (Fourteen physicians, including
a clinician from outside the hospital participated in
the survey, so the answers “other rooms” and “ward”
have 13 responses.)
Question: Do you want or need to use the system to
analyze outpatients’ medical data in these places?
Figure 10: Evaluation result for outpatients.
Fig.11 shows the evaluation result for the places
where inpatients’ medical data are analyzed.
Question: Do you want or need to use the system to
analyze inpatients’ medical data in these places?
MOBILE TIMELINE - Mobile Charting System that Provides a Graphical Summary of a Patient's Medical Record
27
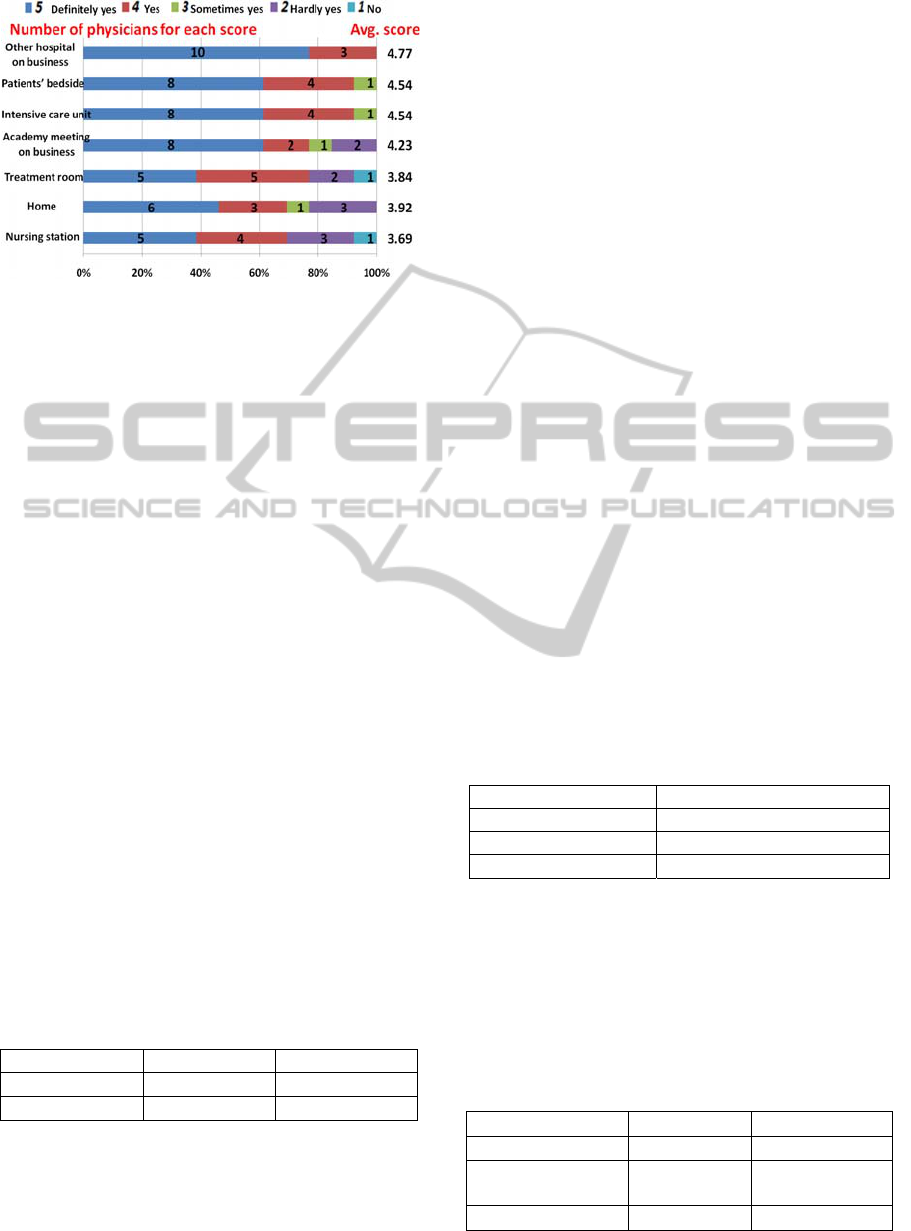
Figure 11: Evaluation result for inpatients.
As can be seen, there is a certain need to use our
system anywhere. In particular, there is a remarkable
need to use it at other hospitals, at the bedside of
patients, and in intensive care units. These are the
places where physicians cannot use conventional
medical systems in spite of the fact that they need to
refer to the patient’s medical data.
Also, these physicians can be divided into two
groups according to their department.
・Category1: Physicians who have to analyze the
medical data over a long time span (e.g., pediatrics).
・Category2: Physicians who have to analyze the a
patient’s recent medical data for short time span
(e.g., respiratory medicine).
According to these categories, evaluation results
reveal weaknesses for the situations below:
・Situation 1 (usual working situation):
ward, examination room, other rooms, patient’s
bedside, intensive care unit, treatment room, nursing
station
・Situation 2 (non-standard working situation):
working in other hospitals, academic meetings, at
home
Table 3 shows the average evaluation score for each
category.
Table 3: Average score for each category.
Situation1 Situation2
Category1
4.41 3.91
Category2
3.67 4.73
These results indicate that physicians in category 1
have a greater need to use our system in usual rather
than non-standard working situations. Conversely,
physicians in category 2 have a greater need to use
our system in non-standard working situations.
Physicians in Category 1 often need to analyze
medical information covering a long time span in
order to make a medical diagnosis. For example, the
reference values differ depending on the patient’s
age, particularly children aged less than 20 years.
Thus, pediatricians often need to analyze and
compare medical history information when creating
a medical treatment plan especially at a place where
they see their patients without access to a
conventional medical system, such as at the bedside.
On the other hand, physicians in Category 2 often
need to analyze medical information covering a
short time span in an emergency. For example, if the
condition of a patient suddenly changes, they have to
make their decisions by accessing the
contraindications for newly released medications
especially where they cannot see the patient’s
medical history with a conventional medical system,
such as outside the hospital.
4.2.2 System Response Time
In order to evaluate the performance of our system,
in addition to the physician evaluations, in another
experiment, we measured and compared the
response time of our system with adaptive event
merge algorithm and the system without it. In the
experiment, the system randomly chooses the time
span and draws a graph using medical records for
the selected time span. Data used in the experiment
are presented in Table.4.
Table 4: Number of medical events for typical patients
case (Experimental data).
Patien
t
N
umber of medical events
Diabetic 2374
N
ephrotic syndrome 7439
Dwarfis
m
8935
For each set of medical data, we repeated the
experiment 54 times and measured the average time
for drawing graphs using medical events from each
patient’s medical records. Table.5 shows the result.
Table 5: Averaged response time of proposal method
(system with adaptive event merge algorithm) and
conventional one (system without adaptive event merge
algorithm).
Patient Proposed Conventional
Diabetic 75.3(ms) 1945.98(ms)
N
ephrotic
s
y
ndrome
82.3(ms) 2966.9(ms)
Dwarfism 116.9(ms) 3216.8(ms)
HEALTHINF 2012 - International Conference on Health Informatics
28

The result indicates that our proposed method was
about 30 times as fast as the conventional method.
Additionally, we conducted a subjective evaluation
of our system’s responsiveness. Table 6 shows the
number of physicians who chose each score in
response to the question “What was your impression
of the responsiveness of our system?”
Table 6: Physicians’ evaluation for responsiveness.
Score Number of physicians
5 (excellent) 3
4 (good) 6
3 (acceptable) 4
2 (not good) 0
1 (poor) 1
As can be seen, at least 9 of 14 physicians evaluated
the responsiveness of our system as acceptable. Thus
it can be asserted that the responsiveness of our
system is sufficient for clinical use.
5 CONCLUSIONS
In this paper, we presented a new medical system.
The system has the three features listed below:
1. The client application of our system works on
mobile devices like a smartphone and can be used
anywhere.
2. The client application has a timeline interface
that visually displays the medical records of the
patient.
3. Via the adaptive event merge algorithm, the
client application responds quickly.
Due to these features, our system satisfies the
physician’s need to be able to make medical
diagnoses regardless of where they are. Through the
experiment that compared our system to the
conventional method, we showed that our system
using the adaptive event merge algorithm enables a
response at least 30 times as fast as the conventional
system. Also by conducting a qualitative evaluation,
we showed that the performance of our system is
acceptable for clinical use. Through the experiment
and the analysis of the result, we showed that there
are different usage patterns according to the
specialty of the physicians.
REFERENCES
M. Watson, 2006, Mobile Healthcare Applications: A
Study of Access Control Proceedings of the 2006
International Conference on Privacy, Security and
Trust.
J. Sammon et al., 2006, Enabling Communications for
Mobile Workers within Healthcare Environments:
MobileHCI '06, Proceedings of the 8th conference
on
Human-computer interaction with mobile devices
and services
A. Kumar et al., 2009, ELMR: Lightweight Mobile Health
Records: A Study of Access Control SIGMOD '09
Proceedings of the 35th SIGMOD international
conference on Management of data.
F. Andry, L. Wan. and D. Nicholson, 2011, A Mobile
Application Accessing Patients’ Health Records
Through A Rest Api:4th International Joint
Conference on Biomedical Engineering Systems and
Technologies.
K. Ogawa, K. Matsumoto, M. Hashimoto, T. Hamai, Y.
Kondo, 2011, Mobile TimeLine EMR System: 4
th
International Joint Conference on Biomedical
Engineering Systems and Technologies.
H. Smith et al., 2006, The Impact of Prescribing Safety
Alerts for Elderly Persons in an Electronic Medical
Record: Arch Intern Med/Vol 166
M. DesRoches et al, 2008, Electronic Health Records in
Ambulatory Care - A National Survey of Physicians:
The new England journal of medicine
G. L. Warnock et al., 2008, A Multi-Year Analysis of
Islet Transplantation Compared With Intensive
Medical Therapy on Progression of Complications in
Type 1 Diabetes: Clinical Transplantation Volume 86
- Issue 12 - pp 1762-1766
G. Benelli and A. Pozzebon, 2010, Turning a mobile
phone into an interactive multipurpose assistant in
healthcare scenarios: Biomedical Engineering Systems
and Technologies: International Joint Conference,
volume 52 of Communications in Computer and
Information Science, pages 356–368.
MOBILE TIMELINE - Mobile Charting System that Provides a Graphical Summary of a Patient's Medical Record
29
