
AUTOMATIC HOVERFLY SPECIES DISCRIMINATION
Branko Brklja
ˇ
c
1
, Marko Pani
´
c
1
, Dubravko
´
Culibrk
1
, Vladimir Crnojevi
´
c
1
, Jelena A
ˇ
canski
2
and Ante Vuji
´
c
2
1
Department of Power, Electronics and Communication Engineering, Faculty of Technical Sciences, University of Novi Sad
Trg Dositeja Obradovi
´
ca 6, 21000, Novi Sad, Serbia
2
Department of Biology and Ecology, Faculty of Sciences, University of Novi Sad
Trg Dositeja Obradovi
´
ca 2, 21000, Novi Sad, Serbia
Keywords:
Species discrimination, Wing venation, Junctions detection, Support vector machine, HOG, LBP.
Abstract:
An novel approach to automatic hoverfly species discrimination based on detection and extraction of vein
junctions in wing venation patterns of insects is presented in the paper. The dataset used in our experiments
consists of high resolution microscopic wing images of several hoverfly species collected over a relatively long
period of time at different geographic locations. Junctions are detected using histograms of oriented gradients
and local binary patterns features. The features are used to train an SVM classifier to detect junctions in wing
images. Once the junctions are identified they are used to extract simple statistics concerning the distances
of these points from the centroid. Such simple features can be used to achieve automatic discrimination of
four selected hoverfly species, using a Multi Layer Perceptron (MLP) neural network classifier. The proposed
approach achieves classification accuracy of environ 71%.
1 INTRODUCTION
Classification, measurement and monitoring of in-
sects form an important part of many biodiversity and
evolutionary scientific studies (Houle et al., 2003),
(Arbuckle et al., 2001), (Larios et al., 2008). Their
aim is usually to identify presence and variation of
some characteristic insect or its properties that could
be used as a starting point for further analysis. The
technical problem that researchers are facing is a very
large number of species, their variety, and a shortage
of available experts that are able to categorize and ex-
amine specimens in the field. Due to these circum-
stances, there is a constant need for automation and
speed up of this time consuming process. Applica-
tion of computer vision and its methods provides ac-
curate and relatively inexpensive solutions when ap-
plicable, as it is in the case of different flying in-
sects (Houle et al., 2003), (MacLeod, 2007), (Ar-
buckle et al., 2001), (Zhou et al., 1985). Some of
these insects are pollinators that play a great role in
nature and are of particular interest for scientists as
important indicator species. Their wings are one of
the most frequent discriminating characteristics con-
sidered (MacLeod, 2007) and can be used standalone
or as a key characteristic for insect classification (Ar-
buckle et al., 2001). Unlike some other body parts,
wings are also particularly suitable for automatic pro-
cessing (Tofilski, 2008). The process can be aimed at
species identification and classification, or form the
basis of further morphometric analyses once the clas-
sification to specific taxonomy is done.
Discriminative information that allows flying in-
sects classification may be contained in wing shape
(Rohlf and Archie, 1984), but in most cases it is con-
tained in the relative positions of vein junctions inside
wing that mostly define unique wing venation pat-
terns (Houle et al., 2003), (MacLeod, 2007), (Tofilski,
2008), (Arbuckle et al., 2001), (Zhou et al., 1985).
Wing venation patterns are the result of specific evo-
lutionary adaptations over a long period of time and
are influenced by many different factors (Thompson,
1945). As such, they are relatively stable and can suc-
cessfully describe and represent small differences be-
tween very similar species and taxons, what is not al-
ways possible using only wing shape. Another use-
ful property is that they are not affected significantly
by the current living conditions, present in some spe-
cific natural environment, when compared to some
other wing properties such as colour or pigmentation.
This makes them a good choice for reliable and robust
species discrimination and measurement. The advan-
tage of using venation patterns is also that patterns of
previously collected wing specimens do not change
108
Brklja
ˇ
c B., Pani
´
c M., Ä ˛Eulibrk D., Crnojevi
´
c V., A
ˇ
canski J. and Vuji
´
c A. (2012).
AUTOMATIC HOVERFLY SPECIES DISCRIMINATION.
In Proceedings of the 1st International Conference on Pattern Recognition Applications and Methods, pages 108-115
DOI: 10.5220/0003756601080115
Copyright
c
SciTePress

with the pass of time, as some other wing features, so
they are suitable for later, off-field analyses. Discrim-
ination of species in the past was based on descrip-
tive methods that proved to be insufficient and were
replaced by morphometric methods (Tofilski, 2008).
These methods rely on geometric measures like an-
gles and distances in the case of standard morphom-
etry or coordinates of key points called landmarks,
that could be also used for computing angles and dis-
tances, in the case of more recent geometric morpho-
metrics. In wing-based discrimination each landmark
point represents a unique vein junction that is previ-
ously determined. Manually determined landmarks
require skilled operator and are prone to errors, so au-
tomatic detection of landmark points is always pre-
ferred.
Most state-of-the-art systems for insect classifica-
tion contain, in addition to equipment for specimens
handling, components for image acquisition and anal-
ysis that enable extraction of specific discriminative
information to base specimen classification on. Main
differences between the systems relate to the type of
information they look for and the way it is obtained
from image. Some are designed to perform recog-
nition tasks in uncontrolled environments with vari-
ability in position and orientation of objects (Larios
et al., 2008), and other work under controlled condi-
tions (Tofilski, 2008), (Arbuckle et al., 2001). Unfor-
tunately they are usually not general in their applica-
tion.
Methods for automatic detection of vein junctions
in wing venation of insects are usually based on sim-
ilar computer vision techniques. They generally con-
sist of several preprocessing steps that include image
registration, wing segmentation, noise removal and
contrast enhancement. In order to extract lines that
define wing venation pattern, edge detection, adap-
tive thresholding, morphological filtering, skeleton
extraction, pruning and interpolation are often applied
in next stage. Thus, the landmark points correspond-
ing to vein junctions are found (Houle et al., 2003),
(MacLeod, 2007) or a polynomial model of whole
venation pattern is made on the base of line junctions
and intersections (Houle et al., 2003), (Arbuckle et al.,
2001), (Zhou et al., 1985). In both cases, the main
prerequisite is to obtain an image that contains only
wing outline and wing venation skeleton. That may
be easier to achieve if the light source is precisely
aligned during the image acquisition phase so that it
produces uniform background (MacLeod, 2007), or
when it is allowed to use additional colour informa-
tion as in the case of leaf venation patterns (Zheng
and Wang, 2009), but it is not always the case. Some
of the possible reasons are noisy and damaged images
due to dust, pigmentation, different wing sizes, image
acquisition or bad specimen handling. Another obsta-
cle is that at each processing stage there are numerous
choices and different solutions that are in most cases
problem-dependent. As a result, currently available
systems and algorithms are very specialized and con-
tain different problem specific adaptations.
The goal of the research presented here is to de-
velop an automated flying insects identification sys-
tem based on wing venation patterns, primarily in-
tended for hoverflies, family Syrphidae. The paper
presents an approach to hoverfly species discrimina-
tion based on a novel method for automatic detec-
tion of landmark points in wing venation of insects.
Instead of using problem-dependent algorithms for
wing venation skeleton extraction, we propose the use
of a machine learning algorithm trained on a vein
junctions dataset extracted by human-experts from
real-world images.
The rest of the paper is organized as follows. Sec-
tion 2 provides an overview of the dataset and the
landmark-points detection method used. The pro-
posed hoverfly-species-discrimination methodology
is presented in Section 3. Evaluation results are given
in Section 4 and conclusions are drawn in Section 5.
2 LANDMARK POINTS
DETECTION
The proposed method for landmark point (vein junc-
tions) detection consists of computing specific, win-
dow based features (Ojala et al., 1996), (Dalal and
Triggs, 2005), (Wang et al., 2009), which describe
presence of textures and edges in window, and sub-
sequent classification of these windows as junctions
(positives) or not-junctions (negatives) using detector
obtained by some supervised machine learning tech-
nique.
2.1 Wing Images Dataset
The set of wing images used in the study presented
consists of high-resolution microscopic wing images
of several hoverfly species. There are 868 wing im-
ages of eleven hoverfly species from two different
genera: Chrysotoxum and Melanostroma, Table 1.
Table 1: Number of wing images per class.
Chrysotoxum Melanostroma
Festivum Vernale other Mellinum Scalare other
248 154 22 267 105 72
AUTOMATIC HOVERFLY SPECIES DISCRIMINATION
109
Wings were collected from many different geo-
graphic locations during a relatively long period of
time of more than two decades. Wing images are
obtained from wings mounted in glass microscopic
slides using a microscopic device with a camera res-
olution 2880×1550 pixels and stored in TIFF format.
Each image is uniquely numbered and sorted to the
group it belongs. Association of each wing with a
particular species is based on classification of the in-
sect at the time it was collected and before wings were
detached. This classification was done after exami-
nation by an experienced expert. The images them-
selves were acquired later by biologist under rela-
tively uncontrolled conditions of nonuniform back-
ground light and variable scene configuration without
previous camera calibration. In that sense, obtained
images are not particularly suitable for exact measure-
ments.
Other shortcomings that occur in the dataset, are
result of variable wing specimens quality, damaged
or bad mounted wings, existence of artifacts, variable
wing positions and dust. In order to overcome these
limitations and make these images amenable to auto-
matic hoverfly species discrimination, they were pre-
processed. The preprocessing consisted of image ro-
tation to a unified horizontal position, wing cropping
and scaling. Cropping eliminates unnecessary back-
ground containing artifacts. After the calculation of
mean width and height of all cropped images, they
were interpolated to the same size of 1680×672 pix-
els using bicubic interpolation. Wing images obtained
on this way form the final wing-image dataset used
for sliding-window detector training, its performance
evaluation and subsequent hoverfly species discrim-
ination. Number of images per species is not uni-
form, Table 1, so only four species with significant
number of images are selected for later discrimina-
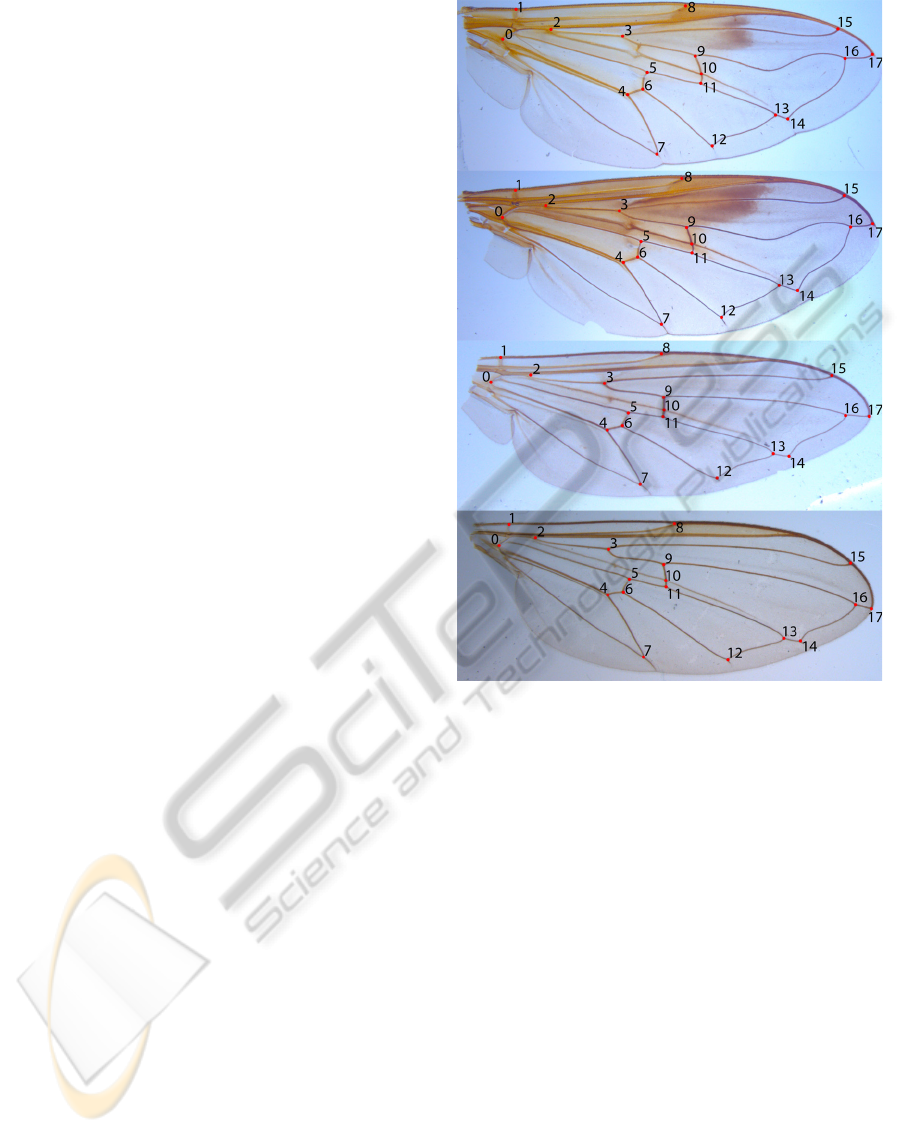
tion based on detected landmark points, Fig.1. These
four species relate to 774 images and belong to both
genera of the Syrphidae family.
2.2 Training/Test Set
In order to analyze applicability and efficiency of the
proposed methodology when it comes to the prob-
lem of landmark-point detection, special vein junc-
tions training/test set was created from collected wing
images. It consists of characteristic wing regions
(patches) that correspond to vein junctions and ran-
domly selected patches, negatives without vein junc-
tions. From each wing image 18 uniquely numbered
positive patches, shown on Fig. 1, were manually ex-
tracted and saved using specially created application.
In the case of severely damaged wings there were
Figure 1: Selected hoverfly species from two diff. gen-
era (from top to bottom): Chrysotoxum Festivum, Chryso-
toxum Vernale, Melanostroma Mellinum, Melanostroma
Scalare.
damaged or missing landmarks that were not selected.
As a result, the total number of positives is slightly
smaller than expected and the training/test set with
15590 positives and 22466 manually selected nega-
tives was created. During detector evaluation some of
the selected landmarks (landmarks numbered 0 and
1 on Fig. 1) prove to be not descriptive enough to
properly and reliably describe wing vein junctions, al-
though they were firstly marked as a landmarks, so
they were discarded from further analysis. Reason is
their grater variability due to specific position, which
in combination with relatively small dataset makes
their detection and even proper selection during train-
ing phase harder. After discarding these landmarks
the final training/test set containing 13868 positives
from all available hoverfly wing images was obtained.
The created set was then used for detailed study of
various implementation choices on detector perfor-
mance.
ICPRAM 2012 - International Conference on Pattern Recognition Applications and Methods
110
2.3 Landmark-point Detector
Discriminative descriptors of vein junctions that are
used in the proposed landmark-point detector are
HOG (Histogram of Oriented Gradients) and LBP
(Local Binary Pattern). They were first proposed in
(Dalal and Triggs, 2005) and (Ojala et al., 1996). In
order to determine and compare their performance
and evalutate the impact of different sets of pertinent
parameters, they were considered separately and com-
bined as described in detail in (Wang et al., 2009).
When it comes to HOG, a feature vector consist-
ing of a number of discrete histograms of image gradi-
ent orientation (Dalal and Triggs, 2005) is employed.
Discrete histograms are computed over small rectan-
gular spatial regions, called cells, that are obtained
by subdivision of the main window. The first step
in the histogram computation is gradient discretiza-
tion, done for each pixel in two closest allowed bins.
Before computing discrete histograms for each cell,
2-D CTI filtering described in (Wang et al., 2009) is
applied. As suggested in (Dalal and Triggs, 2005),
before the construction of the final feature vector, his-
togram values are locally normalized by accumulating
histograms over somewhat larger overlapping spatial
regions, called blocks, using the L
2
norm. These val-
ues, representing normalized values of several spa-
tially adjacent discrete histograms, are than serially
written, block by block, to form the final HOG fea-
ture vector.
Vector length and the dimensionality of corre-
sponding feature space depend on the choice of pa-
rameters that define window, cell and block size,
block overlapping and a number of allowed discrete
histogram values (orientation bins). We used nine
bins evenly spaced over 0
◦
-180
◦
, a 64 × 64 detec-
tion window, blocks containing 2 × 2 cells and block
overlapping width one cell wide. In order to measure
detector performance different cell sizes (8, 16 and
32 pixels) were used. As a result, depending on cell
size, possible dimensions of HOG feature vectors are:
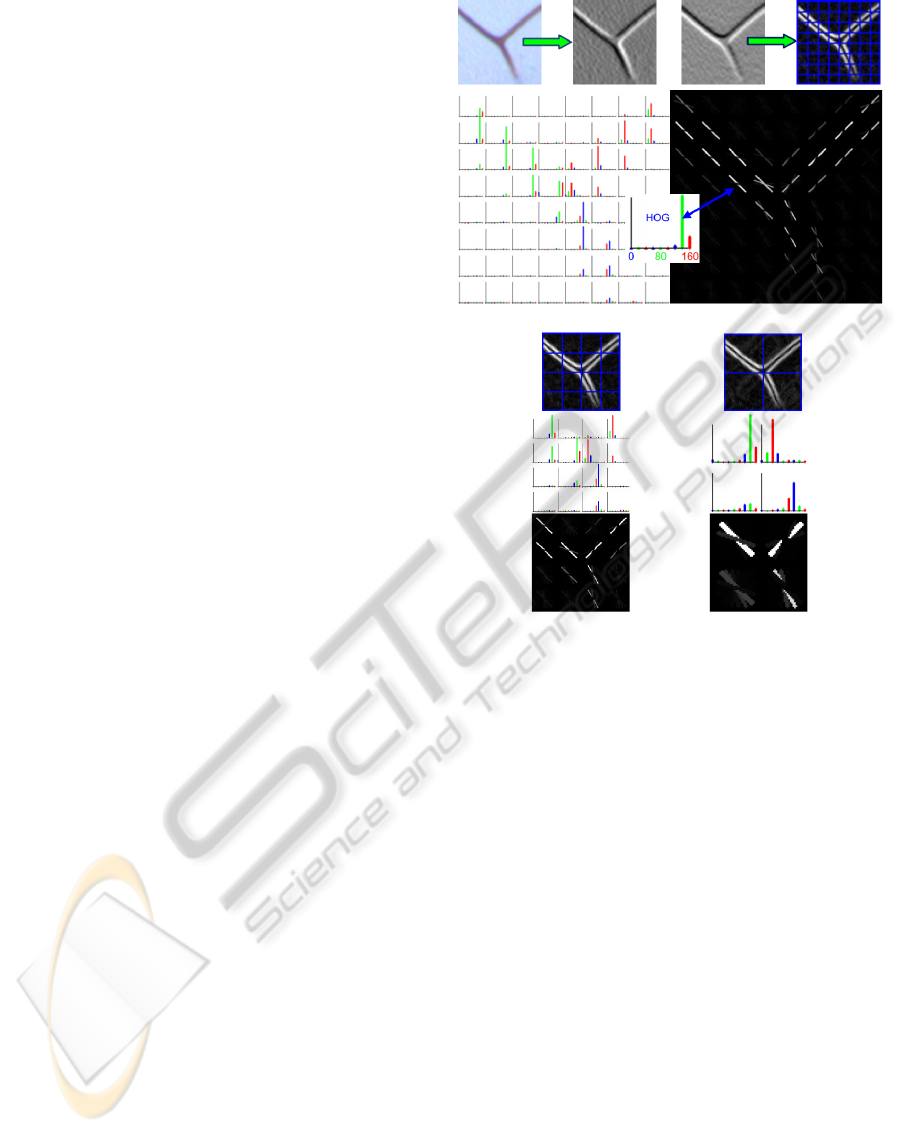
1764 (hog8), 324 (hog16) and 36 (hog32). Fig. 2.
shows the sample HOG feature of a junction (land-
mark point).
An LBP feature describes local structure of the
pixel values in a grayscale image. It is computed for
every pixel by comparing its value P
C
with the val-
ues of all surrounding pixels P
i
, using a predefined
rule. The rule defines the neighbourhood, its geom-
etry and the way of comparing pixel values. Results
of comparisons are written as binary code that repre-
sents a particular pattern in the local neighbourhood
of the pixel considered. As a measure for comparing
pixel values we used quantized difference between
(a) hog8
(b) hog16 (c) hog32
Figure 2: Illustration of HOG feature extraction on the ex-
ample of vein junction from training/test set using different
cell sizes (8, 16, and 32 pixels respectively).
surrounding and central pixel values. If we denote
quantized pixel difference value with a(·), a binary
pattern LBP
n,r
that describes texture is:
LBP
n,r
=
n−1
∑
i=0
a(P
i
− P
C
)2
i
, a(x) =
1, x ≥ 0
0, x < 0
(1)
where n denotes number of neighbouring pixels in
the radius r that are compared with the central pixel.
Rectangular neighbourhood geometry with surround-
ing pixels at unit distance, 16 × 16 cells and the same
window size as in the case of HOG were used.
Under LBP feature, obtained for each analyzed
window, we assume feature vector consisting of val-
ues that represent several discrete histograms of LBP
codes. Histograms are computed separately for each
cell in a window, by counting LBP codes previously
calculated for all cell pixels. Histogram values are
normalized using L
1
norm without any overlap be-
tween the cells. Of particular interest are only uni-
form LBP codes (Wang et al., 2009) that are repre-
sented as separate values in the histogram. Uniform
AUTOMATIC HOVERFLY SPECIES DISCRIMINATION
111

Figure 3: Detector feature performance comparison using
linear SVM.
codes LBP
u
n,r
are those having no more than u 0-1 or
1-0 transitions. All other codes are grouped in one
class, corresponding to the last histogram value. For
the purpose of vein junctions extraction we used 58
uniform LBP
2
8,1
codes. As a result dimensionality of
the LBP feature space is 944.
Combined feature vectors are formed by append-
ing LBP feature vector at the end of HOG feature vec-
tor as described in (Wang et al., 2009). Both HOG and
LBP feature vectors were used separately and in all
combinations in order to measure their window based
performance on the training/test set using the same
classifier. Performance comparison was made using
linear Support Vector Machine (SVM) classifier that
has good generalization properties and ability to cope
with small number of samples in the case of high fea-
ture space dimensionality (Vapnik, 2000).
Feature extraction was implemented in C++ using
OpenCV library (Bradski and Kaehler, 2007). De-
tector performance testing was done in the machine-
learning package Weka (Hall et al., 2009) using Lib-
SVM library (Chang and Lin, 2001), which contains
an implementation of an SVM classifier. In all cases
classifier performance was measured using 10 fold
cross-validation. Cross-validated window level re-
sults in terms of true positives and false positives rates
on training/test set are shown on Fig. 3.
Usage of HOG and LBP features as descriptors of
vein junctions shows acceptable results with miss rate
smaller than 3% in most cases. When used separately
LBP feature gives better result than HOG feature.
HOG feature with 32 pixels cell size is too coarse to
properly describe vein junction in the middle of the
window, because in this case window contains only 4
cells. On the other hand the smallest cell size of 8 pix-
els gave best result among HOG features. As can be
seen from the Fig. 3. combined features are best in the
sense of performance but are more memory and time
demanding during the training phase. Nevertheless,
shown results were motivation for the construction of
vein junctions sliding window detector.
As a result combined HOG-LBP feature with the
cell size of 16 pixels was selected as the best choice
for automatic hoverfly species discrimination based
on sliding window landmarks detection.
3 SPECIES DISCRIMINATION
Automatic hoverfly species discrimination was lim-
ited only to four selected hoverfly species from the
wing-image dataset with sufficient number of in-
stances. The discrimaination is based on the output
of the automatic detection of vein junctions described
in Section 2. Vein-junction detection is done using
a sliding window to search through the image and
the detector described in Section 2. For better per-
formance nonlinear SVM classifier implemented in
(Bradski and Kaehler, 2007) is used. Its optimal pa-
rameters are determined through exponential parame-
ter grid search using 10 fold cross-validation on whole
training/test set. Once the optimal values of the pa-
rameters are determined, the train/test dataset is used
to train the final detector. The constructed detector
goes through the wing image and returns discrete re-
sponses indicating whether a vein junction is present
or not in current window. The same size of the slid-
ing window step is used for both image dimensions.
In the case of a detection, window center coordinates
corresponding to possible vein junction are stored to-
gether with classifiers soft response value. This value
describes how far from separating hyperplane defined
by support vectors, the current feature vector is, or
how trustworthy the detectors decision is. This soft
information is later used to improve the precision of
landmark detections.
Due to multiple detections of the same vein joint,
additional postprocessing of obtained detections is
needed, once the detector finishes searching through
the image. The postprocessig consists of point clus-
terization, Fig. 4, and subsequent computation of
each clusters centroid using previously obtained de-
tectors soft response values. Clusterization is based
on the iterative algorithm that searches through the
remaining detections that have not yet been associ-
ated with some existing cluster until all detections are
assigned to some cluster. It uses a distance criterion
based on the sliding window step size and initializes
clusters with existing unassociated detections. Once
the clusterization is completed, the centroid of each
cluster is determined as weighted average of all de-
tections inside the cluster. In order to use the soft re-
sponse values as weighting factors, these values are
normalized on the level of cluster using L
1
norm so
that they correspond to probabilities of true vein junc-
ICPRAM 2012 - International Conference on Pattern Recognition Applications and Methods
112
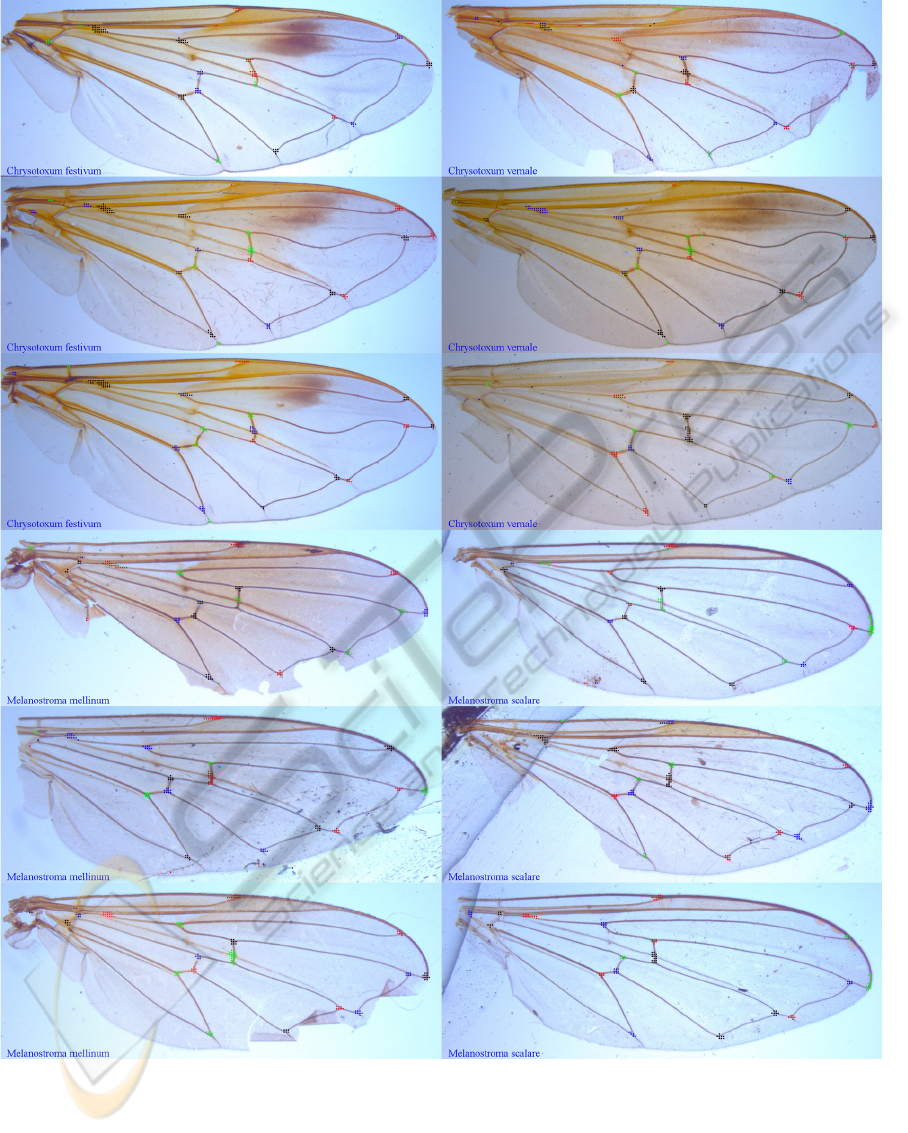
Figure 4: Automatic detections of vein junctions in wing images after clusterization, clusters are shown with different colours.
tion detection. Obtained cluster centroids represent
vein junctions that have been found in an image by
sliding window detector.
However there is no guarantee that these au-
tomatic detections contain all expected landmark
points, or that there are no false detections. The rea-
sons for this can be damaged wings, presence of arti-
facts, etc. Consequently, fixed length feature vectors,
which would be based on obtained automatic detec-
tions, are not an appropriate choice for image classifi-
cation. Therefore, we propose an approach that is not
sensitive to number of detected landmark points. A
AUTOMATIC HOVERFLY SPECIES DISCRIMINATION
113

Table 2: True positives (TP), false positives (FP) rate, precision and recall.
Chrysotoxum Melanostroma Weighted
Festivum(a) Vernale(b) Mellinum(c) Scalare(d) average
TP Rate 0.774 0.383 0.888 0.543 0.704
FP Rate 0.181 0.103 0.093 0.034 0.115
Precision 0.669 0.480 0.835 0.713 0.694
Recall 0.774 0.383 0.888 0.543 0.704
Table 3: Classification results, confusion matrix for four
selected hoverfly species.
Chrysotoxum Melanostroma Total
Festivum Vernale Mellinum Scalare samples
a b c d
a 192 54 1 1 248
b 90 59 4 1 154
c 2 7 237 21 267
d 3 3 42 57 105
feature vector consisting of landmark points centroid,
average Euclidean distance of landmark points from
centroid, median of these distances and their standard
deviation around average is constructed. A common
property of these measures is that they, as descriptive
statistics, do not depend significantly on the number
of landmark points used for their computation and are
also rotational invariant. Under the assumption that
they are discriminative enough to distinguish differ-
ent hoverfly species and do not change significantly
inside the same species, they are used as part of fea-
ture vector that describes particular wing image. As
a result dimensionality of used feature space is only
five. In order to eliminate possible false detections
only landmark points that originate from clusters with
more than two detections are used. Automatic dis-
crimination of four selected hoverfly species is then
made using Multi Layer Perceptron (MLP) neural net-
work classifier with single hidden layer consisting of
4 neurons implemented in (Hall et al., 2009), Table 3.
4 RESULTS
The performance of automatic landmarks detection
using different sliding window step sizes was ana-
lyzed. Step sizes of 8, 16 and 32 pixels were used and
different degrees of landmark detections per image
were achieved. Using the sliding window with largest
step size is significantly faster than the alternatives,
but with the smallest number of detected landmarks
per image and most imprecise due to the absence of
multiple detections. The highest detection accuracy
was achieved using the smallest step size, so this de-
tector was selected to serve as basis for species classi-
fication using MLP. Classifier results, obtained using
10 fold cross-validation, are given in Table 2 and 3.
Classification accuracy of 70.4% was achieved.
These results confirm the applicability of pro-
posed approach in the sense that used features, based
on obtained automatic detections, enable very high
discrimination between two genera inside the same
family, Table 3. Usage of same species dicrimina-
tion approach with ground-truth landmark data in-
stead of automatic landmark detections gave accuracy
of 74.6% correctly classified instances.
5 CONCLUSIONS
Systems for automatic insects classification are usu-
ally designed for field use. Therefore it is desirable
that they are robust and as general as possible. At
present time image based systems are considered as
the preferred choice comparing to some other alter-
natives, like DNA analysis. An image processing ap-
proach to hoverfly species discrimination presented in
this paper shows good results on the collected wing-
image dataset. Its advantage is that it is based on
proposed robust method for the detection of land-
mark points in wing venation of insects that can cope
with different image imperfections, Fig. 4. Simple
rotation-invariant features chosen for later wing clas-
sification are one possible solution for the problem
of unpredictable number of automatic detections and
proved to be discriminative enough to distinguish cor-
rectly between two different hoverfly genera and to
a lesser extent, the species that comprise them. As
such, it could be used as a first step in a construction
of a more complex cascade classifier that would in-
corporate extra information from the image and from
the obtained landmark points to achieve more precise
classification on the species level.
REFERENCES
Arbuckle, T., Schr
¨
oder, S., Steinhage, V., and Wittmann, D.
(2001). Biodiversity informatics in action: identifi-
cation and monitoring of bee species using ABIS. In
ICPRAM 2012 - International Conference on Pattern Recognition Applications and Methods
114

Proc. 15th Int. Symp. Informatics for Environmental
Protection, pages 10–12.
Bradski, G. and Kaehler, A. (2007). Learning OpenCV.
O’Reilly Media, Sebastopol CA.
Chang, C. and Lin, C. (2001). Libsvm: a library for sup-
port vector machines. ACM Transactions on Intelli-
gent Systems and Technology), 2(3):27.
Dalal, N. and Triggs, B. (2005). Histograms of oriented
gradients for human detection. In CVPR 2005, IEEE
Computer Society Conference on Computer Vision
and Pattern Recognition, volume 1, pages 886–893.
Hall, M., Frank, E., Holmes, G., Pfahringer, B., Reute-
mann, P., and Witten, I. (2009). The weka data min-
ing software: an update. ACM SIGKDD Explorations
Newsletter, 11(1):10–18.
Houle, D., Mezey, J., Galpern, P., and Carter, A. (2003).
Automated measurement of Drosophila wings. BMC
Evolutionary Biology, 3(1):25.
Larios, N., Deng, H., Zhang, W., et al. (2008). Automated
insect identification through concatenated histograms
of local appearance features: feature vector generation
and region detection for deformable objects. Machine
Vision and Applications, 19(2).
MacLeod, N., editor (2007). Automated taxon identification
in systematics: theory, approaches and applications,
pages 289–298. CRC Press, Boca Raton.
Ojala, T., Pietik
¨
ainen, M., and Harwood, D. (1996). A com-
parative study of texture measures with classification
based on featured distributions. Pattern Recognition,
29(1):51–59.
Rohlf, F. and Archie, J. (1984). A comparison of
Fourier methods for the description of wing shape in
mosquitoes (Diptera: Culicidae). Systematic Biology,
33(3):302.
Thompson, W. (1945). On growth and form. Cambridge
University Press, Cambridge.
Tofilski, A. (2008). Using geometric morphometrics and
standard morphometry to discriminate three honeybee
subspecies. Apidologie, 39(5):558–563.
Vapnik, V. (2000). The nature of statistical learning theory.
Springer Verlag.
Wang, X., Han, T., and Yan, S. (2009). An HOG-LBP hu-
man detector with partial occlusion handling. In ICCV
2009, 12th International Conference on Computer Vi-
sion, pages 32–39. IEEE.
Zheng, X. and Wang, X. (2009). Fast Leaf Vein Extrac-
tion Using Hue and Intensity Information. In ICIECS
2009,International Conference on Information Engi-
neering and Computer Science, pages 1–4. IEEE.
Zhou, Y., Ling, L., and Rohlf, F. (1985). Automatic descrip-
tion of the venation of mosquito wings from digitized
images. Systematic Biology, 34(3):346.
AUTOMATIC HOVERFLY SPECIES DISCRIMINATION
115
