
DYNAMIC AUTOREGRESSIVE MODELLING OF CRITICAL
CARE PATIENTS AS A BASIS FOR HEALTH MONITORING
K. Van Loon
1
, G. Meyfroidt
2
, T. Tambuyzer
1
, G. Van den Berghe
2
, D. Berckmans
1
and J.-M. Aerts
1
1
Division Measure, Model & Manage Bioresponses, Katholieke Universiteit Leuven
Kasteelpark Arenberg 30, B-3001, Leuven, Belgium
2
Department of Intensive Care Medicine, University Hospital Gasthuisberg, Herestraat 49, B-3000, Leuven, Belgium
Keywords: Critical Care Patients, Health Monitoring, Time Series Analysis, Autorgressive Modeling.
Abstract: Real-time modelling techniques could be valuable to continuously evaluate individual critically ill patients
and to help the medical staff with estimation of prognosis. This preliminary study examines the possibilities
to distinguish survivors from non-survivors on the basis of instabilities in the dynamics of daily measured
variables. A data set, containing 140 patients, was generated in the intensive care unit (ICU) of the
university hospital of Leuven. First and second order dynamic auto-regression (DAR) models were used to
quantify the stability of time series of three physiological variables as a criterion to distinguish survivors
from non-survivors. The best results were found for blood urea concentration with true negative fractions of
45/72 (63%) and true positive fractions of 43/68 (62%). The results indicate that the dynamics of time series
of laboratory parameters from critically ill patients are indicative for their clinical condition and outcome.
1 INTRODUCTION
Physicians have for long recognized the importance
of considering the temporal dimension of illness for
arriving at a diagnosis and deriving treatment
strategies (Belair et al., 1995). The study of disease
dynamics, or how disease states change with respect
to time, is providing a key to understanding
abnormalities in underlying physiologic control
mechanisms (Goldstein et al., 2003). For monitoring
purposes, especially changes in dynamic
characteristics seem to be relevant in distinguishing
health from disease (Glass, 2001; Buchman, 2004;
Van Loon et al., 2010). This indicates the potential
of approaches that aim at quantifying dynamic
characteristics of individual patients on-line during
their stay in the intensive care unit (ICU). Several
attempts to take the time-varying aspect of the health
status of critically ill patients into account have been
reported (e.g. Chang et al., 1988; Clermont et al.,
2004; Toma et al., 2007, 2008).
In most of these studies, the available
information at a certain instance in time was
summarised in one score and the calculation of this
score was repeated in time. Afterwards, a
classification or prediction model was built using
these summary variables. Instead of using repeated
scores, it is also possible to extract dynamically
relevant features from the commonly measured
physiological data itself. A large number of
variables are continuously monitored and stored in
the ICU environment.
A candidate approach for monitoring individual
patients in the ICU is time series analysis. A few
investigations have employed the use of time series
analysis in the field of intensive care medicine (e.g.
Lambert et al., 1995). It has been shown that time
series analysis techniques are suitable for
retrospective analysis of physiological variables. A
computationally similar, but more challenging task
is the on-line analysis of intensive care monitoring
data (Imhoff et al., 1999).
The objective of the reported research was to
explore whether recursive time series analysis can
be used to monitor individual patients in the ICU.
More specifically, the aim was to test if the
occurrence of temporal instabilities in the dynamics
of time series of continuously measured
physiological data contains valuable information for
distinguishing between survivors and non-survivors.
85
Van Loon K., Meyfroidt G., Tambuyzer T., Van den Berghe G., Berckmans D. and Aerts J..
DYNAMIC AUTOREGRESSIVE MODELLING OF CRITICAL CARE PATIENTS AS A BASIS FOR HEALTH MONITORING.
DOI: 10.5220/0003784800850090
In Proceedings of the International Conference on Bio-inspired Systems and Signal Processing (BIOSIGNALS-2012), pages 85-90
ISBN: 978-989-8425-89-8
Copyright
c
2012 SCITEPRESS (Science and Technology Publications, Lda.)

2 MATERIALS AND METHODS
2.1 Patient Database
The database was derived from a larger database
(1200 patients) created for a clinical study with a
similar setup and purpose in a group of critically ill
patients from a medical ICU (Van den Berghe et al.,
2006). In order to have enough data points for time
series analysis we had to select patients with a
length of stay of at least 20 days because in the
existing data sets, most of the stored data were
available only once daily. A second selection
criterion was that we only accepted patient data with
no missing measurement values. A set of 140
patients fulfilled both criteria.
An overview of the used data set is depicted in
Table 1. The protocol of this trial was approved by
the ethical commission of our hospital.
Table 1: Characteristics of the database.
Number of patients 140
Age (mean ± std) 62 ± 14
Sex M: 95, F: 46
BMI 25 ± 5
We used daily measurements of three variables,
namely: maximum body temperature (Tmax, °C),
white blood cell count (WBC, 10
9
/L) and urea
concentration (Uconc, mg/dl).
2.2 Recursive Modelling
Since the physiological patient responses are time
variant, most of the measured physiological
variables are non-stationary, in the sense that the
statistical properties of the signal are changing
slowly over time in relation to the rates of change of
the stochastic state variables in the system under
study. When the system is non-stationary, models
with time varying parameters should be used for the
analysis (Pedregal et al., 2007). In this study we
used a Dynamic Auto-Regression (DAR) model
which can be formulated as:
=
1
(
,)
(1)
in which
(
,
)
=1+
+
+⋯+
is a time variable parameter polynomial in
the backward shift operator
; y
t
is the considered
physiological variable; e
t
is zero mean white noise.
Here, the adjective ‘dynamic’ means the model
has time variable parameters and not that the DAR
model is dynamic in a systems sense. A random
walk model was specified and a time domain
maximum likelihood estimation was applied to find
the optimal parameter estimates.
By multiplying equation (1) throughout by
(
,
)
the DAR model in the time series
formulation is obtained:
=−
−⋯−
+
(2)
From this equation it can be seen that
is
calculated from previous samples of itself plus a
random component in the form of the white noise
.
For more details, reference can be made to Taylor et
al. (2006) and Pedregal et al. (2007).
In a first step, first and second order DAR
models were computed for the three variables of the
development data set, since in preliminary analysis
these model orders led to the best results in terms of
the Akaike’s Information criterion (AIC). The first
and second order model structures were as follows:
=−
+
(3a)
=−
−
+
(3b)
On the basis of the correlation coefficients between
the measured variables and the one-step-ahead
predictions, the best performing variables were
selected for further analysis in the second step.
Average correlation coefficients < 0.70 were
considered as not sufficient in order to have an
accurate model.
A further selection in the variables and model
orders was made considering the uncertainty of the
parameters in the calculated models. The average
standard error (SE) on the parameters was calculated
and used as a measure for the reliability of the
model. In the recursive algorithm, for all
consecutive estimations of the model parameters, the
relative standard error (RSE) of the parameters was
calculated using following equation:
=
|
|
× 100(%)
(4)
The average of the relative standard errors was taken
from day 15 until the end of the data set for each
patient. The recursive algorithm needed about 14
data points to result in a reliable model, so the 14
first values were not considered.
2.3 Model-based Classification of
Survivors vs. Non-survivors
The hypothesis of this work was that a patient that
becomes unstable at least once during his/her stay in
the ICU, will not survive. When measured variables
BIOSIGNALS 2012 - International Conference on Bio-inspired Systems and Signal Processing
86

become unstable, this does not imply an increase in
the variability or the irregularity of the signal. A
higher variability often even corresponds to more
healthy conditions (Lipsitz, 2002).
To have a stable system, in this case the patient,
it is required that all poles of the transfer function lie
inside the unit circle. For a first order system, this
means that the following criterion should be met for
the a
1
-parameter in equation (3a) (Box et al., 1994):
−1 <
<1
(5)
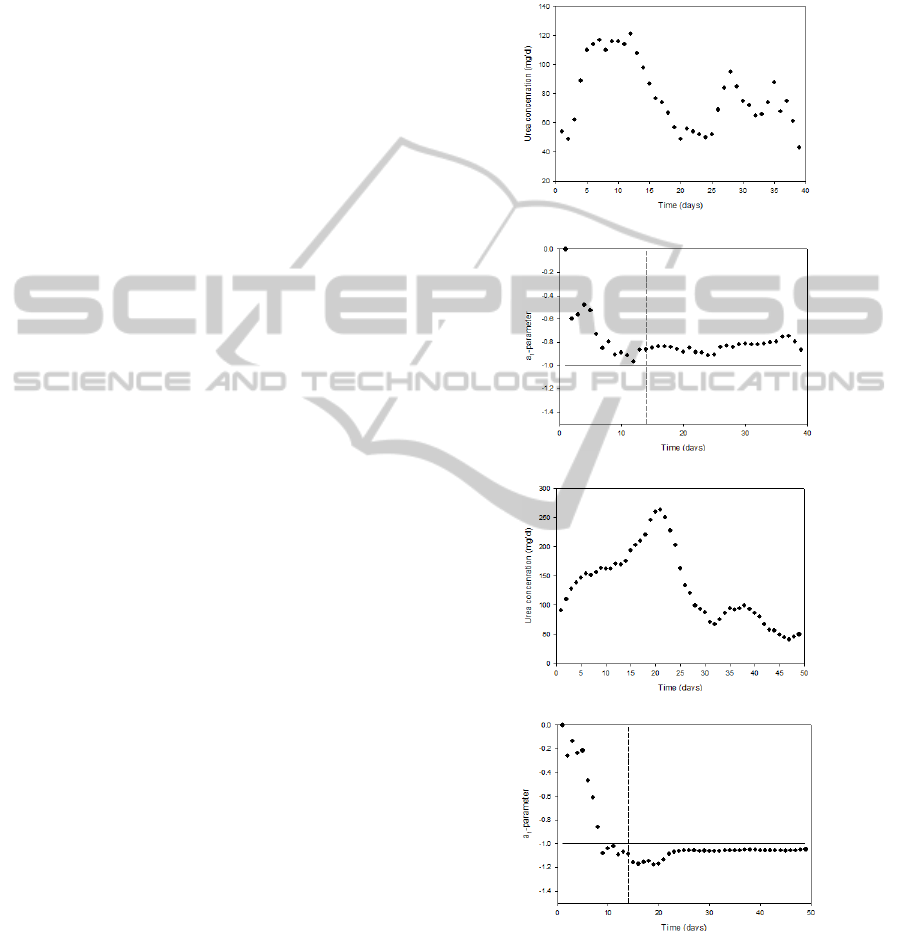
The time course of the measured urea concentration
values (as an example) and the calculated stability
criterion (equation 5) for two example patients are
shown in Figure 1 for a survivor and a non-survivor.
For a second order model, the criteria for
stability can be expressed in terms of the two model
parameters in the following way (Box et al., 1994):
+
>−1
−
>−1
(6)
−1 <
<1
where
and
are the model parameters as
described in equation (3b). When one of these
criteria is not met, the system is unstable.
On the basis of the stability criteria, the
classification between survivors and non-survivors
was made and quantified in terms of true positive
fractions (sensitivity) and true negative fractions
(specificity). The true positive fraction (TP) was
defined as the fraction of patients that becomes
unstable at least once during the stay in the ICU and
died. The true negative fraction (TN) was defined as
the fraction of patients that did not become unstable
and survived. Because the recursive parameter
algorithm needed about 14 data points (days) of past
data to produce reliable parameter estimates, the
stability test was performed from day 15 on. This is
a drawback of the used methodology, but the aim of
this preliminary study was to investigate whether the
stability of measured physiological variables of the
patients gives valuable information about the
patients’ survival when they have a long ICU stay
and not to predict the outcome as soon as possible
after arrival in the ICU.
3 RESULTS AND DISCUSSION
In the first step, first and second order models were
calculated for the three variables and the correlation
coefficients between the measured variables and the
one-step-ahead predictions were analysed. Table 2
gives an overview of the average correlation
coefficients for each variable for the first as well as
for the second order models. The results indicate
that the variable Tmax could not be modelled
accurately (average correlation coefficients < 0.70).
Consequently, only the variables Uconc and WBC
were selected for further analysis.
Table 2: The correlation coefficients between the
measured variables and the one-step-ahead predictions of
the first and second order dar models calculated on the
variables tmax, uconc and wbc.
Tmax Uconc WBC
1
st
order 0.51 0.86 0.73
2
n
d
order 0.54 0.85 0.77
Secondly, the reliability of the parameters was
examined in terms of their relative standard errors.
The average errors are given in Table 3 for the first
and second order models of the two remaining
variables. From this table it can be seen that the
errors on the parameters of the second order models
were always larger than those of the first order
models. Therefore it was decided to disregard the
second order models from this step on.
Table 3: The mean relative standard errors (MRSE) on the
parameters of the first and second order DAR models
calculated on the variables Uconc and WBC of the
development data set (%).
Model Parameters
MRSE
Uconc
(%)
MRSE
WBC
(%)
1
st
order a
1
43.15 39.16
2
n
d
order a
1
486.24 386.72
a
2
1036.58 909.44
The recursively calculated parameter estimates were
tested against the stability criteria (equation (5)) in a
third step. Table 4 summarizes the calculated true
positive fractions and the true negative fractions for
the first order models of the two remaining
variables.
Table 4: The TN and TP values for Uconc and WBC.
Uconc WBC
TN 45/72 (63%) 61/72 (85%)
TP 43/68 (62%) 22/68 (32%)
If we were to base clinical decisions upon a model,
it would be clinically more acceptable to classify a
non-survivor erroneously as a survivor than to
classify a survivor as a non-survivor. So, preferably
the TN is at least as big as the TP and both the TP
DYNAMIC AUTOREGRESSIVE MODELLING OF CRITICAL CARE PATIENTS AS A BASIS FOR HEALTH
MONITORING
87
and TN should be as close to 100% as possible.
Considering this, the best result was obtained for
Uconc with a TN of 45/72 (63%) and a TP of 43/68
(62%). This signal was consequently considered as
the most indicative variable for outcome prediction,
although these results are not good enough to be
useful in clinical practice.
Uconc turned out to be the best choice for the
classification of survivors versus non-survivors. The
TN for WBC was better than in the case of Uconc,
but the TP was a lot worse. When looking at the
reliability of the parameters, the relative standard
errors on the parameters of the models WBC were
lower than the errors for Uconc, but the former have
a very low TP. Consequently, Uconc is the best
option for the given study purpose.
All selected variables are used in the clinical
setting as markers of inflammation or organ function
and therefore it is not surprising that they are
predictive for mortality in this subset of patients
with a prolonged stay in the ICU. The blood urea
concentration was found to be a prognostic marker
in several types of patients (Beier et al., 2011). In
the study of Jackson et al. (2008) it is shown that an
elevated urea concentration is more powerful than
the estimated glomerular filtration rate at predicting
an increased risk of early mortality following
admission with heart failure. In this study a Cox-
proportional hazard model of log[urea] (per unit
change) resulted in a hazard ratio for risk of death of
1.79 (± 95% CI 1.08-2.97, P = 0.003). An increased
postoperative serum urea concentration is also
associated with an increase in 30-day mortality in
patients undergoing emergency abdominal surgery
(odds ratio 4.79, ± 95% CI 2.37-9.70, P = 0.003;
Harten et al., 2006). The relevance of blood urea
nitrogen (BUN) as a marker for length of stay and
mortality at the intensive care unit for patients with
acute necrotizing pancreatitis was investigated by
Faisst et al. (2010). In their study, these authors used
thresholds on absolute values of BUN as a predictive
value. When using a threshold (cutoff) value of 33
mg/dl, high BUN levels correctly predicted a
prolonged length of stay in 89% of the cases
(positive predictive value, PPV) and the negative
predictive values (NPV) for BUN on admission and
in the course of the disease was 62% and 77%. With
the same threshold, mortality could be correctly
ruled out in 82% of the cases on admission and in
92% of the cases in the course of the disease (NPV).
The PPVs were lower with 67% on admission and
56% in the course of the disease. In addition to these
studies, our results indicated that not only the
absolute steady state levels of Uconc, but also its
dynamics, can be predictive for survival in the ICU.
To the authors’ knowledge no studies have been
performed using time series dynamics of urea
concentration in critically ill patients at the ICU in
relation with mortality.
(a)
(b)
(c)
(d)
Figure 1: Time courses of the daily measured urea
concentration values for a survivor (a) and non-survivor
(c) as well as the corresponding time-varying a
1
-parameter
values for a survivor (b) and non-survivor (d). The vertical
dashed line in (b) and (d) indicate the end of the period of
the first 14 data points (days) that are needed for reliable
parameter estimation. The horizontal line indicates the
threshold of a
1
= -1.
BIOSIGNALS 2012 - International Conference on Bio-inspired Systems and Signal Processing
88

The occurrence of instabilities in the measured
biological signals of (most) non-survivors might be
explained by the fact that, in critical care patients
before dying, the complex closed-loop responses
that operate to keep the organism in equilibrium may
not be evolved to produce a healthy response to
stress, and thus respond in a maladaptive way. This
fits with the work of Lipsitz (2002) who connects
the proper working of physiological systems with
the stability of its dynamic response. However, it
can be expected at one hand that some patients
become dynamically unstable but recover from this
situation or on the other hand that some patients can
die due to very acute problems (e.g. brain
haemorrhage) which are not preceded by periods of
instability in the measured dynamics. Therefore, the
findings in our study need to be validated and
confirmed in a larger sample of patients to evaluate
the concept thoroughly.
In ICU's worldwide, attempts to improve data
processing have centered on computerized systems
and several patient data management (PDMS)
systems have been developed (Toma et al., 2007).
This is software where virtually all patient and
therapy related information is stored on a high
resolution basis. Consequently, there is a great need
for integrating the data and automating the
recognition of several diagnoses, since the quality of
health care systems depends on making the right
decisions at the right time and place (Fonseca et al.,
2009). Without automated systems, clinicians have
to manually extract the necessary information,
which is a time-consuming work that distracts them
from critical tasks and increases the risk of making
mistakes (Spencer et al., 1997). In combination with
recursive modelling techniques, such systems might
allow to model the patients’ dynamic responses in
real-time as a basis for improving personal health
status monitoring.
4 CONCLUSIONS
We found that the patients’ dynamics contains
interesting information when distinguishing between
survivors and non-survivors. A data set of 140
patients was used for the analyses. On the basis of
stability measurements calculated from the
parameters of recursive time series models on
physiological data, we were able to separate
survivors form non-survivors. The best results were
obtained when using blood urea concentration which
gave a true negative fraction of 45/72 (63%). The
true positive fraction was 43/68 (62%). The results
of this study need to be validated and afterwards
confirmed in larger trials, before the described
methodology could be considered in the future in
combination with patient data management systems
to support the physician in on-line monitoring and
decision taking for individual patients.
ACKNOWLEDGEMENTS
We wish to thank the Katholieke Universiteit
Leuven for funding the research reported in this
paper (Interdisciplinary Research project
IDO/03/006).
REFERENCES
Beier, K., Eppanapally, S., Bazick, H. S., Chang, D.,
Mahadevappa, K., Gibbons, F. K. & Christopher, K.
B. (2011). Elevation of blood urea nitrogen is
predictive of long-term mortality in critically ill
patients independent of “normal” creatinine. Crit Care
Med, 39, 305-313.
Belair, J., Glass, L., Heiden, U. A. D. & Milton, J. (1995).
Dynamical Disease - Identification, Temporal Aspects
and Treatment Strategies of Human Illness. Chaos, 5, 1-7.
Box, G. E., Jenkins, G. M. & Reinsel, G. C. (1994). Time
series analysis: forecasting and control. Prentice-Hall
International, New Jersey.
Buchman, T. G. (2004). Nonlinear dynamics, complex
systems, and the pathobiology of critical illness. Curr
Opin Crit Care, 10, 378-382.
Chang, R. W. S., Jacobs, S. & Lee, B. (1988). Predicting
Outcome Among Intensive-Care Unit Patients Using
Computerized Trend Analysis of Daily Apache-Ii
Scores Corrected for Organ System Failure. Intens
Care Med, 14, 558-566.
Chang, R. W. S., Jacobs, S., Lee, B. & Pace, N. (1988).
Predicting Deaths Among Intensive-Care Unit
Patients. Crit Care Med, 16, 34-42.
Clermont, G., Kaplan, V., Moreno, R., Vincent, J. L.,
Linde-Zwirble, W. T., Van Hout, B. & Angus, D. C.
(2004). Dynamic Microsimulation to Model Multiple
Outcomes in Cohorts of Critically Ill Patients. Intens
Care Med, 30, 2237-2244.
Faisst, M., Wellner, U. F., Utzolino, S., Hopt, U. T. &
Keck T. (2010). Elevated blood urea nitrogen is an
independent risk factor of prolonged intensive care
unit stay due to acute necrotizing pancreatitis. J Crit
Care, 25, 105-111.
Fonseca, T., Ribeiro, C. & Granja, C. (2009). Vital Signs
in Intensive Care: Automatic Acquisition and
Consolidation into Electronic Patient Records. J Med
Syst, 33, 47-57.
Glass, L. (2001). Synchronization and Rhythmic Processes
in Physiology. Nature, 410, 277-284.
DYNAMIC AUTOREGRESSIVE MODELLING OF CRITICAL CARE PATIENTS AS A BASIS FOR HEALTH
MONITORING
89

Goldstein, B., McNames, J., McDonald, B. A., Ellenby,
M., Lai, S., Sun, Z. Y., Krieger, D. & Sclabassi, R. J.
(2003). Physiologic Data Acquisition System and
Database for the Study of Disease Dynamics in the
Intensive Care Unit. Crit Care Med, 31, 433-441.
Harten, J., Hay, A., McMillan, D. C., McArdle, C. S.,
O’Reilly, D. S. & Kinsella, J. (2006). Postoperative
Serum Urea Is Associated With 30-Day Mortality in
Patients Undergoing Emergency Abdominal Surgery.
Ann Clin Biochem, 43, 295-299.
Imhoff, M., Bauer, M. & Gather, U. (1999). Time-Effect
Relations of Medical Interventions in a Clinical
Information System. Lecture Notes in Artificial
Intelligence, 1701, 307-310.
Jackson, C. E., Austin, D., Tsorlalis, I. K., Dalzell, J. R.,
Myles, R. C., Rodgers, J., Stewart, N., Spooner, R.,
Petrie, M. C., Cobbe, S. M. & McMurray, J. J. V.
(2008). Does Blood Urea Concentration Predict Early
Mortality in Patients Hospitalised With
Decompensated Heart Failure Better Than Estimated
Glomerular Filtration Rate? Heart, 94, A107.
Lambert, C. R., Raymenants, E. & Pepine, C. J. (1995).
Time-Series Analysis of Long-Term Ambulatory
Myocardial-Ischemia - Effects of Beta-Adrenergic and
Calcium-Channel Blockade. Am Heart J, 129, 677-
684.
Lipsitz, L. A. (2002). Dynamics of Stability: the
Physiologic Basis of Functional Health and Frailty. J
Gerontol A-Biol, 57, B115-B125.
Pedregal, D. J., Taylor, C. J. & Young, P. C. (2007).
System Identification, Time Series Analysis and
Forecasting: The Captain Toolbox. Handbook v2.0.
Centre for Research on Environmental Systems and
Statistics. Lancaster University, Lancaster.
Spencer, R.G., Lessard, C.S., Davila, F. & Etter, B.
(1997). Self-Organising Discovery, Recognition and
Prediction of Haemodynamic Patterns in the Intensive
Care Unit. Med Biol Eng Comput, 35, 117-123.
Taylor, C. J., Pedregal, D. J., Young, P. C. & Tych, W.
(2006). Environmental Time Series Analysis and
Forecasting with the Captain Toolbox. Environ Modell
Softw, 22, 797-814.
Toma, T., Abu-Hanna, A. & Bosman, R. J. (2007).
Discovery and Inclusion of Sofa Score Episodes in
Mortality Prediction. J Biomed Inform, 40, 649-660.
Toma, T., Abu-Hanna, A. & Bosman, R. J. (2008).
Discovery and Integration of Univariate Patterns From
Daily Individual Organ-Failure Scores for Intensive
Care Mortality Prediction. Artif Intell Med, 43, 47-60.
Van den Berghe, G., Wilmer, A., Hermans, G.,
Meersseman, W., Wouters, P. J., Milants, I., Van
Wijngaerden, E., Bobbaers, H. & Bouillon, R. (2006).
Intensive Insulin Therapy in the medical ICU. New
Engl J Med, 354, 449-461.
Van Loon, K., Guiza, F., Meyfroidt, G., Aerts, J.-M.,
Ramon, J., Blockeel, H., Bruynooghe, M., Van den
Berghe, G. & Berckmans, D. (2010). Prediction of
Clinical Conditions after Coronary Bypass Surgery
using Dynamic Data Analysis. J Med Syst, 34, 229-
239.
BIOSIGNALS 2012 - International Conference on Bio-inspired Systems and Signal Processing
90
