
The Effect of Multi-media Contents in Reducing Sensible
Temperature
Shuhei Yamamoto
1
, Akira Tomono
1
and Hajime Katsuyama
2
1
Department of Information Media Technology, School of Information and Telecommunication Engineering,
Tokai University, 2-3-23 Takanawa, Minato-ku, Tokyo 108-8619, Japan
2
Graduate school of Engineering, Tokai University, 4-1-1 Kitakaname, Hiratsuka-shi, Kanagawa, 259-1292, Japan
Keywords: Kansei Multimedia, Sensible Temperature, Aroma, Energy Saving, Information Extraction Analysis.
Abstract: In this paper, the effect of multi-media contents such as visual images, scent, and their combinations on
sensible temperature is investigated. For this purpose, a new definition of sensible temperature which takes
into account the effect of visual images and scent is proposed. Using this definition, the effectiveness of
multi-media contents in reducing sensible temperature was quantitatively measured. It turned out that visual
images with lemon aroma is more effective in reducing sensible temperature than visual images alone.
1 INTRODUCTION
In Japan, nuclear accident at Fukushima, which took
place on the 11
th
of March, 2011, has been causing a
severe shortage in electric supply, especially in the
Kanto region, which includes Tokyo. As a result,
companies and households are required to raise the
room temperature during the summer and lower it
during the winter in order to save electricity. The top
energy consuming equipment in the house is the air-
conditioner, followed by the refrigerator and then
lighting equipment. Although it is difficult to
significantly cut down energy consumption by the
refrigerator and lighting equipments, effective
reduction of energy usage can be attained through
adjustment of the room temperature because the
electric energy consumption of the air conditioner is
said to be lowered by 10% by changing the control
temperature of the air conditioner by 1 °C. Due to its
high effectiveness in energy saving, the Ministry of
Economy, Trade, and Industry of Japan has
encouraged companies and households to set the
room temperature to 28°C.
However, 28°C is really high, and although it
depends on humidity as well, such an environment is
actually very uncomfortable. This is problematic, as
the productivity of workers will generally decrease
with decreasing amenity of the working place. On
the other hand, it is known that performance level
can be increased by changing the working
environment with presentation of aroma (Yasuda et
al., 2010). Also, the level of discomfort is reported
to decrease in the presence of aroma, according to an
experiment (Kimura et al., 2001).
Thus, our proposal of a method to manipulate
sensible temperature by presenting multi-media
stimuli will contribute to energy saving at this time
of this energy shortage. In Japan, multi-media,
which can express sensation and feeling by adding
olfactory and tactile information to visual and audio
information that traditional multi-media have
presented to the user, is called KANSEI multi-media
(Nakamoto et al., 2008). In this paper, a new
definition of sensible temperature, which is adapted
in the paper, will be presented first, and the effect of
KANSEI multi-media, such visual images along
with aroma, will be investigated.
2 RELATED WORK
Among many definitions of sensible temperature,
the definition proposed by Missenard is well-known
(Missenard, 1931). The definition takes into account
the influences of humidity as well as temperature
and is given by:
=−2.3
(
−10
)
(0.8− 100
⁄
)
(1)
where t denotes the temperature in Celsius, and H
the relative humidity in %. In the late 1960s, Fanger
151
Yamamoto S., Tomono A. and Katsuyama H..
The Effect of Multi-media Contents in Reducing Sensible Temperature.
DOI: 10.5220/0004023801510156
In Proceedings of the International Conference on Signal Processing and Multimedia Applications and Wireless Information Networks and Systems
(SIGMAP-2012), pages 151-156
ISBN: 978-989-8565-25-9
Copyright
c
2012 SCITEPRESS (Science and Technology Publications, Lda.)

proposed Predictive Mean Vote and the PMV-model
that takes into account the effect of clothing and
activity (Fanger, 1972). This is a static heat balance
model and predicts the percentage of people in a
given group experiencing thermal comfort.
There are also other factors that affect sensible
temperature. In addition to tactile stimuli, such as
temperature and humidity, it is affected by visual,
audio, and olfactory stimuli. For example, scent is
known to have psychological and physiological
impacts on humans. A research showed that
refreshing scents such as mint flavour reduces
apparent temperature (Shoji, 2005).
However, not many researches have been done
on the methods to measure sensible temperature that
take into account the effect of visual images and
scent and how much these factors change sensible
temperature.
3 THEORY OF SENSIBLE
TEMPERATURE
3.1 Definition of Sensible Temperature
In this section, we propose a new definition of
sensible temperature, which will be adapted in the
rest of this paper. The key idea is to focus on
similarity in psychological reaction. To explain this
idea, imagine two environments, e
1
, with a
temperature of 26°C and humidity of 80%, and e
2
,
with a temperature of 28°C and humidity of 30%.
Suppose that environment e
1
feels as warm as
environment e
2
. This is entirely conceivable as we
know from experience that increased humidity leads
to increased sensible temperature, just like many
formulae for sensible temperature, such as the heat
index equation, indicate (Steadman, 1979).
Then, the sensible temperature in the two
environments is the same. In other words, the
subjective evaluation of the environments is equal,
at least in respect to the temperature. Also, when one
is initially in environment e
0
, with a physical
temperature of 26°C and humidity of 30%, that
gradually changes into e
1
, one would feel as if the
temperature of the environment increased by 2°C.
This means the effect of increasing humidity by 50%
is equivalent to that of increasing physical
temperature by 2°C. These considerations suggest
that apparent change in temperature can be gauged
by making use of the similarity of psychological
reaction to the apparent heat of the environments.
To formalize these ideas, first let x
1
, x
2
, …, x
n
be
environmental factors that affect sensible
temperature, such as physical temperature and
humidity, and form an environment space, E, by
collecting the ordered tuples comprising of these
factors, i.e. E=
{
≡
(
,
,…,
)|
∈ℝ
}
=ℝ
,
where x
1
denotes physical temperature, and x
2
humidity. Then, sensible temperature can be
expressed as a function over E. Call this function
:E→ℝ a sensible temperature function. Here, the
subscript i indicates individual dependence of the
function. Hereafter, the existence and uniqueness of
the sensible temperature function is assumed.
Then, we divide E into equivalent sets based on
similarity in psychological reaction related to
apparent temperature. For this purpose, we introduce
a function S:E×E→ℝ
called the similarity
function. Given two environments, e
1
and e
2
, S(e
1
,e
2
)
indicates similarity in psychological reaction to
these two environments. The smaller the value of
this function, the more similar the reactions are. The
precise definition of this function is given later. With
this function, we partition E into the following
equivalent sets:
ℇ
=
{
∈E
|(
∀∈ℕ
)
S
(
,
,…,
)
,
≤S(
(
,
,…,
)
,))}
where c
2
, c
3
,…, c
n
are arbitrary constants. Note that
these equivalent sets are formed first by picking up
discrete points on the line L={
(
,
,
,…,
)
|∈
ℝ}, and then by making an environment belongs to
the equivalent set represented by the point closest to
it among those picked up points. Although it might
seem appropriate to form an equivalent set for each
value of sensible temperature, for the following two
reasons, our equivalent sets are countable and not
continuous.
1) Sensible temperature is a fuzzy quantity
2) E is partitioned into equivalent sets using a
similarity function, which gives a relative measure
of similarity in psychological reaction, and due to
the fuzziness coming from psychological evaluation
and fuzziness of sensible temperature itself, cannot
confirm identicalness of psychological reactions in
the two environments.
Now, since one feels as hot in any environment
belonging to the same equivalent set by definition,
the following approximation holds:
|
ℇ
≈.
(3)
Thus, we can reduce the problem of defining T
into
that of defining
:→ℝ, where={ℇ
|∈ℕ}.
There are several possible ways to define
, and
below are the examples:
SIGMAP2012-InternationalConferenceonSignalProcessingandMultimediaApplications
152

1) Standard Sensible Temperature
Let c
1
, c
2
, …, c
n
be arbitrary constants in the
definition of ℇ
and call an environment e = (x
1
,
x
2
,…,x
n
) s.t. (c
2
,c
3
,…,c
n
) = (x
2
,x
3
,…,x
n
) a standard
environment. Then:
(
)
=..∈ℇ
(4)
2) Heat Index Definition
The use of physical temperature as sensible
temperature suffers from an issue that it is not clear
as to whether one feels hot or not, because different
people react differently to the same environment.
For instance, a person coming from a warmer area
might think that a room at 18°C and humidity of
50% is cold, while another person coming from a
colder area might think the other way around. Thus,
it is desirable to introduce an index that expresses
thermal comfort so that we can speak of universal
measure of apparent heat. For example, if the value
of the index is +2 for the two persons, then their
sensed hotness is the same.
The actual definition is as follows. Let
,
,…,
be the average values of the
environmental factors of the area from which one
comes,
(
,
,…,
)
∈ℇ
, e’ the environment in
which we try to find the value of the index, ′∈ℇ
,
and C the constant for sensitivity to temperature
change. Then, the index can be defined as:
[
(
ℇ
)
−
(ℇ
)]
(5)
where
(
ℇ
)
=s.t. (c
2
,c
3
,…,c
n
) = (
,
,…,
).
These definitions enable us to express change in
sensible temperature quantitatively. Definition (2) is
used in this paper with the values of the constants
being those of the reference environments.
3.2 Similarity Function and
Information Extraction Analysis
The definition of the similarity function, S, is
detailed in this section. As is stated in the above, the
function is an indicator of similarity of
psychological reaction to apparent heat in two
environments. To evaluate the similarity, the
reaction needs to be measured in some way before
any numerical comparison can be made. Let y
1
,
y
2
,…, y
m
be the measurements of this reaction such
as skin conductance and answers to a questionnaire.
Define the Kansei space, K, by K =
{
=
(
,
,…,
)|
∈ℝ
}
=ℝ
. Taking the
measurements in the environments naturally defines:
R
:E→
K
b
y
R
(
)
=
(6)
where k is comprised of the measurements in the
environment e. We call R
i
the reaction function.
Here, the subscript i indicates individual dependence
of the function.
Based on the distribution of R
i
(E), we assess
similarity in psychological reaction in different
environments. Before carrying this out, note that
some measurements might correlate not only with
sensible temperature but also with different
psychological quantities such as a sense of beauty.
For instance, a score for a pair of adjectives, Lively
Ù Dull, could be an indicator of sensible
temperature, but at the same time, it might also
respond to music. Thus, in order to extract only
important information and form new measures from
the old ones, we apply Information Extraction
Analysis (IEA), which combines Principal
Component Analysis (PCA) with an information
extraction procedure. First, we introduce new useful
measures and reveal their sensitivity by applying
PCA to
⋃
R
(E)
. The reason why we apply PCA to
⋃
R
(E)
and not to R
i
(E), is to take into account the
tendency of the entire group. In actual practice,
instead of
⋃
R
()
,
⋃
R
({
(
,
,
,…,
)
|
≤
≤
∧∈ℕ}) is considered, where (t,c
2
,c
3
,…,c
n
)
is called a reference environment, which is a point
on the line L. Also, T
u
and T
l
are upper and lower
bounds of the range of temperature employed in the
experiment, respectively. Application of PCA brings
in a new coordinate axes, called principal coordinate
axes, and origin to Kansei space, K. Among these
principal components, we keep only the components
that satisfy the following criteria:
1) Contribution to contribution factors to
accumulated contribution factor is significant
2) Coefficient of correlation of the component with
physical temperature is relatively large
3) The principal component has strong relation to
sensible temperature
Using these criteria, only the information strongly
related to sensible temperature is extracted. Some
justification on the criteria is as follows. In the
process of PCA, the components that do not
contribute to the accumulated contribution factor are
disregarded. Generally speaking, by reordering the
principal components in increasing order if
necessary, the first several components whose sum
of contribution factors exceeds 70% are used. This is
what is meant in criterion (1). Criterion (3) is based
on a technique commonly practiced by people who
use PCA. One task in PCA is to interpret what the
newly obtained principal components stand for.
There are several procedures that one can adapt. If a
principal component turns out to be irrelevant to
TheEffectofMulti-mediaContentsinReducingSensibleTemperature
153
sensible
compon
e
Mathem
a
corresp
o
translati
n
⋃
R
({
(
finally
subspac
e
If we d
e
by Ext:
K
and its
c
extracte
d
the orde
r
Simi
l
using th
e
p
sychol
o
which is
d
where
w
extracte
d
taking i
n
tempera
t
defined
a
S
(
,
4 E
X
4.1
T
The
p
ur
p
into the
on appa
r
much r
e
attained
the dive
r
lemon a
r
of blue
c
total, 18
First
,
experim
e
environ
m
Figure
4
adjustab
l
are sho
w
figures
t
apparat
u
environ
m
humidit
y
conditio
n
temperature
e
nt will be
a
tically s
p
o
nd to first r
o
n
g the origi
n
,
,
,…,
doing orth
o
e
spanned by
e
note the fun
c
K
→K′, wher
e
c
omponents e
x
d
components
r
of increasin
g
l
arity in
p
syc
e
extracted in
o
gical quanti
t
defined as fo
(,)=
w
i
is a corr
d
componen
t
n
to account s
e
t
ure. Therefo
a
s
,
)
=d(Ext
X
PERIM
E
T
he Metho
d
p
ose of the
e
effect of visu
r
ent heat. In
e
duction in
s
by presentin
g
r
viewpoint a
l
r
oma. The m
o
c
olor. The da
t
individuals
p
,
the referen
c
e
nt were
m
ent was re
a
4
.1.1, where t
e
l
e. The detai
l
w
n in Figure
t
hat the room
u
ses in order t
o
m
ental factor
s
y
on sensibl
e
n
of the roo
m
after this i
n
excluded fr
o
p
eaking, t
h
o
tating ortho
n
n
to the ce
n
)
|
≤≤
o
gonal proj
e
the principal
c
tion that doe
s
e
we call K’ t
h
x
tracted com
p
are subscrib
e
g
contributio
n
hological rea
c
formation. T
h
t
y is a metri
c
llows:
(
−
elation coef
f
t
with phys
i
e
nsitivity to
c
re, the simi
l
∘R
(
)
,Ext
∘
E
NT
d
of the Ex
p
e
xperiment
w
al stimuli an
d
particular, w
e
s
ensible tem
p
g
a movie of
s
l
one and the
m
o
vie is slow
t
a were analy
s
articipated in
c
e environm
e
prepared.
a
lized in a
e
mperature a
n
l
ed specifica
t
4.2.1. It can
was empty
e
o
minimize t
h
s
other than
e
temperatu
r
e
m
. The factors
n
terpretation,
o
m considera
t
h
ese opera
t
n
ormal basis,
n
ter of mas
s
∧∈ℕ}),
e
ction onto
components
s
these opera
t
h
e extracted s
p
p
onents. Here
,
e
d from 1 to
m
n
facto
r
.
c
tion is eval
u
h
e measure o
f
c
d:K′×K′
→
)
f
icient of th
e
i
cal tempera
t
c
hange in sen
s
l
arity functio
n
∘
R
(
)
)
p
eriment
w
as to invest
i
d
olfactory sti
m
e
researched
p
erature coul
d
s
cuba diving
f
m
ovie along
w
and relaxing,
s
e
d
using IE
A
the experime
n
e
nts used in
Each refer
e
room, show
n
n
d humidity
w
ions of the r
o
be seen fro
m
e
xcept for se
v
h
e influence o
f
temperature
e
and control
whose effec
t
the
t
ion.
t
ions
then
s
of
and
t
he
left.
t
ions
p
ace
, the
m
’ in
u
ated
f
this
→
ℝ,
(7)
e
i
th
t
ure,
s
ible
n is
(8)
i
gate
m
uli
how
d
be
f
rom
with
full
A
. In
nt
.
this
e
nce
n
in
w
ere
r
oom
m
the
v
eral
f
the
and
l
the
t
s on
sen
co
n
fix
e
te
m
eac
en
v
co
n
en
v
ref
e
te
m
su
bj
roo
an
d
wh
e
60
%
en
v
Fig
u
dia
g
the
me
a
co
n
in
ind
i
en
v
ref
e
we
r
mo
v
wa
s
olf
a
mi
n
28
°
div
i
aft
e
b
re
a
qu
e
sible temper
a
n
stant in this
e
d at 70% du
r
m
perature was
h
time th
e
v
ironment.
T
n
ditions we
r
v
ironments
f
e
rence envir
o
m
perature of
bj
ects were as
m
under the
c
d
then take a
e
re the temp
e
%
. This proc
e
v
ironment.
u
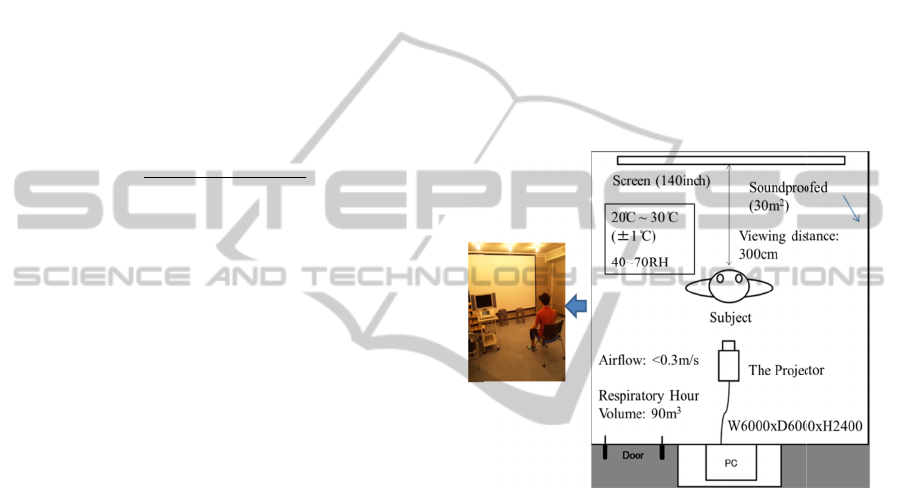
re 4.1.1: Th
e
g
ram of the e
x
r
oom.
The psychol
o
a
sured durin
g
n
sisting of 26
T
able 4.2.2,
i
cating in w
h
v
ironmen
t
.
A
e
rence envir
o
r
e presented
v
ie with and
s
presented
a
a
ctory exha
u
n
utes in the r
°
C, humidity
i
ng was disp
e
r a 10 minut
e
a
ks, the subj
e
e
stionnaire.
a
ture were n
o
room. Humi
d
r
ing the entir
e
changed by
e
subject
m
T
he enviro
n
r
e chosen
fo
r this ex
p
o
nments e
T
w
the referen
c
k
ed to stay
fo
c
ondition of a
10 min bre
a
e
rature was 2
3
e
ss was repea
e
thermostat r
o
p
erimental set
o
gical reactio
n
g
the break,
pairs of opp
o
to be score
d
h
ich way a t
a
A
fter the
m
o
nments wer
e
with contro
l
without lem
o
a
t short inter
v
u
stion. They
o
om in whic
h
is 70%, an
d
l
ayed first w
e
s brea
k
, wit
h
e
cts were as
k
o
t analyzed
w
dity of the
r
e
experiment.
1°C from 2
6
m
oved to
t
n
ments und
e
as the
p
eriment. C
a
w
here T ind
i
c
e environ
m
f
or 5 min ins
i
reference en
v
a
k in a sepa
r
3
°C and hu
m
a
ted for each
oom and the
up with speci
f
n of each su
b
using a que
s
o
site adjectiv
e
d
from -3 to
a
ke
r
felt in
t
m
easurements
e
taken, the
l
sti
m
uli, na
m
m
on aroma. T
h
v
als in order
spent ano
t
h
the temper
a
d
the movie
w
ith lemon ar
o
h
out aroma.
D
k
ed to fill in
w
ere kept
oom was
Physical
6
to 30°C
t
he next
e
r these
reference
a
ll these
cates the
ent. The
i
de of the
v
ironmen
t
r
ate room
m
idity was
r
eference
schematic
f
ication of
b
ject was
s
tionnaire
e
s, shown
3 scales
t
he given
in the
subjects
m
ely the
h
e aroma
to avoid
t
her five
a
ture was
of scuba
o
ma, and
D
uring the
the same
SIGMAP2012-InternationalConferenceonSignalProcessingandMultimediaApplications
154
4.2 The Results of the Experiment
The data of these measurements were analyzed using
IEA. We first applied PCA to the data and found the
contribution factor and corresponding accumulated
contribution factor for each principal component,
which are listed in Table 4.2.1. Although there are as
many principal components as the questions in the
questionnaire, only ten principal components are
shown in the figure. This is because those principal
components that are not listed had small contribution
factors so that they did not contribute to the
accumulated contribution factor notably. It can be
seen from the figure that the accumulated
contribution factor of the 7th principal component
was more than 80%. Thus, we disregard all the
components beyond the 7th components and
analyzed the data using only the first seven
components.
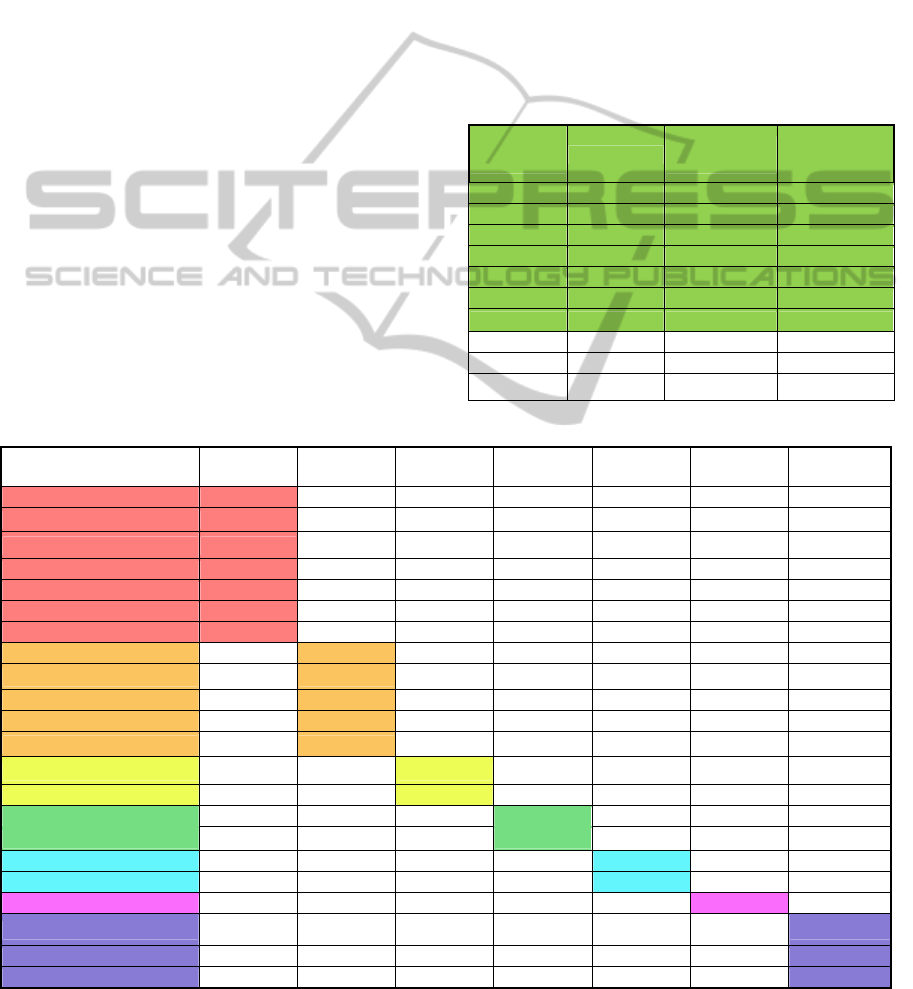
Then, from the value of each component of the
eigenvectors in the original space, which is shown in
Table 4.2.2, we could interpret what the new
components expressed. The columns correspond to
the eigenvectors, and the rows correspond to each
question in the questionnaire. The questions are
grouped together based on the values of the
components. We also computed the linear
correlation coefficients between each principal
component score and physical temperature. The
computational results are summarized in Table 4.2.3.
It was concluded from these two tables that the 2nd,
4th, and 5th principal components were not related
to sensible temperature, and thus excluded from the
analysis. The 2nd principal component was excluded
because Table 4.2.2 indicates that it did not respond
to changes in sensible temperature. For the 4th and
5
th
principal components, not only does Table 4.2.2
indicate that they are unrelated to sensible
temperature change, but also the corresponding
correlation coefficients were extremely low.
Table 4.2.1: The eigenvalues for principal components.
Principal
Component
Eigenvalue
Contribution
Factor (%)
Accumulated
Contribution
Factor (%)
1 8.93 40.60 40.60
2 2.67 12.15 52.76
3 1.88 8.53 61.29
4 1.61 7.31 68.59
5 1.41 6.42 75.01
6 1.02 4.62 79.63
7 0.87 3.94 83.57
8 0.66 2.99 86.56
9 0.65 2.95 89.51
10 0.43 1.95 91.46
Table 4.2.2: The eigenvectors for principal components.
Adjective Pair
1
s
t
Principal
Component
2
nd
Principal
Component
3
rd
Principal
Component
4
th
Principal
Component
5
th
Principal
Component
6
th
Principal
Component
7th Principal
Component
Warm ↔ Cold
0.2195
-0.2168
0.0935
0.0472
0.0161
0.3255
-0.2167
Fun ↔ Bothersome
-0.2773
-0.0105
-0.1173
0.0473
0.0393
-0.1664
-0.1095
Happy ↔ Unhappy
-0.2610
-0.0381
-0.1185
0.0410
-0.2523
-0.0904
-0.1720
Sensitive ↔ Insensitive
-0.2219
-0.1509
-0.1093
-0.1104
0.0047
-0.0535
-0.3490
Comfortable↔ Unpleasant
-0.2954
-0.0004
-0.0659
-0.1345
0.2295
0.0651
-0.1820
Kind ↔ Unkind
-0.2917
-0.0712
-0.1424
0.0322
0.1859
-0.0416
-0.0674
Damp ↔ Dry
0.2732
0.1050
-0.0445
-0.0100
-0.2210
0.2458
0.1160
Rich ↔ Poor
-0.0114
0.4212
0.0946
0.0834
0.1027
-0.2292
0.0633
Complex ↔ Simple
-0.0485
0.3544
-0.2584
0.1823
-0.1934
0.1989
0.0168
Massed ↔Scattered
-0.0610
0.4261
0.2032
-0.2452
-0.1090
0.1916
-0.1766
Rough ↔ Smooth
0.0939
0.3826
-0.3562
-0.1899
-0.0919
-0.3164
-0.0408
Fulfilling ↔ Nihilistic
-0.0602
0.3403
0.0054
-0.4669
-0.3112
0.1820
-0.0272
Calm ↔ Restless
-0.0740
0.2196
0.5018
0.0189
0.2621
0.1384
0.1958
Enthusiastic ↔ Tepid
-0.2453
-0.0193
0.3077
0.1174
0.0980
0.1096
0.1115
Rational ↔ Emotional
-0.1466
0.1998
0.0470
0.5267
-0.0169
0.0778
-0.2907
Beautiful ↔ Ugly
-0.0326
0.2224
-0.1404
0.5412
-0.2367
-0.1980
-0.0527
Sharp ↔ Blunt
-0.2190
-0.1150
-0.1918
-0.0072
-0.2332
0.2236
-0.1225
Lively ↔ Dull
-0.1929
-0.0473
0.4780
-0.0207
0.5128
0.0849
0.1054
Pleasing ↔ Unpleasing
-0.2657
-0.0533
-0.0886
-0.0605
-0.1960
0.4433
0.0596
Preferable ↔ Unpreferable
-0.3035
0.0582
-0.1134
-0.0832
-0.2246
-0.2593
0.3712
Clear ↔ Unclear
-0.2741
0.0529
0.1410
0.0250
0.2582
0.0977
-0.4738
Good ↔ Bad
-0.2840
-0.0563
-0.0825
-0.1090
0.1608
0.3464
0.4131
TheEffectofMulti-mediaContentsinReducingSensibleTemperature
155
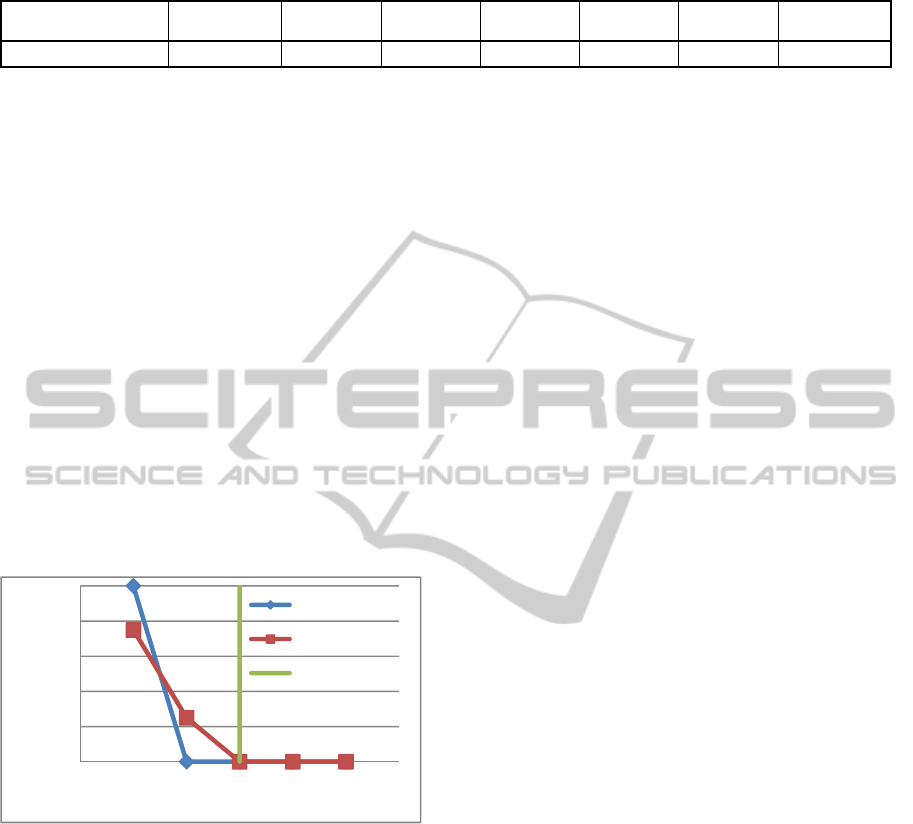
Table 4.2.3: The table of correlation coefficients between principal components and physical temperature.
Correlation Coefficient
1
s
t
Principal
Component
2
nd
Principal
Component
3
rd
Principal
Component
4
th
Principal
Component
5
th
Principal
Component
6
th
Principal
Component
7
th
Principal
Component
Physical Temperature
-0.687
0.215
-0.126
-0.076
0.065
-0.319
0.117
Then, we transformed the raw data of
psychological measurements in the control
environments to obtain the corresponding results
expressed in principal components and computed the
distance from each of these two data points in K’ to
each point corresponding to one of the reference
environments in order to find the closest reference
environment to each control environment. The
computational results are illustrated in Figure4.2.1.
It can be observed from the figure that in both of the
control environments sensible temperature of each
subject decreased. Also, presentation of the aroma
increased the percentage of the subjects
experiencing reduction of sensible temperature by
2°C from 75% to 100%. The average reduction in
the control environment with only the movie was
1.75°C, and that in the control environment with the
movie along with lemon aroma was 2°C. This result
is consistent with the research result that mint
flavour caused to feel colder (Shoji, 2005).
Figure 4.2.1: The graph illustrating the effect of control
stimuli to reduce the sensible temperature.
5 CONCLUSIONS
As a summary, in this study:
1) A new definition of sensible temperature that
takes into account the factors not traditionally
considered such as scent and visual images is
introduced, thereby allowing quantitative estimation
of change in the sensible temperature by these
factors.
2) The experimental results support the conclusion
that lemon aroma can enhance the effect.
In the future, we would like to investigate the effect
on apparent heat of other types of aromas and make
compassions to determine which aromas have the
strongest effects in lessening apparent heat. The
effects of other types of stimuli are also subject to
future investigation. We are convinced that the
results of these investigations will contribute to
energy saving. For practical application, we would
also like to devise customized scent delivery method
in office space. Furthermore, we would like to reveal
the ethnic, gender, and regional variation in response
to change in environmental factors by accumulating
the data of psychological reaction for various groups
under specified reference environments and reveal
the trend of its distribution
⋃
R
()
. With enough
data, it would also be possible to estimate one’s
sensible temperature in a given environment simply
by taking some standard measurements of
psychological reaction in an environment together
with one’s personal information such as one’s ethnic
group and place of residence.
REFERENCES
Fanger, P. O., 1972. Thermal comfort: Analysis and
applications in environmental engineering, McGraw-
Hill, New York.
Kimura, M., Mori, T., Suzuki, H., Endo, H., Kawano, K.,
2001. EEG changes in odor effects after the stress of
long monotonous work. In Journal of International
Society of Life Information Science, 19(2), 271-278.
International Society of Life Information Science
Missenard, A., 1931. Temperature effective d’une
atomosphere: Temperature resultant d’un milieu. In
Chaleur et Industrie, 137(12), 552-557. Association
des Anciens élèves de l’"ECI."
Nakamoto, T., 2008. Olfactory display: Multimedia tool
for presenting scents, The fragrance journal Ltd.
Tokyo.1
st
edition.
Shoji, K., 2005. The effect of scent on sensation and
texture, In Aroma Research 6(3), 283-289, The
fragrance journal Ltd.
Steadman, R. G., 1979. The assessment of sultriness. Part
I: A temperature-humidity index based on human
physiology and clothing sciences. In J. Appl. Meteor.
18, 861-873. American Metrological Society.
Yasuda, D., Yashiro, T., Magori, B., Inagaki, K., Iinuma,
T., Furukuchi, M., 2010. The research about comfort
of office utilizing the essential aroma oil. In
Summaries of Technical Papers of Annual Meeting,
40039, 83-84. Architectural Institute of Japan.
0%
20%
40%
60%
80%
100%
25 26 27 28 29 30 31
Number of Subjects (%)
Physical Temperature of the Reference
Environment Closest to Each Control …
A Movie with
Leomon Aroma
A Movie Alone
Physical Temp. of
Control Env.
SIGMAP2012-InternationalConferenceonSignalProcessingandMultimediaApplications
156
