
Link Quality Estimator for a Mobile Robot
Narek Pezeshkian, Joseph D. Neff and Abraham Hart
SPAWAR Systems Center, Pacific, CA 92152, San Diego, U.S.A.
narek.pezeshkian@navy.mil
Keywords: Link Quality, Video Quality, Estimator, Metric, Mobile Robot.
Abstract: Maintaining link connectivity between a mobile robot and its control station in a non-line-of-sight
environment is challenging. One solution is to use intermediate relay radios that the robot can carry and
deploy when and where needed to maintain the link. However, the precise placement locations for the
relays are not known ahead of time. Therefore, the deployment decision must be formulated online and the
relays deployed before the link with the control station breaks. A link-quality estimator is developed based
on video throughput and received signal strength indicator data. The estimator takes into account human
perception of video quality that is obtained via subjective testing by an operator. The data is used to train
the link-quality estimator, which issues an alert that can be used as a trigger for an automatic relay
deployment mechanism or to advise the operator to manually deploy relays before the link between the
robot and control station fails.
1 INTRODUCTION
Tactical mobile robots have been increasingly used
by the military over the past several years. This is
especially true for Explosive Ordnance Disposal
(EOD) teams that use robots to investigate and
neutralize Improvised Explosive Devices. These
robots are remotely controlled from the operator
control unit (OCU) using digital radios. The high
operating frequency of these radios requires a line-
of-sight (LOS) to the OCU, which is difficult to
maintain in urban environments. The link between
the robot and OCU can fail, usually rather quickly,
when operating beyond LOS due to multipath
interference and signal fading.
Controlling a robot via a tethered connection,
typically fiber-optic, eliminates the LOS problem
but introduces new ones. Tethered connections can
snag and break, limiting mobility. Advanced radio
systems that utilize sophisticated modulation
techniques and take advantage of MIMO antenna
technology thrive in multi-path environments and
can overcome the LOS limitations to a degree.
However, obstacles that severely block and attenuate
the signal can still be problematic.
The use of relays, on the other hand, adds an
unprecedented degree of freedom to where robots
can operate. Relays can entirely overcome severe
obstacle blockages so long as a LOS can be
maintained with adjacent radios in a chain of relays.
Determining the placement location of such relays is
critical. The focus of this paper is the formulation of
a link-quality (LQ) estimator, the output of which is
used either by the robot (automatically) or the
operator (command sent from the OCU) to release a
relay before the link breaks. Section 2 provides a
brief background of various relay systems designed
for tactical robots. Section 3 discusses the LQ
estimator design. Simulation results are outlined in
section 4, and section 5 concludes the paper.
2 BACKGROUND
The solution to address the LOS requirement
between a tactical robot and its OCU began in 2002
under the Autonomous Mobile Communications
Relay (AMCR) project (Nguyen et al., 2003). The
goal of the AMCR system was to provide extended
range and non-line-of-sight (NLOS) operational
capability for tactical robots. This was
accomplished through the use of dedicated mobile
relay robots (or mobile nodes) that followed the lead
robot in a convoy formation and automatically
stopped when needed to maintain the link. The
radios on-board the lead robot, mobile nodes, and
OCU formed a mesh network that allowed the
operator to teleoperate the lead robot based on video
87
Pezeshkian N., D. Neff J. and Hart A..
Link Quality Estimator for a Mobile Robot.
DOI: 10.5220/0004038400870094
In Proceedings of the 9th International Conference on Informatics in Control, Automation and Robotics (ICINCO-2012), pages 87-94
ISBN: 978-989-8565-22-8
Copyright
c
2012 SCITEPRESS (Science and Technology Publications, Lda.)
relayed to the OCU.
The mobile nodes must be set up in a specific
order in such a convoy since each mobile node is
programmed to follow the robot in front of it. In
addition, each mobile node is programmed to
monitor the received signal strength indicator (RSSI)
data of the node immediately behind it. For
example, the last mobile node in the convoy
monitors the RSSI of the OCU. The RSSI data,
which is used as a measure of the link quality, is
compared to a predetermined threshold, below
which the mobile node stops to maintain the link.
The AMCR solution proved to be very successful
and the commercial-off-the-shelf (COTS) 802.11b
radios and processor boards were extremely cost
effective. However, the AMCR system was a
research project and never designed for field use,
since the mobile nodes were expensive and
logistically impractical.
A more realistic solution was developed under
the Automatically Deployed Communication Relays
(ADCR) project (Pezeshkian et al., 2007). The
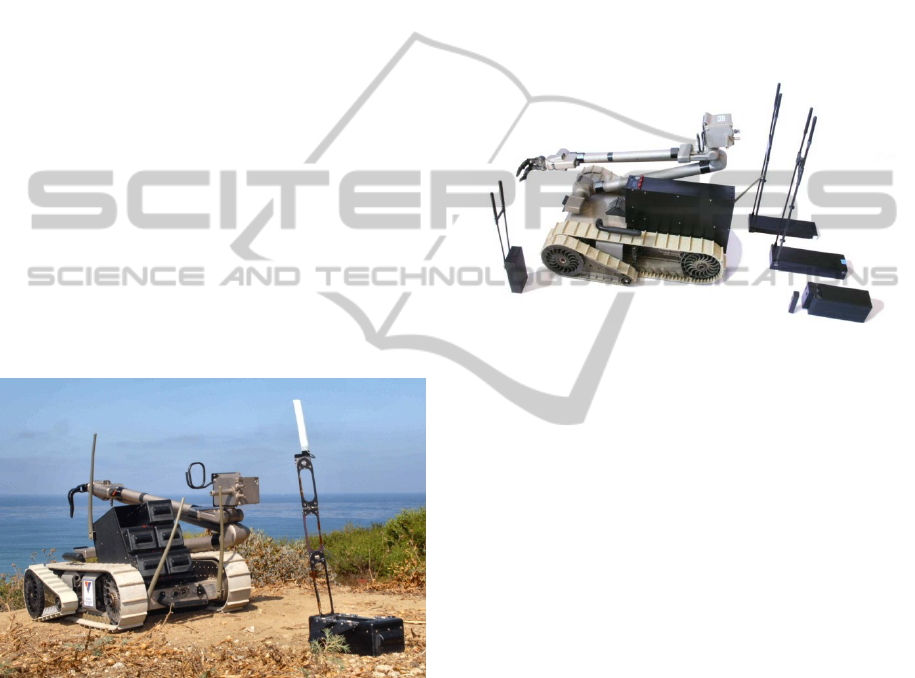
ADCR system shown in Figure 1 consists of a
Deployer and several Relay “Bricks”. The Deployer
carries the Relay Bricks and mounts onto a small
ground robot.
Figure 1: ADCR Deployer mounted on an iRobot PackBot
with one deployed and five stowed Relay Bricks.
The Deployer and the Relay Bricks each have the
same radio hardware and RSSI-based link-quality
estimator that is used by the AMCR system.
However, the only mobile node is the Deployer,
therefore, the link monitoring and the decision to
eject a Relay Brick is formulated by the Deployer
radio. Once a Relay Brick is ejected it self-rights and
extends the antenna. As the operator controls the
robot along its path more Relay Bricks are ejected as
needed to maintain the link.
The success of ADCR led to several licensing
agreements with commercial developers.
Subsequent projects led to additional developments
that improved upon the system. For example, the
redesigned Deployer of the Automatic Payload
Deployment System (APDS) (Pezeshkian et al.,
2010) allows a robot to carry and deploy not only
Relay Bricks but a wide range of other types of
payloads, such as leave-behind sensors and
containers. The container payloads can be used to
carry food, ammunition, medical kits, and anything
else that fits within. The Relay Bricks were also
redesigned to contain faster radios and an improved
antenna lift mechanism as shown in Figure 2.
Figure 2: APDS Deployer mounted on an iRobot PackBot.
Various payload types are shown around the robot.
The interest that was generated by numerous
publications and successful demonstrations of the
APDS and ADCR systems led the Naval EOD
Technology Division (NAVEODTECHDIV) to fund
the development of a robust radio repeater solution
for use by currently-fielded robotic vehicles. It was
necessary to deliver this solution quickly; therefore,
a simplified, albeit robust system based on APDS
technology was developed under the Manually
Deployed Communication Relays (MDCR) project.
The MDCR system omits the RSSI monitoring and
automatic-deployment capability of APDS, and
instead relies entirely on remote commands sent
from the OCU to deploy the Relays as the operator
sees fit. Although simple in design, the MDCR
system has been successfully field tested with plans
to mass produce additional units.
Although RSSI-based link monitoring has been
successful in the ADCR and APDS systems, it is not
an ideal solution, as will be explained in section 3.
Therefore, the goal of the LQ estimator outlined in
this paper is to provide a superior estimation method
that will assist the MDCR operator in placing relays,
and to also provide a trigger to automatically eject
relays for future ADCR systems.
ICINCO2012-9thInternationalConferenceonInformaticsinControl,AutomationandRobotics
88

3 QUANTIFYING LINK
In the MDCR system the Relays are deployed based
on operator command. Two factors play a role in
the Relay deployment decision-making process of
the operator: 1) prior knowledge of LOS loss – the
operator knows that controlling the robot around a
large obstruction will cause a loss of LOS so a Relay
is deployed before proceeding, and 2) video
degradation – as the distance between the robot and
OCU increases, even under LOS conditions, the
operator deploys a Relay when video quality
degrades.
Although these factors can be effective for
deploying Relays, in order to maintain the link
between the robot and the OCU, the operator for the
most part is guessing as to where to place the Relays
based on experience and intuition about the RF
environment. If the relaying system could provide
an indicator based on some sort of LQ estimator that
can warn of a failing link, however, the operator
would be in a much better position to optimize Relay
placement. This is important since the number of
Relays carried by a robot is limited and maximizing
the distance between the Relays translates into
maximizing the stand-off distance of the robot.
Furthermore, the LQ estimator can be used by a
relaying system (e.g., ADCR) to provide automatic
Relay deployment capability, effectively alleviating
the operator from the deployment task.
It is also important to keep in mind that the link
under consideration is between the robot and the
next-hop neighbor of the routing path leading back
to the OCU. This is, in fact, the only dynamic link
given that the only mobile node is the robot and all
other nodes (OCU and previously deployed Relays)
are static.
3.1 Link Quality
In this section a background on recent work on link
quality is given, followed by sections that describe
the proposed LQ metrics used by the LQ estimator.
3.1.1 LQ Background
A plethora of research on LQ estimation can be
found in the literature. Many schemes combine
multiple variables available from the physical and
link layers to form a more comprehensive and robust
LQ metric. Rondinone, Ansari, Riihijärvi, and
Mähönen (2008) propose multiplying the Packet
Reception Rate (PRR) of a link by the corresponding
mean RSSI value to obtain a new LQ indicator that
can be used by a network to select an optimal
routing path. Srinivasan, Kazandjieva, Jain, and
Levis (2008) combine PRR and channel burstiness
to estimate TCP throughput. Liu and Cerpa (2011)
combine RSSI, PRR, signal-to-noise ratio (SNR)
and the Link Quality Indicator (LQI) provided by
the CC2420 radio chip to provide a probability of
successfully delivering the next packet.
Yet combining variables is not the only
approach. Farkas, Hossmann, Ruf, and Plattner
(2006) propose using pattern matching to predict the
future behaviour of a link. Each node keeps a time
series record of the SNR with each of its links and
uses pattern matching to find the best match in an
attempt to estimate the future behaviour of the SNR.
Qin, He, and Voigt (2011) develop a new LQ
estimator, called the Spectrum Factor (SF), which is
derived from frequency-domain data.
3.1.2 LQ Data
An LQ estimator can be used by a routing protocol
in a mesh network to select optimal routing paths
(Liu et al., 2010 and Liu and Cerpa, 2011). The goal
of the LQ estimator for the MDCR system is
somewhat different: Develop an LQ estimator that is
suitable in predicting link failure such that a Relay
can be deployed before the link breaks.
The LQ estimators discussed in the previous
section are unsuitable for use given the stated goal.
Rondinone et al. (2008) suggest multiplying the
PRR of a link by the corresponding mean RSSI
value to help in selecting routing paths. Since there
is only one link under consideration (between robot
and next-hop neighbor along the routing path
leading to the OCU), this multiplication provides no
new information. Srinivasan et al. (2008) attempt to
estimate TCP throughput, which is unnecessary
since the video data of the robot uses UDP packets
and the throughput is readily available. Liu et al.
(2011) make use of SNR and LQI data that is
unavailable in the 802.11 radios used in the MDCR
system. Farkas et al. (2006) use pattern matching to
predict future behaviour of a link. This requires
some level of repetitive pattern to be present in the
collected data, which is highly unlikely given the
random movements of a teleoperated robot. Finally,
Qin et al. (2011) estimate LQ in the frequency
domain, which requires raw RF data that is not
easily obtainable from the MDCR radios.
The data selected for the development of the
proposed LQ estimator is UDP throughput (packets-
per-second) and RSSI, which are readily available
and ease integration of the estimator into the existing
mesh network software of the MDCR system. The
LinkQualityEstimatorforaMobileRobot
89

throughput data is also a direct indicator of video
quality – one of the key factors in the deployment
decision-making process of the operator. Video
quality, however, is subjective. A slightly choppy
video may be acceptable to one operator and
unacceptable to another. To quantify video quality,
an experiment was devised where an operator
controlled the robot along a predetermined path and
when the video quality, as judged by the operator,
began to degrade, the operator marked that point in
time. The marking method is simply a key press on
a test laptop that collects throughput and RSSI data
along with operator key presses, all synchronized in
time. There were two different key presses involved
in this experiment: The #2 key was pressed when
video quality began to degrade and the #3 key was
pressed when the link was completely lost. These
two moments in time are t
F
(failing) and t
L
(lost),
respectively. The link-failure period (t
LF
) is simply
t
L
– t
F
. A sample of collected data and key presses is
shown in Figure 3. A simple moving average (MA)
process is applied to all data to smooth out
variations.
Figure 3: Example of video throughput (blue) and RSSI
data (green) received at the OCU from a PackBot using
the MDCR system. Solid line is the average (μ) of past
five samples of underlying (dotted) data. Left and right
black lines represent t
F
and t
L
, respectively.
Many such trial runs were performed under two
different environments, one more prone to multipath
than the other. In all test trials, clear trends are
observed in the throughput data during t
LF
,
summarized as follows: 1) The throughput begins to
roll off sometimes gradually and sometimes
relatively sharp, and 2) the throughput variance
increases. The RSSI data, as expected, drops
gradually overtime as the robot moves away from
the OCU. Before t
F
, however, the throughput data
does not show any clear trend. The test trials show
that t
LF
varies between 10 to 20 seconds, which
provides ample time to issue an alert. These trends
are exploited in the design of the LQ estimator.
3.1.3 RSSI as Early Warning
RSSI data has been proposed as a good link-quality
metric by Srinivasan and Levis (2006) but the
limitations of this statement must be understood. It
has been shown by Vlavianos, Law, Broustis,
Krishnamurthy, and Faloutsos (2008) that RSSI data
is measured at the lowest rate and cannot
characterize the LQ at high transmission rates.
Furthermore, RSSI is only measured from the packet
preamble; therefore, if an interfering signal happens
to prevent proper reception of the preamble, the
RSSI will simply not be recorded. If the interfering
signal happens to corrupt the packet after the
preamble has been received, then the RSSI will be
recorded as if there is no interferer. Hence, RSSI
data is unchanged even in the presence of an
interferer. The work of Judd, Wang, and Steenkiste
(2008) further supports this assessment.
Broadband noise, however, is a concern. If the
overall noise floor is raised due to external
broadband sources of noise, the overall SNR of
received packets will decrease. This means that
RSSI data can only be measured down to the raised
noise floor since packets received below the noise
level will be corrupted. Looking at Figure 3 it may
seem reasonable to threshold the RSSI at about 10,
below which the throughput data enters the region of
degraded video quality, t
LF
. This approach may
work in the absence of broadband noise, but that
constraint cannot be guaranteed when operating in a
variety of environments.
The goal of the proposed LQ estimator is to
predict link failures so that a Relay can be deployed
before the link breaks. Preferably, some early
warning should be given to the operator by the
relaying system, followed by an imminent failure
alert so that the operator can deploy a Relay before
the link breaks. Interfering signals are not a major
concern given the operating environment, where the
overwhelming reason for link failure is due to signal
fading and loss of LOS. Broadband noise, however,
can exist. Given the limitations of RSSI, it is then
reasonable to use it only as a conservative early
warning system. Figure 4 shows the mean RSSI
value exactly at time t
F
, for all test trials. There are
clear variations but the overall range is low. A
conservative early warning of link failure can be
issued, for example, if the mean RSSI drops below a
threshold of 20. Selecting a high threshold leaves
quite a bit of margin should the noise floor increase
due to broadband noise.
100 120 140 160 180 200 220 240 260 280
0
10
20
30
40
50
60
Time (sec)
Throughput (packets per second)
100 120 140 160 180 200 220 240 260 280
0
20
40
60
RSSI
100 120 140 160 180 200 220 240 260 280
0
10
20
30
40
50
60
μ
TP
μ
RSSI
TP
RSSI
ICINCO2012-9thInternationalConferenceonInformaticsinControl,AutomationandRobotics
90

Figure 4: Mean RSSI value at time t
F
for all test trials.
3.1.4 Link Quality Metrics
An accurate estimation of imminent link failure is
required to alert the operator of complete loss of
connectivity or trigger the deployment of a Relay
from an automated deployment system. Since RSSI
data does not accurately reflect the ability of a link
to successfully deliver packets as discussed in
section 3.1.2, throughput data is used instead.
The first trend of the throughput data is increased
variance σ during t
LF
. At the same time, the mean μ
drops due to the second trend, the roll off. Since the
mean is high and variance low prior to t
F
and vice
versa during t
LF
, it is reasonable then to use the ratio
of the two as a metric. This is inspired from the
Ricean K-factor (Greenstein, Michelson, and Erceg,
1999), which is used as a measure of signal fading.
The ratio here is given as κ = μ/σ and is the first LQ
metric, LQM
κ
.
The second trend is the roll off. This is measured
by first taking N samples of throughput data then
calculating its intercept (x
1
) and slope (x
2
) using
linear regression. The assumption is that the N-
sample-long data is a straight line. Using a sliding
window, x
1
and x
2
are updated for each new sample.
The vector x = [x
1
x
2
] is the second LQ metric,
LQM
x
.
The trade-off between the false-alarm rate and
the miss rate is dependent on N. Low false-alarm
and low miss rates are desired. By setting N too
high, the data will be too smooth and the LQ
estimator slow to respond. This has the effect of
reducing the false-alarm rate due to reduced noise,
but increases the miss rate due to reduced response
time. In effect, the link is lost before the LQ
estimator has a chance to issue an alert. On the
other hand, setting N too low causes the data to be
too noisy, increasing the false-alarm rate, but
reducing the miss rate due to increased response
time. Since the cost of failing to issue an alert (a
miss) is much greater than alerting too soon (a false
alarm), the selection is biased towards reducing the
miss-rate by choosing N = 5.
3.1.5 Classifier
The keystrokes of the operator during the test trials
essentially label the collected data that are used to
train the LQ estimator. Half of the collected data is
used as training data and the other half as test data.
A labelling problem can be solved by classifiers.
Supervised training is used by two classifiers, one
for LQM
κ
and the other for LQM
x
. Each classifier
finds the optimal decision boundary between two
different sets of labelled data: those marked before t
F
(signal OK) and those marked during t
LF
(signal
failing). The hypothesis function for LQM
κ
is given
by z
κ
(θ
κ
) = θ
0
+ θ
1
κ and for LQM
x
the hypothesis
function is z
x
(θ
x
) = θ
0
+ θ
1
x
1
+ θ
2
x
2
. Both are
modelled as linear functions, which is a reasonable
assumption when looking at the data clusters in
Figures 5 and 6. The optimal parameter vector θ is
found by the classifier, which defines the decision
boundary that has values z(θ) ≥ 0 on one side and
z(θ) < 0 on the other.
The plot of the labelled κ values for all test trials
is shown in Figure 5. The plot of labelled x
1
and x
2
values for all test trials is shown in Figure 6. The
green circles represent values that take place before
t
F
and the red asterisks are data that take place
during t
LF
. Using logistic regression, an optimal
decision boundary is generated, shown as the blue
line. All green circles above the line are hits (link
OK) and those below the line are false alarms (link
failing when in fact it is not). All red asterisks
below the line are hits (link failing) and those above
the line are misses (link failing but no alert issued).
It is clear from both figures that there is overlap
between the labelled data. Given the high cost of
misses, the decision boundary is biased so as to
reduce the number of misses.
Figure 6 supports the roll-off trend of the
throughput data. Looking at Figure 3, the flat part of
the throughput data roughly corresponds to 40
packets-per-second and since it is flat its slope is
about zero. This correlates to the green cluster seen
in Figure 6. As the throughput begins to fail during
t
LF
, the packet rate drops, which corresponding to the
reduced x
1
(intercept) values. At the same time the
slope increases in the negative direction. This
corresponds to the red cluster in Figure 6. The
positive x
2
values are due to the variance of the
throughput data during t
LF
that can cause the slope to
2 4 6 8 10 12 14 16 18 20 22
4
6
8
10
12
14
16
18
T
es
t tri
a
l
Mean RSSI value at t
F
LinkQualityEstimatorforaMobileRobot
91
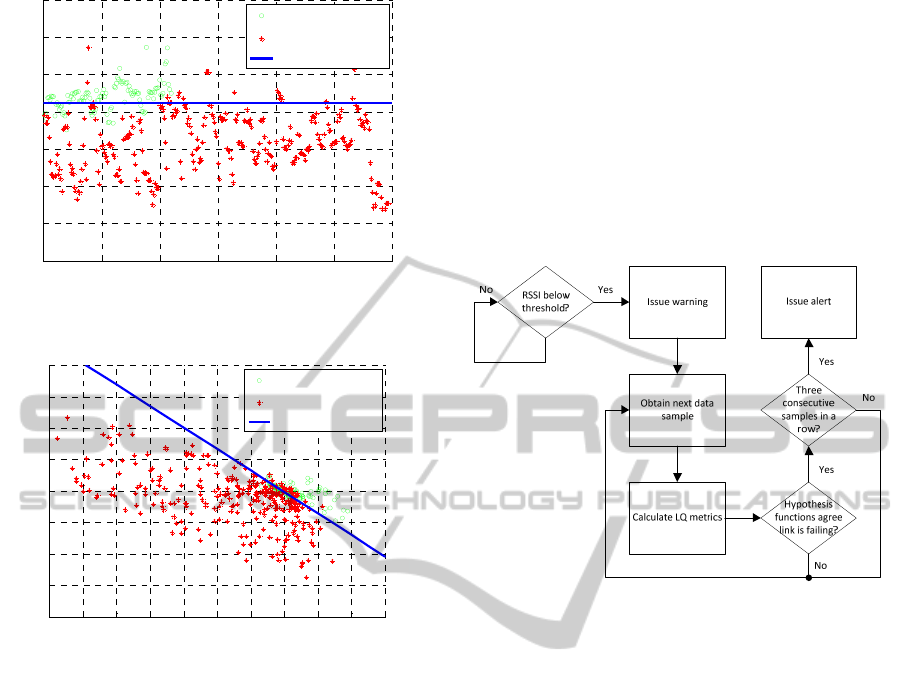
Figure 5: Plot of labelled κ and decision boundary. Its log
is taken to improve computation of the boundary.
Figure 6: Plot of x
1
vs. x
2
. Both variables have been
scaled to reduce their range for improved computation of
the decision boundary.
go positive momentarily. Notice, however, very few
occurrences of positive slope and high intercept
values take place. The occurrences of high intercept
and high negative slope can be explained by sharp
roll-offs, where the throughput value is still
somewhat high but the slope is steep.
3.1.6 Link-Quality Estimator
The goal of the LQ estimator is to provide an early
warning of link failure (based on RSSI data) and a
more accurate imminent link-failure alert (based on
LQ metrics calculated from throughput data). These
metrics are somewhat noisy due to the selection of N
chosen to increase responsiveness (reduced miss
rate), and hence, sensitivity (increased false-alarm
rate). Each metric alone is not sufficient to provide
an accurate estimation, therefore they are combined.
The manner in which they are combined is
essentially an AND operation between the
hypothesis functions. This implies that both
hypothesis functions z
κ
(θ
κ
) and z
x
(θ
x
) must agree
that the link is failing, which occurs when both
z
κ
(θ
κ
) and z
x
(θ
x
) are less than zero. Furthermore, the
LQ estimator does not issue an alert unless both
z
κ
(θ
κ
) and z
x
(θ
x
) are less than zero for three
consecutive samples in a row. This eliminates
momentary glitches where both hypothesis functions
are below zero. Finally, the LQ estimator does not
start calculating the imminent link-failure alert until
a warning is issued when the mean RSSI data falls
below a conservative threshold. A simplified flow
chart for the LQ estimator is shown in Figure 7.
Figure 7: Simplified flow chart for the LQ estimator.
The flow chart does not show the additional steps
taken to deactivate the warning and alert indicators.
For example, instead of using a single threshold,
hysteresis can be added to the mean RSSI data
where falling below the lower threshold (e.g., robot
moving away from OCU) causes a warning to be
issued, which is removed when the mean RSSI
moves above the upper threshold (e.g., robot moving
back towards OCU). In a somewhat similar manner
the link-failure alert indicator can be removed. For
example, an issued alert can be removed if both
hypothesis functions agree that the signal is good,
say for five consecutive samples.
Figure 8 shows a sample of a test trial. The plot
shows that a warning is issued when the mean RSSI
falls below 21 (hysteresis enabled). Once the
warning has been issued, the LQ estimator begins
calculating the LQ metrics and testing the hypothesis
functions z
κ
(θ
κ
) and z
x
(θ
x
). A value of less than zero
indicates a hit, which is shown on the plot as a red
box for LQM
κ
and a red diamond for LQM
x
. A link-
failure is indicated as a red ‘+’ sign when both
functions are less than zero at the same time
(LQM
AND
). An occurrence of this takes place at time
190 but no alert is issued. The LQ estimator issues
an alert when it observes three consecutive link-
0 50 100 150 200 250 300
-1
-0.5
0
0.5
1
1.5
2
2.5
log
10
(
κ
)
t
κ
< t
F
t
F
≤
t
κ
< t
L
Decision boundary
-0.1 0 0.1 0.2 0.3 0.4 0.5 0.6 0.7 0.8 0.9
-4
-3
-2
-1
0
1
2
3
4
Intercept (x
1
)
Slope (x
2
)
t
x2
,t
x1
< t
F
t
F
≤
t
x2
,t
x1
< t
L
Decision boundary
ICINCO2012-9thInternationalConferenceonInformaticsinControl,AutomationandRobotics
92

failure hits at time t
A
= 202. This occurs just after t
F
= 200, with plenty of time still left before the link is
completely lost at time t
L
= 213.
Figure 8: LQ estimator warning and alert. A warning is
issued based on RSSI and an alert based on throughput.
4 SIMULATION RESULTS
The LQ estimator will occasionally issue an alert
prior to t
F
due to the overlap in the training data as
shown in Figures 5 and 6. This is a desirable effect
because the alert is issued just before video
degradation begins. An alert issued after t
F
is also
acceptable so long as the alert does not take place
too close to t
L
, which may not provide enough time
to deploy a Relay before the link breaks. Therefore,
the accuracy of the LQ estimator is defined as the
percentage of alerts issued within a specified
window of time t
w
centered on t
F
for all test data.
The window t
w
is defined as t
F
± Δt. The value Δt is
equal to βt
LF
where 0 < β ≤ 1. This ensures that Δt is
no greater than t
LF
. The selection of β is somewhat
arbitrary. The smaller it is, the closer the alert issue-
time t
A
must be to t
F
before the alert is counted as an
accurate hit. Table 1 shows the accuracy result for
different values of β.
Table 1: LQ estimator accuracy.
β
Hit % False Alarm % Miss %
1/2 73 9 18
2/3 82 9 9
3/4 91 0 9
1 100 0 0
Table 1 shows that with β = 1 all alerts are issued
within t
F
± t
LF
, and 73% of alerts are issued within t
F
± t
LF
/2 with β = 1/2.
5 CONCLUSIONS
A link-quality (LQ) estimator is developed to
provide an accurate means of estimating an
imminent link failure, which is required to assist the
operator of a tactical mobile robot in deploying a
Relay before the link breaks. Since the robot carries
a limited number of Relays, increasing the distance
between deployment locations will increase the
operational range of the robot. The same LQ
estimator can also be used on an automatic Relay
deployment mechanism (such as the ADCR system)
as a trigger to eject a Relay.
The LQ estimator is based on LQ metrics
calculated from labelled throughput data. The
throughput data is labelled during test trials by the
robot operator, who marks the data when the video
quality begins to degrade and finally lost altogether.
This process is repeated for several trial runs in two
different operating environments. The labelled data
is used to train the LQ estimator, which is then
applied to test data that is not used in the training
session. The LQ estimator issues two alerts: 1) a
warning alert to the operator based on RSSI data,
which serves as a conservative estimate of a link
beginning to fail, and 2) a much more accurate link-
failure alert based on throughput data when an
imminent link failure is detected. The results from
the test data show that the LQ estimator achieves
high accuracy in issuing an alert before the link is
completely lost.
REFERENCES
Farkas, K., Hossmann, T., Ruf, L., Plattner, B., 2006.
Pattern Matching Based Link Quality Prediction in
Wireless Mobile Ad Hoc Networks. MSWiM’06.
Greenstein, L. J., Michelson, D. G., Erceg, V., 1999.
Moment-Method Estimation of the Ricean K-Factor.
IEEE Communications Letter, 175-176.
Judd, G., Wang, X., Steenkiste, P. 2008. Efficient
Channel-Aware Rate Adaptation in Dynamic
Environments. MobiSys’08.
Liu, T., Cerpa, A.E., 2011. Foresee (4C): Wireless Link
Prediction using Link Features. 10th International
Conference on Information Processing in Sensor
Networks, 294-305.
Liu, L., Fan, Y., Shu, J., Yu, K., 2010. A Link Quality
Prediction Mechanism for WSNs Based on Time
Series Model. Ubiquitous Intelligence & Computing
and 7th International Conference on Autonomic &
Trusted Computing, 175-179.
Nguyen, H. G., Pezeshkian, N., Raymond, M., Gupta, A.,
Spector J. M., 2003. Autonomous Communication
100 120 140 160 180 200 220
0
10
20
30
40
50
60
70
Throughput (packets per second)
Time (sec)
100 120 140 160 180 200 220
0
5
10
15
20
25
30
35
RSSI
Warning
Alert
Throughput
RSSI
LQM
x
LQM
κ
LQM
AND
LinkQualityEstimatorforaMobileRobot
93

Relays for Tactical Robots. 11th International
Conference on Advanced Robotics, 35-40.
Pezeshkian, N., Nguyen, H. G., Burmeister, A., 2007.
Unmanned Ground Vehicle Radio Relay Deployment
System for Non-Line-of-Sight Operations. 13th
International Conference on Robotics & Applications.
Pezeshkian, N., Nguyen, H. G., Burmeister, A., Holz, K.,
Hart, A., 2010. A Modular Design Approach for the
Automatic Payload Deployment System, Association
for Unmanned Vehicle Systems International.
Qin, Y., He, Z., Voigt, T., 2011. Towards Accurate and
Agile Link Quality Estimation in Wireless Sensor
Networks. Ad Hoc Networking Workshop, 2011 the
10th IFIP Annual Mediterranean, 179-185.
Rondinone, M., Ansari, J., Riihijärvi, J., Mähönen, P.,
2008. Designing a Reliable and Stable Link Quality
Metric for Wireless Seonsor Networks. REALWSN’08.
Srinivasan, K., Kazandjieva, M.A., Jain, M., Levis, P.
2008. PRR Is Not Enough.
Srinivasan, K., Levis, P., 2006. RSSI Is Under
Appreciated. Third Workshop on Embedded
Networked Sensors.
Vlavianos, A., Law, L.K., Broustis, I., Krishnamurthy, S.V.,
Faloutsos, M., 2008. Assessing Link Quality in IEEE
802.11 Wireless Networks: Which is the Right Metric?
IEEE 19th International Symposium on Personal,
Indoor and Mobile Radio Communications, 1-6.
ICINCO2012-9thInternationalConferenceonInformaticsinControl,AutomationandRobotics
94
