
Optimisation and Validation of a Minimum Data Set for the
Identification and Quality Control of EST Expression Libraries
A. T. Milnthorpe and Mikhail Soloviev
School of Biological Sciences, Centre for Biomedical Sciences, Royal Holoway, University of London,
Egham, Surrey, TW20 0EX, U.K.
Keywords: mRNA Expression, Transcriptomics, Gene Expression, EST Expression, Quality Control, Tissue Typing,
Tissue Identification, Differential Expression, Tissue Specific Markers, Differential Gene Expression in
Cancer.
Abstract: There are currently a few bioinformatics tools, such as dbEST, DDD, GEPIS, cDNA xProfiler and cDNA
DGED to name a few, which have been widely used to retrieve and analyse EST expression data and for
comparing gene expression levels e.g. between cancer and normal tissues. The outcome of any such
comparison depends on EST libraries' annotations and assumes that the actual expression data (EST counts)
are correct. None of the existing tools provide a quality control method for the selection and evaluation of
the original EST expression libraries. Here we report the selection, optimisation and evaluation of a minimal
gene expression data set using CGAP cDNA DGED. Our approach relies solely on the expression data itself
and is independent on the libraries annotations. The reported approach allows tissue typing of expression
libraries of different sizes containing between as little as 249 total EST counts and up to 13,929 total EST counts
(the highest tested so far).
1 INTRODUCTION
CGAP and other similar tools and databases such as
dbEST, EST (Digital Differential Display) and
GEPIS (Gene Expression Profiling In Silico)
compare expression levels between EST libraries
from normal and cancerous tissues. However, they
assume the reported EST counts to be correct
without employing a quality control method for the
underlying data. Also, methods used to generate
libraries may introduce biases into EST data, and the
tools used to analyse and retrieve data may
themselves contain errors (Milnthorpe and Soloviev,
2011). Although investigations have been carried out
into quality control, (Huminiecki et al., 2003), they
did not identify libraries in one database from their
expression data. Therefore we devised a quality
control method based on tissue-specific expression,
which had not previously been used for quality
control. We used our method to characterise libraries
whose identity is unknown and for cancer staging
(Milnthorpe and Soloviev, 2012).
The often preferred "tissue specific" genes might
not always be useful e.g. for confirming tissue
identity, if they are expressed at low levels and
would therefore be absent in many smaller libraries.
A greater sequencing depth (the number of ESTs
included in the library) would provide a better
quantitative estimate of gene expression (Simon et
al, 2009) because rare transcripts are more likely to
be included (Bashir et al., 2010), making the library
more representative of gene expression in the
original sample. Therefore, the usefulness of the so
called "tissue specific" genes will depend on
sequencing depth. It is for this reason that the effect
of library size on gene expression results has been
previously studied and/or taken into account in
statistical tests, which have been applied to a range
of different types of cancer (Abba et al., 2004);
(Baggerly et al., 2003, 2004) to name just a few.
However, the effect of library size on inter-library
correlations has not been previously studied, despite
it being known that this parameter impacts the
reliability of the results (Schaaf et al., 2008).
2 A NEW APPROACH TO THE
QUALITY CONTROL OF
EXPRESSION DATA
Tissue phenotype depends on gene expression as
278
Milnthorpe A. and Soloviev M..
Optimisation and Validation of a Minimum Data Set for the Identification and Quality Control of EST Expression Libraries.
DOI: 10.5220/0004194202780281
In Proceedings of the International Conference on Bioinformatics Models, Methods and Algorithms (BIOINFORMATICS-2013), pages 278-281
ISBN: 978-989-8565-35-8
Copyright
c
2013 SCITEPRESS (Science and Technology Publications, Lda.)

well as environmental factors. Therefore a subset of
genes is likely to have similar or nearly identical
pattern of gene expression if probed under similar
conditions. Thus, when global gene expression data
in the form of EST expression levels is compared
between similarly prepared EST libraries (e.g. non-
normalised preparations) from the identical tissues,
the Pearson correlation between such libraries is
likely to be close to "+1", for many genes.
Previously, some ~1,500 transcripts were
identified as tissue specific from investigations using
CGAP’s cDNA DGED (Milnthorpe and Soloviev,
2012). This was optimised further by summing
together all the libraries in each tissue to make a
super-library. All possible Pearson correlations were
calculated between all super-libraries (equation 1).
,
∑
∑
∑
∑
(1)
Where x and y are the total EST counts for the
transcript concerned in super-libraries X and Y, m
and n are the mean EST counts across all transcripts
in super-libraries X and Y, and Correl(X,Y) is the
calculated Pearson Correlation Coefficient between
the two super-libraries X and Y.
Higher correlation value means higher inter-
tissue correlation and is undesirable; ideally all
correlations should be equal to "0". Hence sum of
squares values were calculated from the correlations.
1
(2)
Where Correl is the calculated Pearson Correlation
coefficient between two super-libraries and S is the
sum of squares value for the correlations between all
possible pairs of super-libraries.
To optimise the initial selection and decrease the
overall inter-tissue correlations individual genes
were then removed from the super-libraries and the
sum of squares values were recalculated. The gene
whose removal resulted in the lowest overall inter-
tissue correlations was permanently removed and the
iteration steps were repeated again. The decrease in
inter-tissue correlations slowed shortly before the
1,000th gene was removed. The remainder included
high-quality tissue-specific markers and were
retained. These were optimised further to improve
intra-tissue correlation between libraries from the
same tissue using the original libraries (data not
shown). This produced an EST expression matrix
containing 244 genes. We have earlier reported a
few applications of the matrix for elucidation of
tissue identity (Milnthorpe and Soloviev, 2012).
In order to investigate the robustness of our
quality control approach based on the developed
matrix, here we used modelled data to simulate
small expression datasets. These were generated
from the expression data, by proportionally reducing
the reported EST counts and rounding any fractional
values to the nearest whole count each time. This
continued until each library ceased to present any
ESTs mapping onto the 244 marker transcripts or
ceased to be identified as a positive match for the
tissue from which it was created. Using this
approach we scaled down expression datasets and
compared all of the model libraries with the original
libraries by calculating the correlation values for the
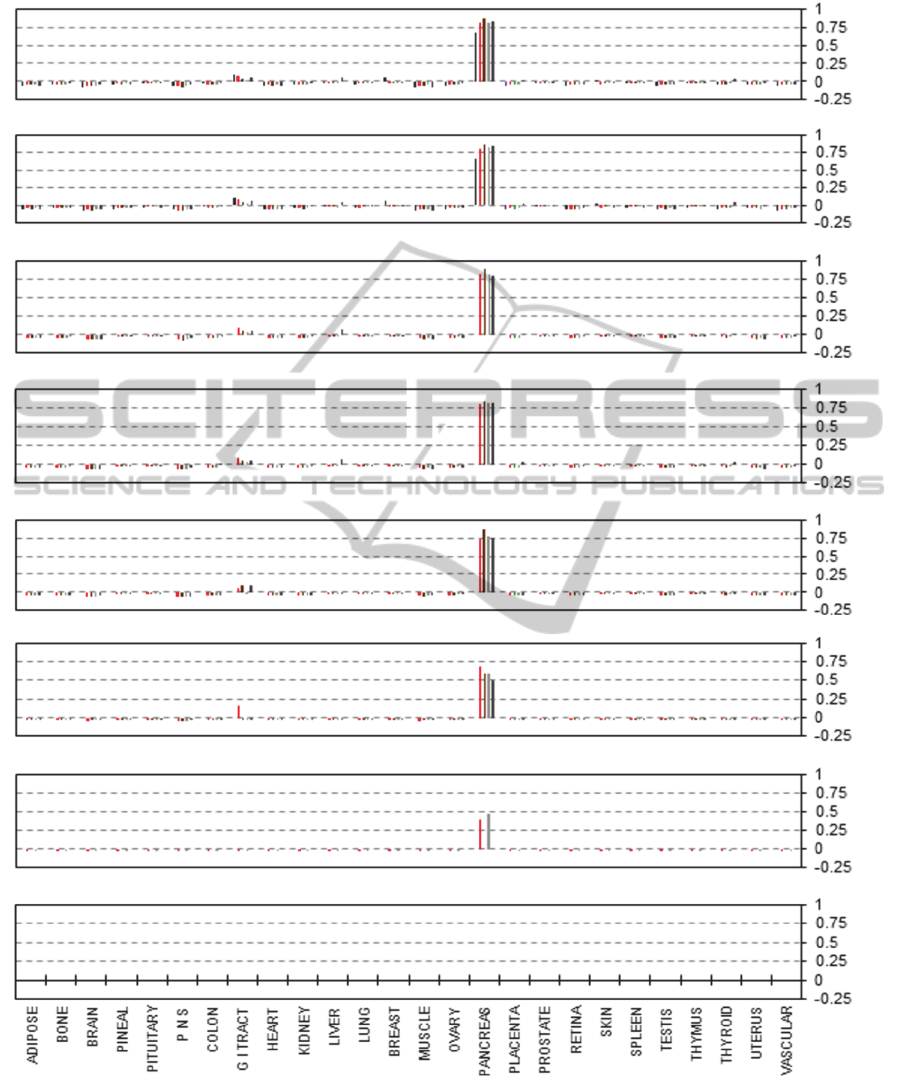
genes in our matrix. Virtually every library
continues to correlate well with the tissue of origin
until the very last EST mapping onto one of the
transcripts is removed (a typical outcome is shown
in Figure 1 for pancreas). Furthermore, the majority
of the scaled down libraries remain identifiable until
total EST counts fall below 10 – 50 which is equal to
some of the smallest libraries in CGAP’s database.
Our results for pancreas are summarised in Table
1 which details results for each of the original
libraries used and model data sets. The initial and
final numbers of total ESTs are shown and the
correlation values are indicated for each pair.
Remarkably, the final counts across all transcripts in
each library which still yield positive intra-tissue
correlation are below 100 ESTs for all but 3 libraries
tested and are below 10 ESTs for 15 out of 33
libraries tested. The tissue typing quality does not
change dramatically. These findings show that the
EST expression matrix can be used to confirm the
identity of virtually any library including small
libraries, making it a very robust method for the
quality control of expression libraries. Similar
results were obtained for all other tissues tested so
far: lung, placenta, retina and testis, data not shown.
3 DISCUSSION
We created an EST expression matrix based on
carefully selected marker genes and demonstrated its
potential for quality control of EST data and
elucidation of the tissue identity of uncharacterised
libraries and cancer staging. The model libraries
described here were analysed using the matrix. The
findings presented in Figure 1 and Table 1 and the
results for the other tissues show that the EST matrix
can be used to identify the tissue of origin for
libraries containing as few as 2 ESTs. These findings
show that tissue-specific gene expression can be
used as a quality control method, which substantially
OptimisationandValidationofaMinimumDataSetfortheIdentificationandQualityControlofESTExpressionLibraries
279
A
B
C
D
E
F
G
H
Figure 1: Correlation of the EST matrix with individual libraries of gradually reduced size from pancreas. Pearson product-
moment coefficients (vertical axes) calculated for each individual EST library and the EST expression matrix. A: original
libraries (from left to right: Human Pancreas, Barstead pancreas HPLRB1, NCI_CGAP_Pan3, NIH_MGC_78, Pancreatic
Islet) Modelled libraries produced by scaling down to 50% of their original size (B), 20% (C), 10% (D), 5% (E), 2% (F),
1% (G) and 0.5% (H). The original sizes for each of the libraries used are listed in Table 2.
BIOINFORMATICS2013-InternationalConferenceonBioinformaticsModels,MethodsandAlgorithms
280

Table 1: Library sizes and correlations for EST libraries from pancreas.
Library Name
Original library, the
number of mapped
1
ESTs
Positive correlation with
the tissue of origin using
EST expression matrices
2
Modelled scaled down
library, the number of
remaining ESTs
3
Positive correlation with the
tissue of origin for the modelled
scaled down library using the
same matrices
4
Human Pancreas 249 0.67 231 0.67
Barstead pancreas
HPLRB1
709 0.81 4 0.39
NCI_CGAP_Pan3 356 0.86 4 0.60
NIH_MGC_78 557 0.82 2 0.46
Pancreatic Islet 1,789 0.83 4 0.50
1
Mapped ESTs are the ESTs in each library which map onto transcripts.
2
Using the matrices and as described in “A new approach to the quality control of expression data”.
3
Each individual library was scaled down to model a smaller EST library and any fractional EST counts were rounded to the nearest
whole number. The reduced modelled EST counts below "0.5" were rounded down to "0".
4
Gradual disappearance of rare transcripts resulted in the progressive lowering of the positive correlation with the tissue of origin. Each
library was scaled down until positive correlation was lost.
improves upon earlier investigations (Milnthorpe
and Soloviev, 2012).
Small libraries have a lower sequencing depth
and may not provide as good a quantitative estimate
of gene expression than larger libraries (Simon et al,
2009) due to the reduced likelihood of rare
transcripts being included (Bashir et al., 2010). The
effect of library size has been used previously in
statistical tests to study gene expression levels in
cancer (Abba et al., 2004); (Baggerly et al., 2003;
2004) to name just a few. However, here its effect
on inter-library correlations was studied. Although
the correlation was reduced, an extremely good
match was presented, confirming the matrix as an
extremely robust method of quality control.
4 CONCLUSIONS
An EST expression matrix has been optimised and
tested here on EST libraries of a range of sizes. We
showed that the tissue type annotations of EST
libraries could be verified by using a small
expression matrix. Furthermore, the robustness of
the new method was confirmed by using it to
identity libraries which contain only a few ESTs.
REFERENCES
Abba, M. C., Drake, J. A., Hawkins, K. A., Hu, Y., Sun,
H., Notcovich, C., Gaddis, S., Sahin, A., Baggerly, K.,
Aldaz, C. M., 2004. Transcriptomic changes in human
breast cancer progression as determined by serial
analysis of gene expression. Breast Cancer Research.
6 (5) pp. R499 – R513.
Baggerly, K. A., Deng, L., Morris, J. S., Aldaz, C. M.,
2003. Differential expression in SAGE: accounting for
normal between-library variation. Bioinformatics 19
(12) pp. 1,477 – 1,483.
Baggerly, K. A., Deng, L., Morris, J. S., Aldaz, C. M.,
2004. Overdispersed logistic regression for SAGE:
modelling multiple groups and covariates BMC.
Bioinformatics 5 (144).
Bashir, A., Bansal, V., Bafna, V. 2010. Designing deep
sequencing experiments: detecting structural variation
and estimating transcript abundance BMC. Genomics.
11 (385).
Huminiecki, L., Lloyd, A. T., Wolfe, K. H., 2003.
Congruence of tissue expression profiles from Gene
Expression Atlas, SAGEmap and TissueInfo databases
BMC. Genomics 4 (31).
Milnthorpe, A.T., Soloviev, M., 2011. Errors in CGAP
xProfiler and cDNA DGED: the importance of library
parsing and gene selection algorithms BMC.
Bioinformatics 12 (97).
Milnthorpe, A. T., Soloviev, M., 2012. The use of EST
expression matrixes for the quality control of gene
expression data PLoS. One 7 (3) e32966.
Schaaf, G. J., van Ruissen, F., van Kampen, A., Kool, M.,
Ruijter, J. M. 2008. Statistical comparison of two or
more SAGE libraries: one tag at a time Methods. In
Molecular Biology 387 pp. 151 – 168.
Simon, S. A., Zhai, J., Nandety, R. S., McCormick, K. P.,
Zeng, J., Mejia, D., Meyers, B. C., 2009. Short-read
sequencing technologies for transcriptional analyses.
Annual Review of Plant Biology 60 pp. 305 – 333.
OptimisationandValidationofaMinimumDataSetfortheIdentificationandQualityControlofESTExpressionLibraries
281
