
WebComets: A Tab-Oriented Approach
for Browser History Visualization
Daniel Cernea
1,2
, Igor Truderung
1
, Andreas Kerren
2
and Achim Ebert
1
1
Computer Graphics and HCI Group, University of Kaiserslautern, P.O. Box 3049, D-67653 Kaiserslautern, Germany
2
Computer Science Department, ISOVIS Group, Linnaeus University, Vejdes Plats 7, SE-35195 Växjö, Sweden
Keywords: Browser History Visualization, Glyph-based Techniques, Visual Knowledge Discovery, Time Series,
Parallel Browsing.
Abstract: Web browsers are our main gateways to the Internet. With their help we read articles, we learn, we listen to
music, we share our thoughts and feelings, we write e-mails, or we chat. Current Web browser histories
have mostly no visualization capabilities as well as limited options to filter patterns and information.
Furthermore, such histories disregard the existence of parallel navigation in multiple browser windows and
tabs. But a good understanding of parallel browsing behavior is of critical importance for the casual user
and the behavioural analyst, while at the same time having implications in the design of search engines,
Web sites and Web browsers. In this paper we present WebComets, an interactive visualization for extended
browser histories. Our visualization employs browser histories that capture—among others—the tab-
oriented, parallel nature of Web page navigation. Results presented in this paper suggest that WebComets
better supports the analysis and comparison of parallel browsing and corresponding behavior patterns than
common browser histories.
1 INTRODUCTION
Since the release of the World Wide Web to the
public, the Internet instantly became an important
source of information as well as a communication
platform without which today’s world is hard to
imagine. The number of registered domains
increased in the last decade from 35 to
approximately 350 million, and the trend is
accelerating rapidly.
While different approaches have been developed
to navigate this mass of information, almost all of
them are still based on the well-known Web
browser. Through the browser, users search for a
particular piece of text or information, they work on
or through the Internet, they stream entertainment
media or communicate (Kleek et al., 2010). As a
result, the logging features of our browsers—called
Web browser histories—have the ability to reflect
our requirements, interests and activity. Therefore, it
seems that an efficient examination of our browser
histories offers the opportunity of retrospectively
inspecting users’ behavior on the Web.
But in recent years, the paradigm of Web
navigation has shifted and many browsers started
implementing “tabs” to support parallel browsing.
Tabs allow users to access and explore multiple Web
pages simultaneously. While similar, this experience
is still significantly different from the one of using
multiple browser windows, as the more lightweight
tabs allow users to have an overview of the opened
Web pages and even organize (e.g., group) the
various tabs by the topic of the loaded page. The
importance of tab-based operations can be further
supported by the work of Miyata et al. (Miyata and
Norman, 1986), where the presence of foreground
and background tasks and their interconnection in
the human mind is emphasized from the perspective
of cognitive psychology. As such, Web browser tabs
are specifically designed to follow this principle and
allow users to distribute their attention based on this
model.
As a matter of fact, a recent paper (Huang and
White, 2010) highlights that 57.4% of Internet
sessions in the browser make use of tab-based
parallel navigation. Other findings comprise that
these values fluctuate between 4-85% (Viermetz et
al., 2006). While not conclusive, such a wide range
suggests an even more important aspect: there is
currently only limited information and insight into
439
Cernea D., Truderung I., Kerren A. and Ebert A..
WebComets: A Tab-Oriented Approach for Browser History Visualization.
DOI: 10.5220/0004226004390450
In Proceedings of the International Conference on Computer Graphics Theory and Applications and International Conference on Information
Visualization Theory and Applications (IVAPP-2013), pages 439-450
ISBN: 978-989-8565-46-4
Copyright
c
2013 SCITEPRESS (Science and Technology Publications, Lda.)

the way users explore and organize their parallel
browsing experiences, and a visualization tool would
be needed that is capable of capturing and reflecting
the intricacies of online navigation today. Such a
powerful representation enabled by meta-
information about user online sessions, has the
potential to simplify the tasks of researchers in fields
like information retrieval and behavioral sciences, as
well as offer an alternative to the casual user who
wants to explore his online multitasking and
browsing habits.
Sadly, in most cases the representation of the
history data is limited to a textual list of Web site
names and URLs that is sorted based on a certain
criterion, e.g., chronological or by load frequency.
Additionally, these browser histories give little
insight in the call hierarchy of the Web pages or the
relevance of a particular site to the users. In other
words, while browsers offer support for parallel
browsing, most current histories fail to capture this
aspect (Huang and White, 2010) and thus do not
reveal any interconnection patterns between the Web
pages or user sessions. Thus, as temporal features
are not sufficiently highlighted in conventional
histories, one cannot recognize the connections
between Web sites and browser windows and tabs.
This information is relevant in a setting where users
now engage in parallel navigation and distributed
attention between many open browser tabs and
windows.
In this paper, we address the problem of
designing an interactive visualization tool for
Internet browser histories that supports intuitive
search operations based on content and context
information, and that allows the tool user to more
quickly find, compare and analyze parallel
navigation behavior based on a set of existing—e.g.,
those described in (Huang and White, 2010)—and
novel metrics. The remainder of the paper is
organized as follows. First, we focus on research
that is relevant to the topic at hand and continue with
a requirement analysis. This is followed by a
detailed discussion of the data gathering process
together with the design decisions and the featured
interactions of our proposed visualization. In order
to validate our approach, we then describe an
evaluation of our tool. Finally, we conclude and
provide future research directions.
2 RELATED RESEARCH
Maybe the most common approach for visually
encoding browsing histories are tree representations.
Tools like MosaicG (Eric et al., 1995), PadPrints
(Hightower et al., 1998), Organic Bookmark
Management (Shen et al., 2011), WebMap (Doemel,
1994) and Domain Tree Browser (Gandhi et al.,
2000) use one or multiple vertical or horizontal 2D
trees to represent the domain-structure of the
navigated Web sites. In some cases, these tree views
are coupled with additional list views that highlight
the temporal order of visitation, as the tree
representations do not reflect the temporal
succession of events. Additionally, in many cases
screenshots of the Web pages are used as thumbnails
embedded in the nodes to support the recognition
process (Eric et al., 1995); (Hightower et al., 1998);
(Shen et al., 2011). Still, all these approaches
represent a Web page only once in the tree, even if it
is visited multiple times.
An alternative 2D graph representation focuses
on capturing and visualizing the branching events in
the navigation path (Waterson et al., 2002). These
visualizations manage to capture the sequential
aspect of the browsing process, as each accessed
page is drawn as an additional node in the graph. If
the user navigates back and accesses a different Web
site, the resulting branch will be accordingly
represented in the visualization.
A slightly different 2D space-filling solution is
offered by the Trails plug-in (Yu and Ingalls 2011)
that supports a hierarchical, chronological and
group-based representation of the visited pages.
Furthermore, it offers a statistical overview of the
most often visited Web sites. Another method for
representing browser histories is highlighted by
solutions that employ one (Kaasten and Greenberg,
2000) or multiple (Cockburn et al., 2003)
interconnected linear views that are enhanced by
graphical elements (e.g., thumbnails).
Besides 1D and 2D solutions, Web browser
histories have been developed that employ multiple
dimensions or intuitive metaphors. VISVIP (Cugini
and Scholtz, 1999) is a 3D representation of a
navigation log, where two dimensions are used for
drawing the Web site structure, while the additional
third one encodes the temporal information. On the
other hand, the combo WebBook and WebForager
(Card and Robertson, 1996) use the concept of a
book to give an overview of the Web sites as well as
offer an intuitive information-space for the user.
A special class of browser histories is
represented by the statistical summary histories.
Tools like SlifeWeb (Slife Labs, 2012), RescueTime
(Rescuetime, 2012) or Eyebrowse (Kleek et al.,
2010) are mainly focused on time management and
analytics, and allow users to generate their own
IVAPP2013-InternationalConferenceonInformationVisualizationTheoryandApplications
440

statistic view about how they—or others—navigate
the Internet.
However, browser histories are not the only type
of data revolving around complex, interconnected
temporal events. Other time-series visualizations
employing similar visual concepts to our approach
include World Lines (Waser et al., 2010), a
visualization technique for exploring the alternative
paths of heterogeneous simulation runs, and
LeadLine (Dou et al., 2012), a visual analytics tool
for identifying and representing meaningful events
in news and social media data.
While diverse and functional, none of these
methods focuses on the complex parallel browsing
habits of today, where tabs and windows have
become means for the user of organizing his
thoughts, actions and accessed information (Huang
and White, 2010). The importance of a tool for
visualizing, analyzing and comparing parallel
browser behavior is further highlighted in (Aula et
al., 2005), because users tend to use multiple
windows and tabs as means for backtracking (e.g.,
users abandon the use of in-browser back operations
in favor of opening new tabs and switching between
them) and multitasking (e.g., users interact with one
tab while Web pages are being loaded and processed
in others). Similarly, findings from (Spink et al.,
2006); (Weinreich et al., 2006) suggest that users
often employ parallel browsing in Web search tasks
for reasons like comparing search results, executing
multiple queries, interacting with a page while
others are being loaded, etc.
3 REQUIREMENT ANALYSIS
To support flexible search and analysis efforts, all
control and interaction elements that users employ to
organize complex and parallel browsing sessions—
such as windows–tabs and back–forward operations
—need to be recorded and graphically represented in
a first step (cp. Subsection 4.1). The captured data
organized into a set of different user profiles will be
at the core of the later visualization. It has to embed
rich meta-information that could be of interest for
the user of WebComets, i.e., for researchers in
information retrieval, behavioral sciences and
related fields (called tool user or analyst in this
paper). Following the study described in (Huang and
White, 2010), typical research questions for a better
understanding of parallel browsing behavior on the
Web are for example: When and to what extent are
users parallel browsing on the Web? Or what affects
parallel browsing behavior during interaction with
Web search results?
Another possible research question is to identify
reasons why users revisit pages—for example,
because of monitoring pages (Kellar et al., 2007);
(Adar et al., 2008) — and how this is typically done
in a multi-tab browser environment. For supporting
such studies and for finding answers for such
questions, a visualization tool has to offer specific
functionalities. We have composed a list of
requirements that need to be satisfied by a browser
history visualization based on preliminary studies,
user feedback about browser histories and their
limitations, and information about the nature of
parallel browsing behavior from the previously
referenced publications. Fundamental requirements
for the visualization of the captured data are:
• The visualization should offer an overview of the
loaded data and support detailed investigations. This
can be achieved by means of tailored interactions
and methods like “detail-on-demand”.
• The temporal flow of the visualized navigation
sessions needs to be clearly distinguishable. While
most Web browsers only display a chronologically
sorted list of the accessed Web pages, it is important
that the temporal dependencies are visually and
relationally highlighted.
• For each visited Web page, additional meta-data
needs to be captured like the duration of each visit or
the duration of interacting with the Web page. While
many solutions already count the number of
executed accesses to each Web page, it is important
to visualize the temporal sequence of events related
to any sequence of navigated pages because
documents may be inspected more often and for
longer periods.
• Web site categories, like search engines or news
Web sites, should be introduced and represented.
Current browsers support bookmarking of Web
pages, which implies saving the Web page’s address
while at the same time tagging it with the help of
keywords or categories. These operations increase
the retrievability of stored bookmarks and should
also be offered by our system.
• The visualization should clearly represent which
navigation path—or sequence of visited Web
pages—the users have followed during their
browsing session. This includes information about
what browser windows and tabs have been opened
and closed, and how these are connected to
particular accessed documents. Thus, it will be
possible to reconstruct the steps that lead to the
opening of a particular Web page—a missing feature
in many related works.
WebComets:ATab-OrientedApproachforBrowserHistoryVisualization
441
Requirements that improve scalability (with
respect to log size and number of user profiles) and
analysis possibilities:
• Visualizing multiple browsing histories at the same
time should be supported in order to allow
comparison and analysis operations (e.g., detect if
multiple users have similar interests or if users have
communicated in a certain time period). This feature
is mostly not supported so far.
• Connections between similar Web sites should be
emphasized as these might be relevant alternatives in
search and analysis tasks.
• Our tool users should be able to search for
particular Web pages based on content (e.g., title or
category) and context information (e.g., approximate
duration of access or pages accessed prior to the one
in question). While content-based search is present
in all history lists, a search for the context is not
supported in most cases, as this requires additional
information about the navigation paths the user
followed.
• Equally important for the analysis of parallel
browsing behavior is the search for navigation
patterns, i.e., finding specific structures (motifs) in
the navigation graph which results from branching
out from a linear navigation behavior by using tabs
or additional browser windows.
4 WebComets
WebComets is a system for the interactive
visualization of extended, tab-based browser
histories. It was implemented in Adobe Flash
ActionScript, with both online and standalone
capabilities. The representation and interaction
metaphors it incorporates satisfy the requirements
highlighted in the previous section. Figure 1 shows a
screenshot detail of our tool. To achieve the required
functionality and analysis capabilities, WebComets
cannot solely rely on information gathered by
standard logging systems. Thus, we propose an
extended logging mechanism as described in the
next subsection.
4.1 Extended Browser History
Some of the previously highlighted requirements
cannot be achieved with the history features of
major Web browsers. For example, browsers like
Mozilla Firefox or Internet Explorer do not record
the duration for which a user has actively interacted
with a Web page. More importantly, browsers do not
focus on capturing the parent-child relationships
between accessed Web pages and even less the
connections between opened tabs or windows. Other
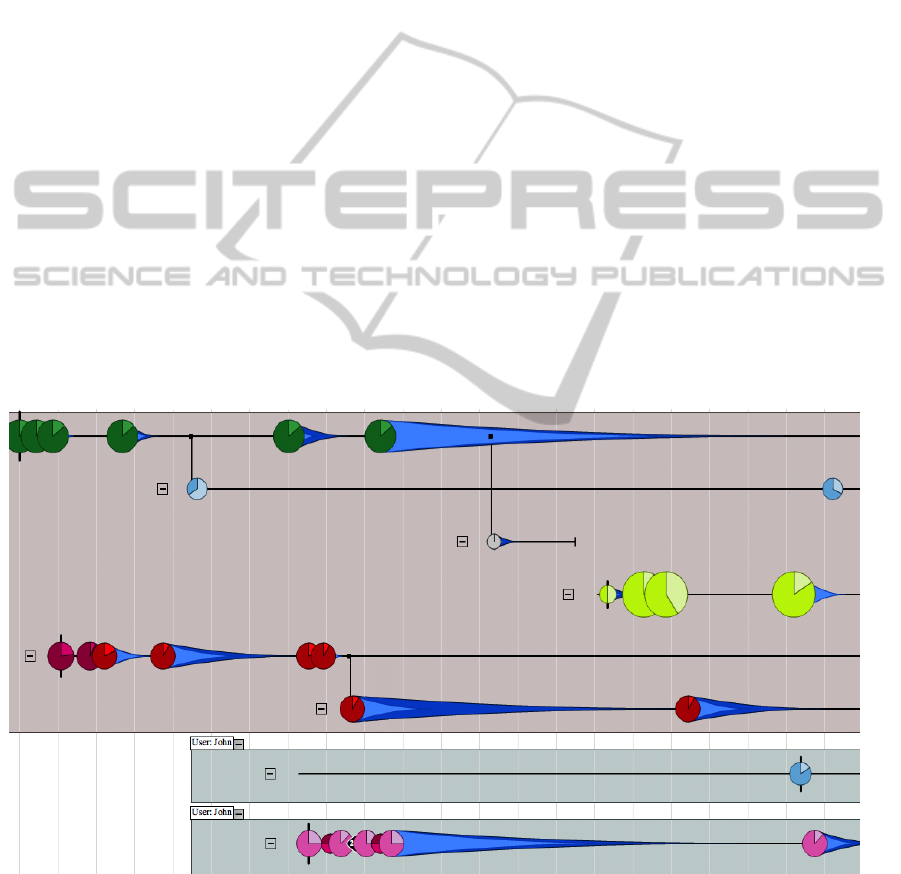
Figure 1: WebComets visualization of the parallel browsing histories of two users (light-brown and light-grey background).
Each horizontal line represents the timeline of a tab that the user has opened, while vertical branches highlight new tabs that
have been created by clicking a hyperlink in the parent tab. The comet glyphs encode loaded Web sites and their color
coding represents topics. Their position on the time axis depends on the moment when they were accessed. In the current
visualization, one can notice that the first user had up to six tabs open within the shown time. The second user employed
two browser windows without additional tabs and spent most of his/her time on one Web page as represented by the long
comet tail in the second window.
IVAPP2013-InternationalConferenceonInformationVisualizationTheoryandApplications
442
researchers have also encountered this difficulty
when investigating the parallel browsing behavior of
Internet users (Huang and White, 2010). The
unavailable information included, among others,
missing source tabs for branching operations and no
information on how a tab or window was created
(new tab, hyperlink click).
To address this, we developed a Mozilla Firefox
browser add-on with the help of Javascript and
libraries like jQuery and Kinetic. The add-on
incorporates the ability of recording and saving an
Extended Browser History (EBH) inside an SQLite
database. The information collected like this can be
subsequently accessed and visualized for multiple
browsing sessions and users.
For any current user profile, the extension saves
the navigated URLs together with relevant
additional information. The complete EBH includes
a subset of the metrics employed in (Huang and
White, 2010) and a set of additional metrics relevant
to the analysis and comparison of parallel browsing
habits and behavior. Thus, for each user profile, the
EBH records the following information:
• user profile information (such as username),
• opening and closing times for each tab and window
(tab and window sessions), as well as
• type of creation for each tab and window, i.e.,
opened blank or through a link from another tab /
window (branching).
To complement this, the following data will be
recorded for every accessed Web page:
• The title of the Web page including its URL.
• Information about how a Web page was opened:
through direct input of the URL in the address bar
by the user, through clicking of a link in another
Web page, or through the browser’s integrated
back/forward operations.
• Category of the Web page based on a static list of
Web domains.
• Number of accesses to a domain and a particular
URL (pageview).
• Additional time intervals: total time – the time
interval when a Web page was loaded and discarded;
focus time—the time interval for which a Web page
was in the foreground; active time—the time interval
for which the user interacted with a Web page.
Note that the tab switches metric proposed by
Huang et al. is currently not being stored in the
EBH, as we argue that additional time intervals offer
an alternative view for the distribution of the user’s
attention over multiple tabs and windows. In the
following, we highlight the visual design and
interaction capabilities of WebComets together with
supplementary information about the EBH.
4.2 Design
In order to satisfy the requirements highlighted in
Section 3, the WebComets visualization has to
consider a variety of aspects. Probably most
important is the representation of the temporal
dimension and the mapping of the Web pages to a
time axis. In order to use the larger width to height
ratio of modern screens (widescreen), a visualization
concept was devised that maps the timeline to the
horizontal axis, from left to right. In this
representation, each accessed Web page is displayed
as a circle and gets assigned its corresponding
position on the timeline (x-axis).
The encoding of the parallel navigation that the
users are involved in by using multiple browser
windows and tabs is another important aspect of the
visualization. WebComets represents each browser
tab as a separate horizontal line segment that is
parallel to the time axis (Figure 2). This combination
of patches and parallel segments is similar to the
representation of a parallel browsing session in
(Huang and White, 2010), as well as to (Krstajic et
al., 2011) where multiple time-series are visualized
through a comparable solution.
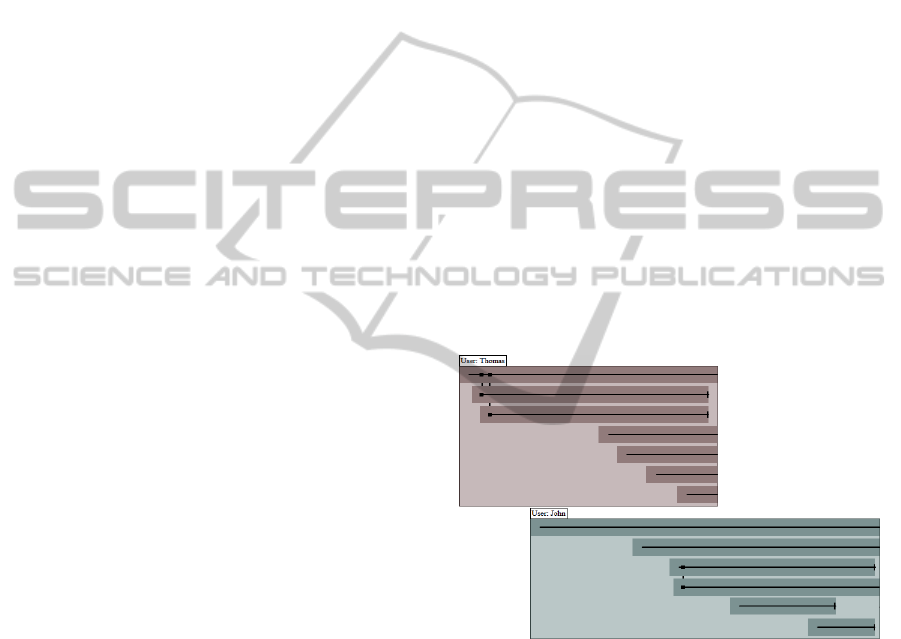
Figure 2: Rectangular representation of two browser
windows and their corresponding tabs. The different
background colors for the rectangles suggests that the
browser windows were created by two user profiles.
As tabs can be opened manually or by clicking a
link in another tab, this can result in a tree-like
structure that also suggests connections in terms of
hyperlinks, but possibly also themes between
various Web sites. This parent-child relationship is
represented in the visualization as two horizontal
lines connected by a vertical one. At the same time,
if the user opens a tab manually, there is no clear
way of connecting the first Web page of this tab to
any other already open pages. Therefore, a new tab
line is shown as disconnected from the rest of the
WebComets:ATab-OrientedApproachforBrowserHistoryVisualization
443
tabs that were already loaded (Figure 2).
At the same time, multiple opened browser
windows are visually encoded as framed rectangular
areas, where each rectangle contains a tree-like
structure of tabs that reflects the opened tabs in each
window during the user session, see Figure 2. As the
rectangles stretch along the horizontal axis, its left
and right margins represent the opening and closing
times of the window. Note that a rectangular
representation can be also activated at the tab-level
to enforce the navigation patterns of the users. All
rectangular shapes have a specific background color
that identifies them as windows/tabs belonging to a
certain user profile.
4.2.1 Visual Encoding
The representation of the visited Web pages has at
its core a glyph enriched with graphical elements
encoding multiple EBH attributes, as shown in
Figure 3. These circular glyphs are mapped on the
horizontal axis to the moment in time when the
corresponding Web page was loaded, while the
vertical positioning identifies the tab in that the Web
page was accessed.
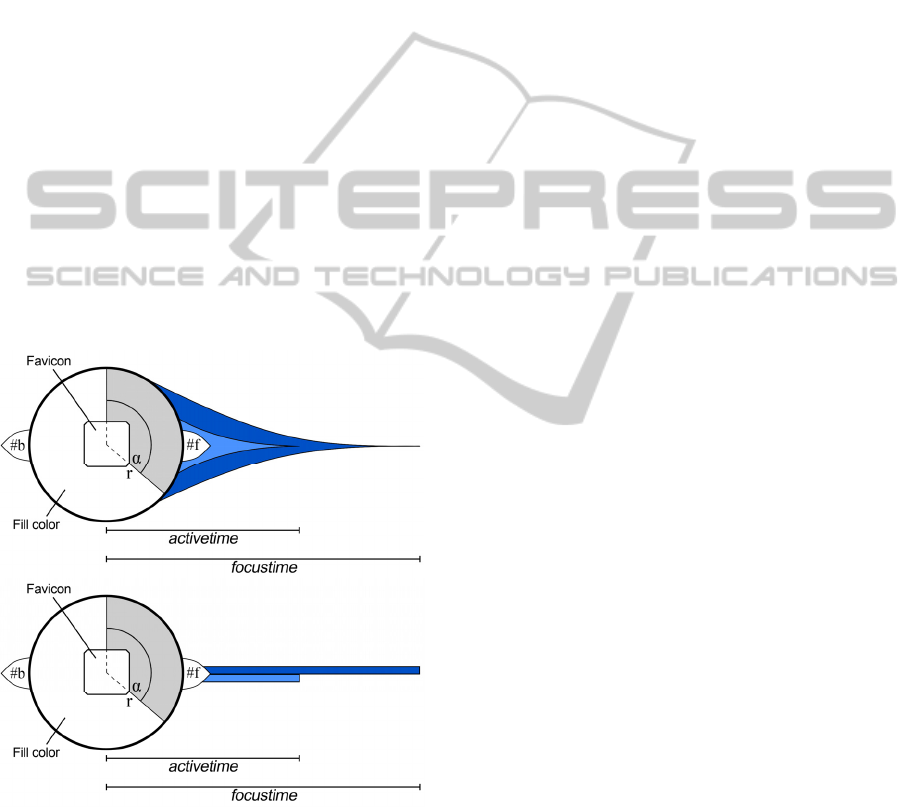
Figure 3: Circular glyph representation of a visited Web
page. The figure highlights two versions of representing
the focus and active times of the visited Web pages: as a
comet tail (top) or as beams (bottom). Active time is
represented in light-blue, whereas focus time is in dark-
blue.
In a browser history, there are two major elements
that suggest the importance of a Web page to the
user: the number of visits (pageviews) and the time
the user has spent actually interacting with the page
or leaving it active. As such, we encoded these two
metrics with visual attributes that would reflect their
importance through size and shape, according to the
separability of dimensions (Ware, 2004). The radius
of each circular representation encodes the number
of visits the user executed in the current session to a
particular domain, e.g., “www.google.com”. As a
result, pages that are part of domains visited more
often will have a larger circular glyph than those that
have domains visited rarely.
Tool users have the option to activate a pie chart
representation for all glyphs, that captures the ratio
of visit counts for the current Web page compared to
the overall visit count for the domain. For example,
if the domain “google.com” has been accessed six
times in total and the current Web page
(“www.google.com/search?q=conference”) only two
times, then the pie chart will encode a sector of 1/3.
This type of information can supply vital insights to
the analysts, as in many browsing instances multiple
pages of a certain domain are accessed, but only
some are accessed more often or for a longer period
of time.
As mentioned in Subsection 4.1, EBH includes
three time intervals for every Web page: total, focus
and active time. Remember that focus time stores the
amount of time the Web page was in the foreground
and active time captures the duration for which the
user was clearly present and interacting with the
Web page, e.g., by mouse movements or key
strokes. Therefore, the following relationship is
valid for any visited page:
total_time ≥ focus_time ≥ active_time
(1)
As the horizontal axis is mapped to temporal
features, it is thus intuitive to encode the total time
for a Web page as being represented by the
horizontal segment between its glyph representation
and the position of the glyph for the following Web
page on the same tab. Additionally, the focus and
active times are visualized as subsegments of this
total time. This is achieved by two alternative
representations (cf. Figure 3): the first one has the
shape of a comet tail, and the resulting glyph
metaphor is meant to suggest the direction of the
temporal flow; the second one is a beam-based
representation that is more compact, and thus used
on collapsed branches and space-saving
representations (see Section 4.3). Both intervals
have their origin at the loading time of the current
Web page, and their length is proportional to the
total time the user spent on the page.
IVAPP2013-InternationalConferenceonInformationVisualizationTheoryandApplications
444

4.2.2 Web Site Categories and Browsing
Issues
For both encodings, the glyphs are colored based on
a correspondence to Web site categories. The
categories support the quick differentiation and
detection of various activities that the browser users
were involved in. They have been generated based
on (Gross, 2004); (Katz and Aspden 1997), where
common in-browser activities are highlighted. For
each visited link, a category is selected by the
Firefox extension based on the domain of the current
Web site. The process is static and employs a
database of domains that is divided into 15
categories. The lists of relevant domain names for
each category have been generated with the help of
the Alexa Top 500 Web sites database (Alexa,
2012). If a domain is not found in the database, the
Web page will be included in the “unknown”
section. In order to make the different categories as
distinguishable as possible, the color selection is
based on recommendations from the Colorbrewer
Web site (Colorbrewer, 2012). Of course, the user
can inspect a legend located in the visualization
space on the left hand side. By clicking on a
category in the legend view, it is possible to select
all Web pages from that group.
A common approach for bookmarking systems in
browsers is to store not only the URL and page title,
but also the favicon of a Web page. A favicon is a
small (commonly 16x16 pixels), squared icon that
identifies the domain of the Web page and usually
appears next to the address bar of a browser when a
Web page is loaded. To improve the chances that a
Web page is quickly recognized (Kaasten and
Greenberg, 2001) in the WebComets visualization,
the users have the option to additionally display
favicons over the pie charts, if these icons are
available. Due to the small size of the icons, the
users can still distinguish the sectors of the pie chart.
The size of the favicon is proportional to the one of
the circle. For small circles, the icons are also
reduced in size. To compensate for this, users can
hover the icon with the mouse cursor in order to
represent it in its original resolution.
When navigating the Web, users have multiple
options to reach a certain URL: type it in
themselves, click on a hyperlink, execute browser-
specific operations, etc. While some operations
suggest relationships between Web pages (e.g.,
hyperlink connections), others might represent a
breakpoint in the thought process of the user. Such a
case is usually given when users type in the URL
themselves. To better highlight this, Web pages that
are loaded after a manual input of the address have a
short vertical bar sticking out from under their glyph
to suggest a possible mental breakpoint, as indicated
in Figure 1.
Also, users may access a Web page by utilizing
the back and forward navigation buttons of the Web
browser. In many modern browsers, these buttons
allow the user to navigate backward and forward one
or multiple pages. These operations are useful
especially in cases where the users feel they have
reached an informational dead end. If a Web page
was loaded through a back or forward step, this is
captured and represented in the visualization through
small arrow-shaped elements on the left or right of
the corresponding pie chart (cf. Figure 3). The
numbers #b and #f inside the arrows highlight how
many back or forward operations were executed at
once in order to reach this Web page.
As not all these glyph elements are constantly
required, our tool users have the opportunity to
enable certain features like favicons and back-
forward arrows to be only included in the glyph on
demand. This allows them to maintain an overall
reduced level of complexity for the glyphs and only
access certain information when these could be
relevant.
4.3 Interaction
Besides the already presented features of the
approach, tool users have additional possibilities to
customize and interact with WebComets. The
current configuration can be stored inside an option
window and includes — but is not limited to — the
following: switching between comet tail and beam
representations, customizing min and max values for
the pie chart radii, enabling or disabling elements
like favicons or back-forward arrows, and selecting
the EBH attributes to be displayed.
4.3.1 View Transformations
A set of interaction metaphors complement the
visualization’s abilities by addressing topics like
flexibility, scalability or detail-on-demand.
The WebComets interface supports pan and
zoom operations, similar to modern interactive
maps. While the panning operation is self-evident,
there are two zooming approaches implemented in
the tool: one is a regular 2D zoom that allows tool
users to inspect the details in a certain area, while
the other is a 1D horizontal zoom along the timeline
that stretches the horizontal axis (Figure 4).
WebComets:ATab-OrientedApproachforBrowserHistoryVisualization
445
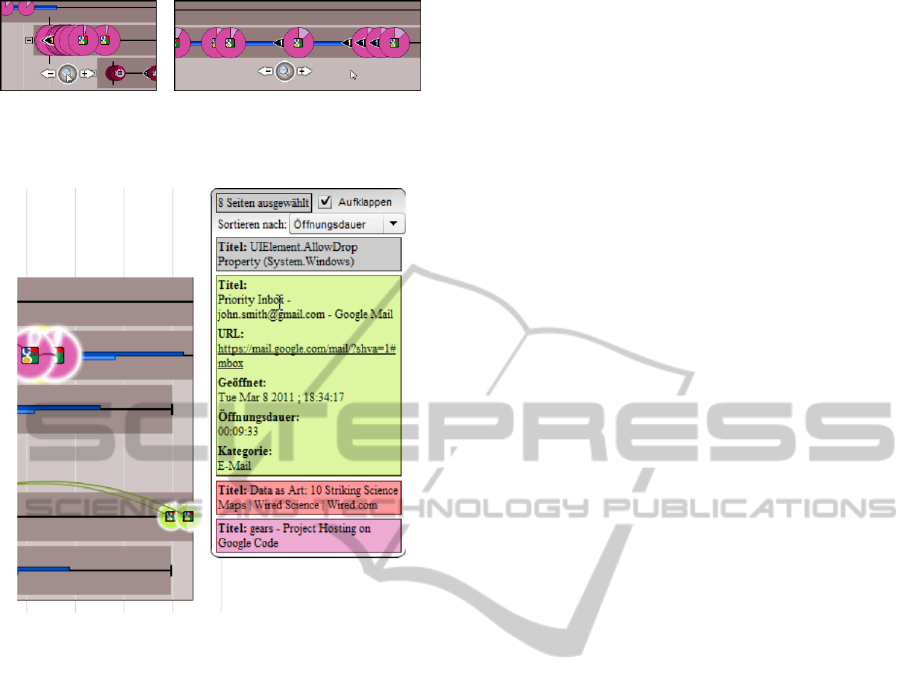
Figure 4: Temporal zoom (1D) along the horizontal time
axis: original zooming factor (left) and 30x horizontal
zoom (right).
Figure 5: Information box presenting details about the
selected Web pages. By moving the cursor over the list
elements, additional information is displayed for the
current Web page (in light-green).
It might occur that multiple glyphs are partially
or almost totally overlapping. Even if the tool user
has the possibility to execute timeline zoom
commands to compensate for this and clearly
separate the overlapping glyphs, this is a vital
scalability issue. To deal with this, WebComets
displays partially overlapping pie charts by
positioning the glyph of the Web page that has been
accessed later over the top of the previous one. To
further compensate, the tool user can move the
mouse pointer over a set of densely grouped circles.
By doing so, the glyph with the center closest to the
pointer will be moved to the foreground, over the
others. This focused glyph is additionally
complemented with graphical elements (e.g.,
favicon, if not enabled globally) and textual
information (e.g., Web page title). In cases where
the user wishes to focus his attention on the temporal
constraints and relationships, all glyphs can be
reduced to dots, minimizing the overlap of glyphs
and tails.
Furthermore, WebComets detects instances
where two or more glyphs are completely
overlapping and replaces these with the one that has
the largest radius. In order to suggest the presence of
other circles “underneath” it, the border thickness of
this circle is increased proportionally with the
number of hidden circles. Besides controlling the
depth order of the elements, moving the mouse
pointer over a glyph or its comet tail/beam opens a
tooltip that shows the title of the Web page and its
link as well as a set of page attributes customizable
by the user (e.g., title, URL, or pageviews).
Selecting a glyph can be done by mouse click, or
in order to select multiple glyphs, by pressing the
Shift-key plus mouse click. Besides this, tool users
can also use the legend to select all elements from a
category or search for certain patterns to highlight
glyphs that satisfy the search rule. Selected Web
pages are highlighted and an information box opens
in the upper-right corner of the visualization. The
information box contains the attributes of the
selected Web page, shown in Figure 5. This box can
also be customized in order to include all attributes
or a subset of them. In cases where multiple Web
pages are selected, the information box displays
initially only a list with the titles and URLs of the
selected pages. If the tool user moves the mouse
cursor over the list, the selected list element will be
expanded to present all available information of that
page. The background color of each list element
matches the category of the Web page. A click on
the link (or on the favicon if enabled) will open the
corresponding Web page in the tool user’s default
browser.
For each selected Web page, WebComets
searches the browser history to check for similar
Web pages. By default, only pages with the same
domain are considered to be similar, but more
complicated rules for interconnection can be
generated, e.g. pages containing a keyword, pages
that have an active time of similar length, etc. They
are highlighted by adding links between each
selected element and its counterpart. The curved
lines (Figure 6) are used for showing the presence of
similar Web pages to the selected ones, possibly in
areas of the visualization that are not currently
visible. Curves can be easily perceived as they
contrast with the overall orthogonal representation
of our approach. To avoid clutter, curves are drawn
in such a way that the probabilities of intersecting
curves and a curve intersecting a glyph are reduced.
More precisely, our tool computes a predefined set
of possible curves with different curvatures to
connect the two nodes and then utilizes a collision
IVAPP2013-InternationalConferenceonInformationVisualizationTheoryandApplications
446

detection algorithm to identify the curve that
intersects the least number of glyphs.
The tool user could find some parts of the
visualized history more interesting than others. Due
to this, but also in order to save screen space, he/she
has the possibility to collapse tabs or windows that
he/she is not interested in. For collapsing the
representation of a tab, the tool user has to click the
plus icon next to its spawning point; the same is
valid for windows. In cases when a tab is collapsed
that also has other tabs created by it, all the branches
of that tab will be compacted together with the
parent tab, and vice versa for expansion.
Nonetheless, if a glyph is selected and similar Web
pages were detected on any collapsed tab or
window, then the corresponding elements are still
visible by links and additionally small dots on the
tab lines, as shown in Figure 6.
Figure 6: Collapsed view: the presence of query-related
Web pages is highlighted on the collapsed tab lines by
small dots visible in the lower right part of the screenshot.
Connections between the selected pages and other glyphs
are highlighted through continuous curved lines.
Furthermore, in order to improve the scalability
of this tool and offer the analyst a better overview of
a large dataset, the collapsed view can be enabled
for all branches. In this mode, the vertical spacing is
compressed and the glyphs turn into small dots with
a colored halo, thus allowing the WebComets user to
inspect parallel browsing behavior in larger
histories.
4.3.2 Text and Motif Search
Highlighting different elements in a browser history
is closely coupled with searching for Web pages or
navigation patterns. Most Web browsers support a
text-based search of their records that limits their
ability to detect context information. This
functionality is also supported by WebComets. Tool
users can search for terms and keyword
combinations (e.g., apple+pc), strict phrases (by
using quotes, e.g., “apple pc”) or even exclude
words from their query (by using the minus sign,
e.g., apple–pc).
Besides the possibility to execute a text-based
search of the extended browser history’s
informational content, supporting the detection,
analysis and comparison process of temporal
patterns in the navigation graph requires a different
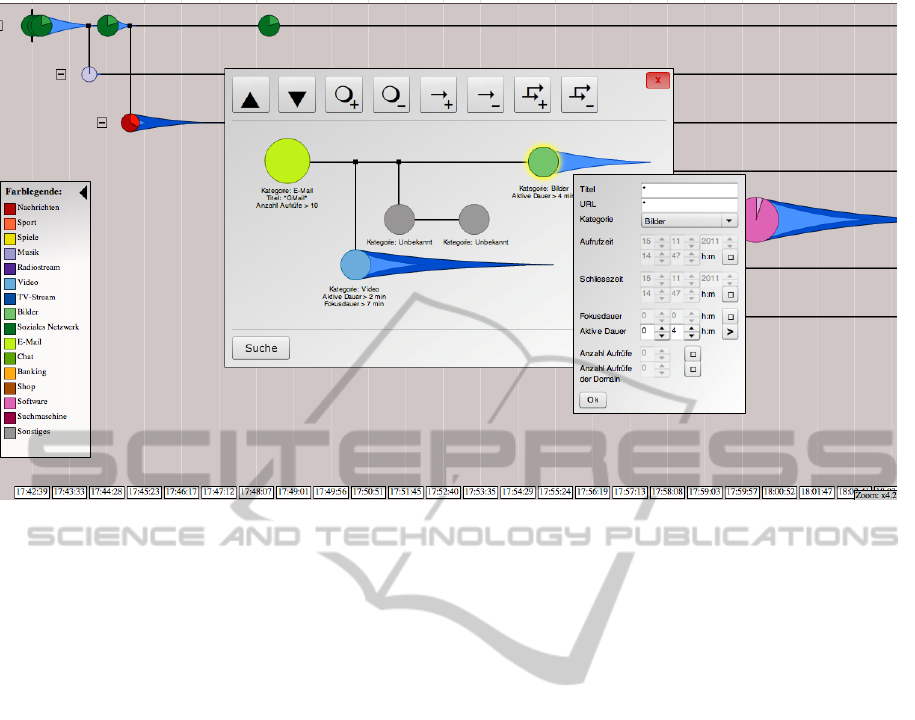
approach. Thus, WebComets offers a motif search
window (Figure 7) that allows users to define, store
and search for custom information and patterns of
navigation. Inspired by the building blocks concept
in (von Landesberger et al., 2009); (Reeder et al.,
2007), motifs in WebComets are predefined
subgraph structures that can be used to filter the
current history. Compared to other approaches, the
WebComets motif search has the advantages of
allowing logical combination of sought patterns (e.g.
find all node groups that satisfy motif A and do not
satisfy motif B), as well as the possibility to model a
large set of node and internode attributes.
These subgraphs can be generated in two ways:
either by mining substructures from the currently
opened history log files or by manually defining a
motif and its corresponding rules. In the first case,
the tool user would look through the visualized
browser histories and select any subset of glyphs
that could be at the core of a parallel browsing
behavior. When all relevant elements are selected,
the generated motif can be edited further in the motif
window to generalize or particularize the final
structural pattern. Contrary to this, in the second
approach the analyst would start generating a motif
by directly building it in the motif window, adding
node after node and customizing their attributes
based on his experience and assumptions.
As such, users analyzing an EBH can not only
look for topics of the visited pages, but also detect
navigation motifs. For example, the motif search
could detect that in 72% of the cases when an
Internet user accesses his/her e-mail account, he/she
also opens a Web page from the category “video” in
a new tab originating from his/her e-mail page. This
might suggest that he/she receives much e-mail with
links to video content. Thus, filtering the browser
history based on structural aspects can have many
applications, for example, detecting a Web page
where the tool user knows some attributes of the
originating site or investigating similar interest and
patterns of navigation between multiple users.
It is also possible to filter out numerical and
temporal values by giving exact numbers, suggesting
min or max thresholds, or defining intervals. These
rules are then incorporated in the motif and
displayed under the corresponding pages. In terms of
structure, complex motifs can be built by adding
WebComets:ATab-OrientedApproachforBrowserHistoryVisualization
447
multiple Web pages and highlighting existing
relationships between them, be it on the same
tab/window or on different navigation branches.
Once the motif specification is finished, the analyst
executes the search operation and the sum of all the
rules will be used for filtering the history. Finally,
the nodes that fit the query will be highlighted as
already described.
5 EVALUATION
A brief evaluation of the WebComets visualization
approach has been executed in order to capture any
advantages or disadvantages. The aim of the study
was to compare the performance and accuracy of
tool users when inspecting and comparing patterns
in multiple parallel browsing histories. For this
purpose, the participants would interact with the
same EBH log files by two different approaches: the
WebComets visualization and a list-based browser
history (the Firefox browser history was selected for
convenience).
The evaluation involved 20 participants with
experiences in visual analysis and/or knowledge
exploration as well as with extensive background in
using diverse Web browsers and accessing a variety
of online applications. All participants had prior
knowledge and at least some experience with list-
based browser histories. An initial step in the
evaluation process was to randomly divide the
participants into two groups and attribute a task to
them. Each member of the first group would have to
solve the task using the WebComets visualization,
while the members of the second group used a list-
based history. Next, the functionality of the two
tools was highlighted to each of the corresponding
groups. Note that the data contained in the browsing
histories were almost identical in content, except for
the fact that the list-based history was not able to
represent the additional fields generated and
included in the EBH.
The scenario involved the analysis of two
browsing sessions from different users. An initial
assumption was made that the users have
participated at an online conference call where they
suggested relevant Web sites to each other. This
collaborative browsing approach is frequently used
in cases where one party tries to highlight some
information to the other. A simple example for this
would be the collaboration between two remote
students that are preparing for an exam. As a result,
both users would access multiple similar or identical
Web pages in the same time interval. The test
persons had to determine if the initial assumption of
collaboration is supported by the browser histories,
and if so, what Web pages might have been involved
and in what time interval this collaboration took
place.
The results were evaluated by inspecting the total
Figure 7: The motif window that helps users construct, save and search for custom structures / motifs based on Web page
attributes and context information.
IVAPP2013-InternationalConferenceonInformationVisualizationTheoryandApplications
448
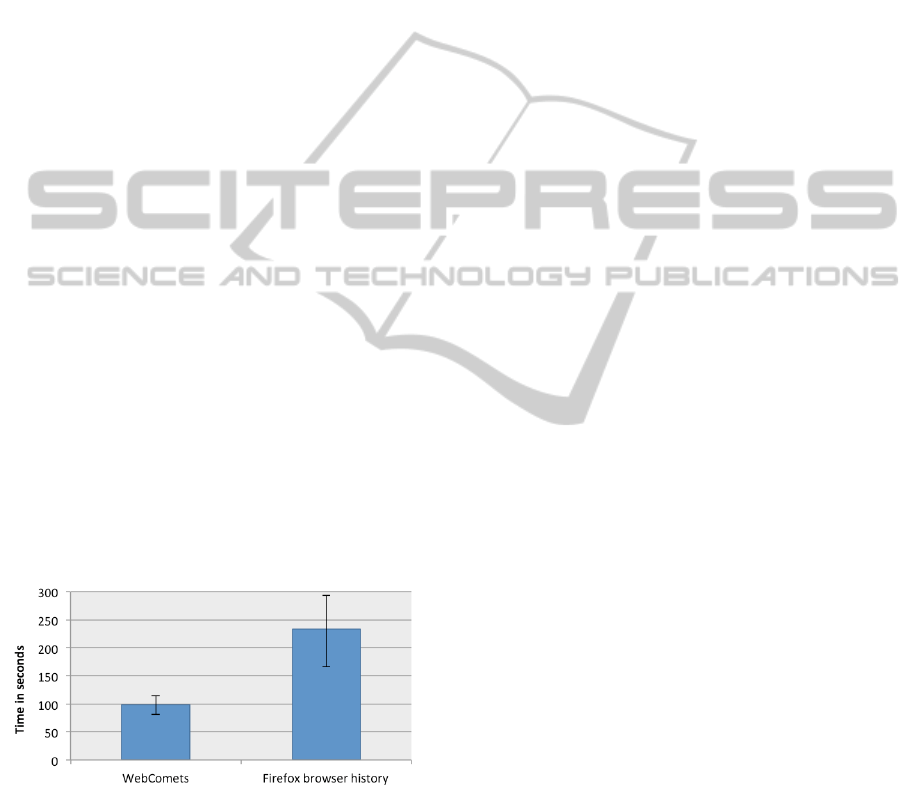
time each participant took to find a solution and the
time frame he/she reported as part of the conference
session. Figure 8 shows that the test persons
managed more quickly to find a solution with the
WebComets visualization than with the text-based
representation of the navigation history. To further
support this, the standard deviations have been
computed for the average solution times. The
importance of these values is further weighted by the
reported time frames for the assumed conference
session. Actually, the subjects that used the
WebComets tool have identified the correct time
frame in almost 100% of the cases, as only one
participant missed the presence of an additional Web
page in both history sessions around the same
moment in time. In contrast, the group using the list-
based browser history has reported a lower success
rate with only a 71% average overlap of the detected
collaboration time frame.
Additionally, the participants were given a post-
task questionnaire inquiring about the usability,
interaction and graphical aspects of the WebComets
visualization. Moreover, users had the opportunity to
express their opinions freely about the application
through a set of open questions. The outcome
suggested that users were overall satisfied with the
visual representations (e.g., “I found the comets had
useful information and were easy to understand”)
and interaction possibilities supplied by WebComets
(e.g., “I like the back and forward arrows. It’s a
better solution than repeating the Web page
instance” or “I can oversee all important information
in one view”), and that most participants would use
such a tool for analyzing parallel browsing behavior
or detecting and comparing browsing patterns.
Figure 8: Average time required by the subjects to find the
solution to the given task. The narrow black bars encode
the standard deviation.
6 CONCLUSIONS AND FUTURE
WORK
In this paper we presented WebComets, an
interactive visualization tool for tab-oriented,
parallel browser histories. After discussing related
work and functional requirements, we focused on
the individual components and interactive features
of our visualization tool. WebComets allows its
users to more efficiently search for patterns in
parallel browsing sessions as well as compare and
analyze the multi-tab browsing behavior of a group
of Internet users. An evaluation confirmed that our
approach has met the initial requirements, and our
users were able to quickly and efficiently gain
insight and find patterns in the history information
they were exploring.
As next steps of this research, we plan to make
WebComets widely accessible for analysts. While
the current version of this tool is focused around log
data, design and interaction features, in the future we
aim to adapt similarity search algorithms (e.g.,
automaton-based approaches) that could suggest
possible elements of interest to the tool users.
Furthermore, we plan to enhance our visualization
metaphor by adding a 1-dimensional, orthogonal
content-based operator for relative zooming along
the time axis in a certain area.
REFERENCES
Alexa: The Top Ranked Sites in Each Category,
http://www.alexa.com/top-sites/category, 2012.
Colorbrewer: Color advice for maps,
http://www.colorbrewer2.org, 2012.
Rescuetime, http://www.rescuetime.com, 2012.
Slife Labs Time Management Software,
http://www.slifeweb.com, 2012.
Adar, E., Teevan, J., Dumais, S.T. Large scale analysis of
web revisitation patterns. In Proceedings of the 26
th
Annual SIGCHI Conference on Human Factors in
Computing Systems, CHI ’08, pages 1197–1206, New
York, NY, USA, 2008. ACM.
Aula, A., Jhaveri, N., Kaki, M. Information search and
reaccess strategies of experienced web users. In
Proceedings of the 14th International Conference on
World Wide Web (WWW ’05), pages 583–592, 2005.
Card, S. K., Robertson, G.G., York, W. The Webbook and
the Web Forager: An Information Workspace for the
World Wide Web. In Proceedings of Human Factors
in Computing Systems (CHI 96), pages 111–117,
1996.
Cockburn, A., Greenberg, S., Jones, S., McKenzie, B.,
Moyle, M. Improving Web Page Revisitation:
Analysis, design and evaluation. In: IT & Society 1(3),
pages 159–183, 2003.
Cugini, J., Scholtz, J. VISVIP: 3D Visualization of Paths
through Websites. In: Proceedings of International
Workshop on Web-Based Information Visualization
(WebVis 99), Florence, Italy, pages 259–263, 1999.
WebComets:ATab-OrientedApproachforBrowserHistoryVisualization
449

Doemel, P. Webmap - A Graphical Hypertext Navigation
Tool. In Proceedings of the Second International
World Wide Web Conference, 1994.
Dou, W., Wang, X., Skau, D., Ribarsky, W., Zhou, M.X.
LeadLine: Interactive Visual Analysis of Text Data
through Event Identification and Exploration. IEEE
Conference on Visual Analytics Science and
Technology, 2012.
Eric, M., Ayers, E. Z., Stasko, J. T. Using Graphic History
in Browsing the World Wide Web. In: International
WWW Conference, pages 1–7, 1995.
Gandhi, R., Girish, K., Bederson, B. B., Shneiderman, B.
Domain Name Based Visualization of Web Histories
in a Zoomable User Interface. In: Proceedings of 11th
International Workshop on Database and Expert
Systems Applications (DEXA), pages 591–598, 2000.
Gross, E. F. Adolescent Internet use: What we expect,
what teens report. In: Applied Developmental
Psychology 25, pages 633–649, 2004.
Hightower, R. R., Ring, L. T., Helfman, J. I., Bederson, B.
B., Hollan, J. D. Graphical Multiscale Web Histories:
A Study of Padprints. In: UIST 98 Proceedings of the
11th annual ACM Symposium on User Interface
Software and Technology, pages 58–65, 1998.
Huang, J., White, R. W. Parallel Browsing Behavior on
the Web. In: Proceedings of the 21st ACM conference
on Hypertext and hypermedia (HT ’10), pages 13–18,
2010.
Kaasten, S., Greenberg, S. Integrating Back, History and
Bookmarks in Web Browsers. In: Extended Abstracts
of ACM Conference of Human Factors in Computing
Systems (CHI ’01), ACM Press, pages 1–2, 2000.
Kaasten, S., Greenberg, S., Edwards, C. How people
recognize previously seen web pages from titles, urls
and thumbnails. In: People and Computers XVI, pages
247–265, 2001.
Katz, J., Aspden, P. Motivations for and Barriers to
Internet usage: Results of a National Public Opinion
Survey. In: Internet Research: Electronic Networking
Applications and Policy 7, pages 170–188, 1997.
Kellar, M., Watters, C., Inkpen, K. M. An Exploration of
Web-based Monitoring: Implications for Design. In:
Proceedings of the SIGCHI Conference on Human
Factors in Computing Systems, CHI ’07, pages 377–
386, New York, NY, USA, 2007. ACM.
Kleek, M. V., Xu, C., Moore, B., Karger, D. R.
Eyebrowse: Real-time Web Activity Sharing and
Visualization. In: 28th ACM Conference on Human
Factors in Computing Systems (CHI’10), ACM, 2010.
Krstajic, M., Bertini, E., Keim, D. Cloudlines: Compact
Display of Event Episodes in Multiple Time-series.
Visualization and Computer Graphics, IEEE
Transactions on, 17(12):2432–2439, December 2011.
Miyata, Y., Norman, D. Psychological issues in support of
multiple activities. In: User Centered System Design,
D.A. Norman and S.W. Draper (Eds), pages 265–284,
1986.
Reeder, J., Reeder, J., Giegerich, R. Locomotif: From
Graphical Motif Description to RNA Motif Search in
Bioinformatics, In: Bioinformatics 23(13)
, pages 392 –
400, 2007.
Shen, S. T., Prior, S. D., Chen, K. M. A Solution to
Revisitation using Organic Bookmark Management.
In: Design, User Experience, and Usability. Theory,
Methods, Tools and Practice: First International
Conference, pages 46–52, 2011.
Spink, A., Park, M., Jansen, B. J., Pedersen, J.
Multitasking during web search sessions. In: Inf.
Process. Manage. 42, 1, pages 264–275, 2006.
Viermetz, M., Stolz, C., Gedov, V., Skubacz, M.
Relevance and impact of tabbed browsing behavior on
web usage mining. In: Proceedings of the 2006
IEEE/WIC/ACM International Conference on Web
Intelligence (WI ’06), pages 262–269, 2006.
von Landesberger, T., Rehner, R., Gorner, M., Schreck, T.
A system for interactive visual analysis of large graphs
using motifs in graph editing and aggregation. In:
Vision Modeling Visualization Workshop (VMV 2009),
2009.
Ware, C. Information visualization (second edition),
perception for design. Elsevier Inc., 2004.
Waser, J., Fuchs, R., Ribicic, H., Schindler, B., Blöschl,
G., Gröller, E. World Lines, In: Visualization and
Computer Graphics, IEEE Transactions on, vol. 16,
no. 6, pages 1458-1467, 2010.
Waterson, S., Hong, J. I., Sohn, T., Heer, J., Matthews, T.,
Landay, J. What did they do? Understanding
clickstreams with the webquilt visualization system. In
Advanced Visual Interfaces, pages 94–102, 2002.
Weinreich, H., Obendorf, H., Herder, E., Mayer, M. Off
the beaten tracks: exploring three aspects of web
navigation. In: Proceedings of the 15th international
conference on World Wide Web (WWW ’06), pages
133–142, 2006.
Yu, W., Ingalls, T. Trails-an interactive web history
visualization and tagging tool. In: HCII (10), pages
77–86, 2011.
IVAPP2013-InternationalConferenceonInformationVisualizationTheoryandApplications
450
