
A Two-step Subspace Approach for Automatic Detection of CAP
Phases in Multichannel Ambulatory Sleep EEG
Ammar Hussain Khan
1
, Ibrahim Onaran
2
, Nuri Firat Ince
1,2
, Mostafa Kaveh
1
, Tacjana Friday
3
,
Mike Howell
3
, Thomas Henry
3
and Zhiyi Sha
3
1
Department of Electrical and Computer Engineering, University of Minnesota, 200 Union Street SE, Minneapolis, U.S.A.
2
Department of Neurosurgery, University of Minnesota, 420 Delaware Street SE, Minneapolis, U.S.A.
3
Department of Neurology, University of Minnesota, 420 Delaware Street SE, Minneapolis, U.S.A.
Keywords: Cyclic Alternating Pattern, Ambulatory EEG, Principal Component Analysis, Spatial PCA, Classification.
Abstract: Cyclic Alternating Pattern (CAP) Occurs during Non-Rapid Eye Movement (NREM) Sleep and Is Exploited
as a Neuro-Marker of Various Sleep Disorders. the CAP Is Build up from so Called a and B Phases Which
Correspond to Widespread Synchronous and Regular Background Activities of EEG Respectively.
Currently, These Phases Are Detected by Medical Experts through Visual Inspection, Thereby Limiting
Their Potential to Be Used as a Gauge for Sleep Quality. This Paper Aims to Contribute to the Current
Effort towards Automatic Detection of CAP Phases, so That Its Potential Can Be Improved in the
Assessment of Sleep Quality. unlike Previous Research Where a Predefined Bipolar (and/or Monopolar)
Channel Was Used for Automatic Detection, This Paper Explores the Use of a Two-Step Principal
Component Analysis (PCA) in Spatial and Feature Domains to Extract Features from All 21 Recording
Channels of Ambulatory EEG. Linear Discriminant Analysis (LDA) Was Used on the Extracted Features to
Discriminate Phase a and B. over a Five Subject Database, Our Algorithm Reached an Average
Classification Accuracy over 86%, Whereas the Baseline Approach Resulted in an 80.3% Success Rate.
These Results Indicate That the Two Step PCA Procedure Can Be Used Effectively to Extract Features from
Ambulatory EEG towards Detection of CAP.
1 INTRODUCTION
Physiologically sleep is divided into two broad
categories: rapid eye movement (REM) and non-
rapid eye movement (NREM). NREM sleep itself
consists of sleep stages 1-3, parts of which
contribute to the cyclic alternating pattern (CAP)
(Terzano et al., 1985). As suggested by the name,
CAP is a periodic phenomenon, which can be
observed noninvasively in the electroencephalogram
(EEG) signal. A particular CAP cycle is composed
of phases A and B, where phase A is characterized
by transient electro-cortical events as opposed to
phase B, which is a return to the background
(Terzano et al., 1985). Both phases A and B can last
between 2 and 60 seconds and are called the
microstructures of NREM sleep (Mariani et al.,
2011).
Research on CAP in the past two decades has
shown its potential as a marker for sleep instability.
CAP has also been associated with several sleep
pathologies such as sleep disordered breathing and
periodic limb movement disorder (Terzano and
Parrino, 1993). Increased amounts of CAP are
normally found in cases with obstructive sleep apnea
syndrome (Halász et al., 2004). In several studies,
CAP A phase has been understood as a kind of gate
through which certain pathological events occur
more easily. This phenomenon has exhibited itself in
sleep disturbances such as sleep bruxism and
epilepsy (Kato et al., 2003); (Eisensehr et al., 2001);
(Halász et al., 2002). In addition, CAP rate (the ratio
between NREM CAP sleep and total NREM sleep)
and the distributions of phase A during the CAP
sequences can be used to characterize such sleep
pathologies (Mariani et al., 2011).
Currently, the phases of CAP are detected by
medical experts by visual inspection, which is a
cumbersome and subjective procedure. In the past
few years, there has been an increasing interest in
the automatic detection of CAP in EEG. Largo et al.
(2005) utilized a wavelet approach in combination
342
Khan A., Onaran I., Firat Ince N., Kaveh M., Friday T., Howell M., Henry T. and Sha Z..
A Two-step Subspace Approach for Automatic Detection of CAP Phases in Multichannel Ambulatory Sleep EEG.
DOI: 10.5220/0004247803420346
In Proceedings of the International Conference on Bio-inspired Systems and Signal Processing (BIOSIGNALS-2013), pages 342-346
ISBN: 978-989-8565-36-5
Copyright
c
2013 SCITEPRESS (Science and Technology Publications, Lda.)

Figure 1: The schematic diagram of the two-step feature
extraction and classification system.
with a genetic algorithm to detect CAP. Recently,
machine learning approaches such as the use of
neural networks and support vector machines have
also been explored as methods for automatic CAP
detection (Mariani et al., 2011); (Mariani et al.,
2010). The subband power of EEG in delta (0-4Hz),
theta (4-8Hz), alpha (8-12Hz) and beta (13-30Hz)
are widely used as input features to classifiers. In
these studies generally, a pre-selected bipolar
electrode pair was used for feature extraction.
To our knowledge none of the previously-
proposed methods have resulted in high enough
accuracy such that they can be used in clinical
practice. This paper contributes to the state of the art
in CAP detection by developing such an automated
method by employing a different feature extraction
strategy using the standard tools of statistical signal
processing. Unlike the previous attempts where a
preselected bipolar (and/or monopolar) channel was
used for automatic detection, the approach described
in this paper uses a two-step Principal Component
Analysis (PCA) executed in spatial and feature
domains to extract a small feature set from
multichannel ambulatory EEG recordings. A
schematic diagram representing our approach is
given in Figure 1. In the rest of the paper, we first
describe the ambulatory EEG dataset used for
performance evaluation. Then we explain our feature
extraction and classification techniques. Finally, we
provide classification results and compare our
algorithm to a baseline technique utilizing
predefined channels.
2 METHODS AND MATERIALS
2.1 Data Processing and Monitoring
Continuous ambulatory EEG recordings of five adult
subjects (3 females and 2 males) with suspected
seizure disorder were recorded at their homes. This
was different from previous research, where the
EEG recordings were made in laboratories. Using a
home setting is beneficial as it might eliminate or
reduce any subconscious changes in the sleep pattern
that might occur as a result of a lab based sleep
setting. The subjects had no known history of sleep
disorders. Their age ranged from 19 to 41. The
recordings were obtained with a portable data
acquisition unit (XLTEK Trex, Natus Medical CA).
EEG was sampled at 200 Hz from 21 channels that
were in accordance with the 10-20 system. The
recordings were obtained by the neurology
department at the University of Minnesota and
approval was obtained from the University of
Minnesota institutional review board to analyse the
data offline. In order to define a ground truth, an
expert visually scored the continuous ambulatory
EEG into the following events:
i) macrostructure: sleep stages 1-4, wake, REM
sleep,
ii) arousal,
iii) microstructure: A and B phases.
A representative annotated multichannel EEG
data composed of A and B phases is presented in
Figure 2. The data was converted from XLTEK to
Matlab format for further analysis by using in-house
developed software tools.
2.2 Spatial PCA (sPCA)
Our preliminary observations in the collected
ambulatory EEG data (as depicted in Figure 2)
indicated that the phase A is characterized by
transient widespread synchronous electro-cortical
events. These events are followed by background
activity (phase B). With this motivation, rather than
using a predefined channel set, we used spatial
principal component analysis (sPCA) to transform
the full multichannel EEG into linear projections of
the data on a set of virtual orthogonal channels
represented by the spatial eigenvectors. Each
eigenvector is a weighted linear combination of the
EEG recording channels. The orthogonal principal
components are tuned to account for the spatial
variance in the data with minimum number of
elements. This property of PCA makes it possible to
Figure 2: The raw EEG data and the CAP annotations as
seen on the XLTeK recording system.
ATwo-stepSubspaceApproachforAutomaticDetectionofCAPPhasesinMultichannelAmbulatorySleepEEG
343
represent the multi-channel EEG data with a small
set of virtual channels, and, thereby serves as a
dimension reduction and SNR improvement step.
The sPCA was computed by running an eigenvalue
decomposition on the spatial covariance matrix with
a dimension of 21x21. The cumulative energy
spectrum of the eigenvalues of the sPCA is given in
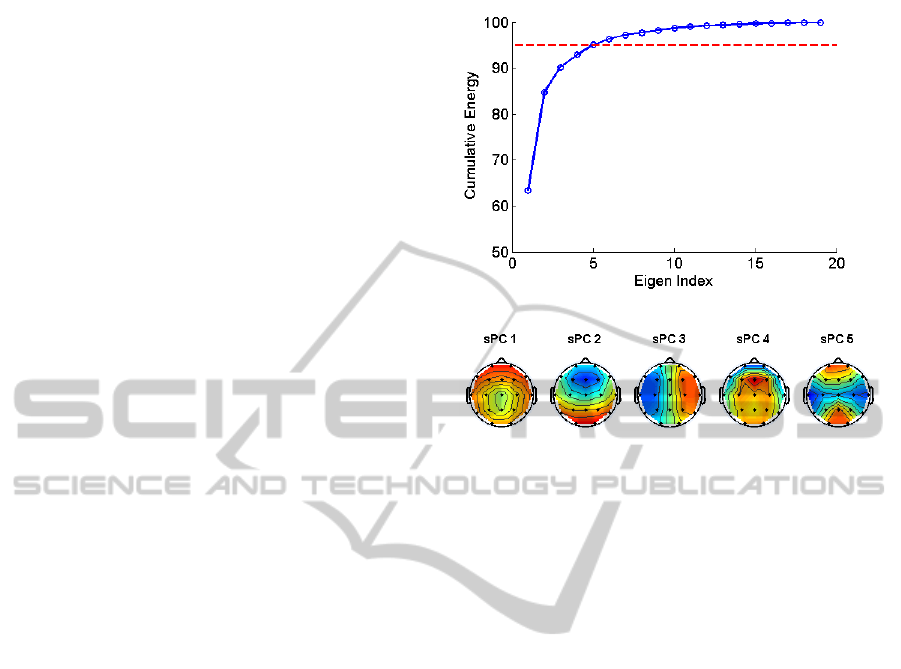
Figure 3-A. We observe that only five components
were able to account for the 95% of the total
variance in the data. Consequently, we elected to use
the first five components to project the multichannel
EEG data into virtual channels. Thus performing the
sPCA reduced the initial dimensionality from 21 to
5.
In order to give a flavour about the distribution
of spatial projections, the top five spatial
eigenvectors are visualized on 2D topological head
maps in Figure 3-B.
2.3 Subband Features
After projecting the 21 channel EEG into the virtual
channels, we computed the power in the following
five frequency bands as features:
Delta Low (0-2Hz)
Delta High (2-4Hz)
Theta (4-8 Hz)
Alpha (8-13Hz)
Beta (13-30 Hz)
To find the power in each of these bands, a
Welch periodogram (Hayes, 2009) was computed by
using a Hamming window of size 200 samples with
an overlap of 50 samples where the FFT was
computed at 512 points.
After computing the five subband powers for
each of the five virtual channel, a feature vector of
size 25 was obtained for use in classification
A straightforward strategy would be to feed the
above 25-dimensional feature vector into a classifier
for final decision. However, high dimension is
generally associated with poor generalization
capability in the classifier. For this reason, we
implemented another dimension reduction step via
PCA. In this approach, a subband matrix was formed
with a structure of Nx25 where N represents the total
number of A and B phase instances. Then the data
was converted to log scale to suppress the skewness
of the distribution and the effect of outliers and
normalized. We executed another PCA in this
feature space (fPCA) and examined the Eigen
spectrum as in the previous sPCA step. The
cumulative energy spectrum related to fPCA is given
in Figure 4. It is observed that only two principal
A
B
Figure 3: A) sPCA spectrum. The red line indicates that
the at least 95% of spatial PCA spectrum is preserved by
the coefficients below the line. B) 2D topological head
maps of the sPCA components computed from all
subjects.
components accounted for more than 95% of the
variance in the feature space. Consequently, we
selected the top two vectors for final feature
extraction.
In order to give an idea about the discriminatory
power of these components we calculated the
receiver operating characteristic curve (ROC) for
each feature. The ROC curves for the top two
components are given in Figure 5. A scatter plot
representing the distribution of A and B instances of
all subjects in this 2D space is given in Figure 6. It is
observed that these two features provided noticeable
discrimination between phase A and phase B.
2.4 LDA Classifier
For CAP detection, classification entailed using part
of the provided data to form a ‘classifier’ that would
distinguish between phase A and phase B. Then
using the remaining data, the performance of the
classifier was tested to determine the potential for
automatic detection of CAP. We used a leave-one-
subject-out strategy to train and test the LDA
classifier.
Classification was chosen as one of the methods
because it works as a ‘supervised’ learning
technique; that is for any given instance, the class or
category to which it belongs is known apriori.
BIOSIGNALS2013-InternationalConferenceonBio-inspiredSystemsandSignalProcessing
344
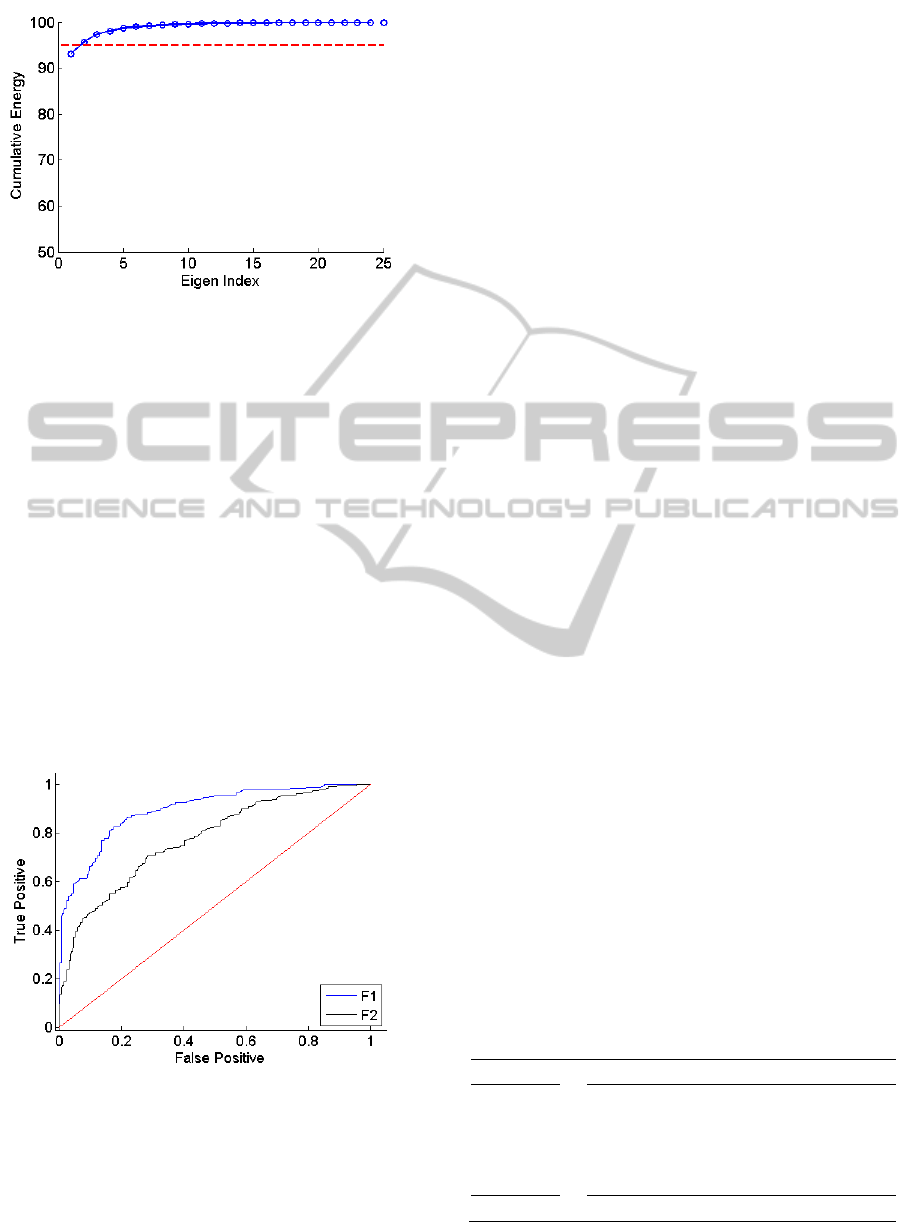
Figure 4: The spectral PCA spectrum (fPCA). The red line
indicates 95% of the cumulative energy preserved in the
PCA coefficients.
Hence, for any given inputs the desired output is
well defined. Along these lines, previous research on
the topic of CAP detection has tried different
machine learning algorithms including neural
networks, genetic algorithms and support vector
machines (SVM). In this study, an LDA, which is a
parameter free classifier, was used.
In order to compare the efficacy of our approach
we compared it to a baseline technique, where
predefined bipolar and monopolar channels are used
for feature extraction. In this study, we used F4-C4
bipolar and C4 monopolar electrodes as in (Mariani
et al., 2011). The same subband features were
extracted and fed to an LDA classifier to obtain a
fair comparison.
Figure 5: ROC curve of the first two components (F1 and
F2) of the fPCA.
3 RESULTS
Table 1 shows the classification results obtained
from our two-step PCA method and the baseline
approach. Over a 5-subject database, our method
provided 86.8% classification accuracy. The
baseline approach was able to reach 80.3%
classification accuracy on the same database. We
note that our approach not only provided
significantly better results (p=0.006, paired t-test)
but also outperformed the baseline technique in each
subject.
4 CONCLUSIONS
In previous research on CAP detection, the EEG
signal was processed from the difference between
two predefined channels (varying depending on
particular research) from the 10-20 EEG system.
One disadvantage of using the difference of a
particular pair of channels is that these channels
actually might not have the most significant
contribution to the different phase subtypes. By
using a particular pair, there is hence the chance that
the channels with the most vivid distinctions
between the different phases are overlooked. In this
study, by taking a completely different approach
from previous research we performed a two-step
PCA to account for the information in all channels
while removing redundancies, and reducing the
influence of noise and other non-informative signal
components.
Performing the sPCA essentially yielded in
‘virtual channels’. These channels were then used to
form topological head maps to observe the
distribution of spatial projection weights. Given that
each sPC is linear combination of the 21 channels,
the topological head maps for each sPC
demonstrated how much a particular area was
contributing to CAP.
Table 1: The Classification Results of Spatial & Feature
Space PCA and fixed channel method using C4-F4 & C4
electrodes.
Subject sPCA & fPCA C4-F4 + C4
1
88.5 81.5
2
84.0 74.8
3
87.2 76.9
4
87.9 84.6
5
86.6 83.6
Avg.
86.8 80.3
ATwo-stepSubspaceApproachforAutomaticDetectionofCAPPhasesinMultichannelAmbulatorySleepEEG
345
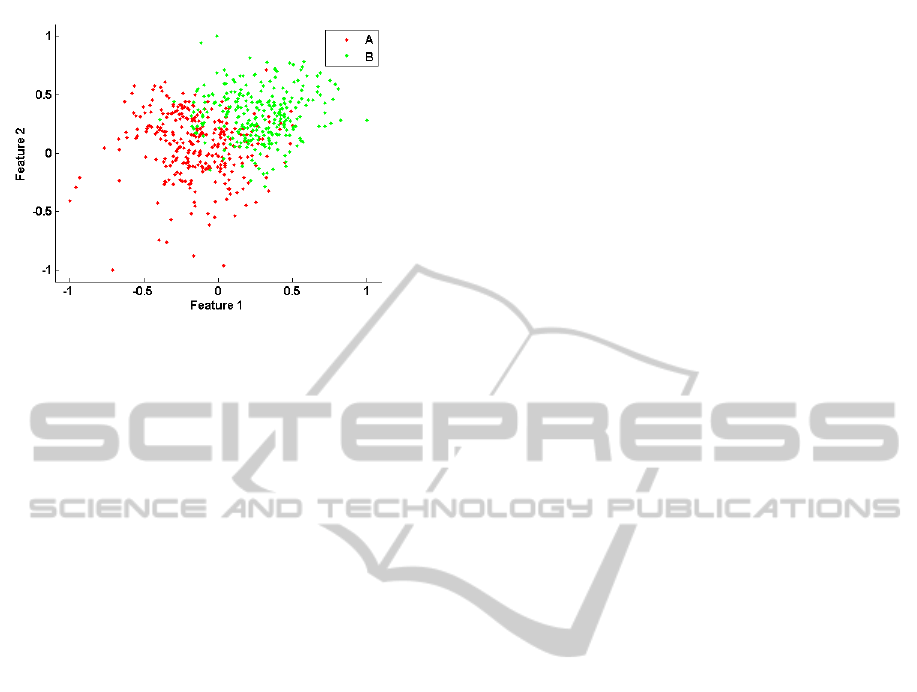
Figure 6: The scatter plot of the first two fPCA features
for all subjects.
After performing another PCA on the feature
space composed of subband powers of virtual
channels, we utilized an LDA classifier for final
decision. By using this technique, we demonstrated
that automatic detection of CAP phases such as A
(activity) and phase B (background) could be
achieved with an average accuracy of 86.8% by
using only two effective features.
It should be noted that the current classification
results were obtained from features extracted in
manually segmented EEG. However, in a fully
automated detection system, the borders of A and B
phases should be detected as well. Therefore,
additional research is needed to extend this
algorithm to continuous EEG recordings.
REFERENCES
Eisensehr, I., Parrino, L., Noachtar, S., Smerieri, A., and
Terzano, M. (2001). Sleep in Lennox-Gastaut
syndrome: the role of the cyclic alternating pattern
(CAP) in the gate control of clinical seizures and
generalized polyspikes. Epilepsy Research, 46(3):241
— 250.
Halász, P., Terzano, M., and Parrino, L. (2002). Spike-
wave discharge and the microstructure of sleep-wake
continuum in idiopathic generalised epilepsy.
Neurophysiologie Clinique/Clinical Neurophysiology,
32(1):38 — 53.
Halász, P., Terzano, M., Parrino, L., and Bódizs, R.
(2004). The nature of arousal in sleep. Journal of
Sleep Research, 13(1):1—23.
Hayes, M. H. (2009). Statistical digital signal processing
and modeling.
Kato, T., Montplaisir, J., Guitard, F., Sessle, B., Lund, J.,
and Lavigne, G. (2003). Evidence that Experimentally
Induced Sleep Bruxism is a Consequence of Transient
Arousal. Journal of Dental Research, 82(4):284—288.
Largo, R., Munteanu, C., and Rosa, A. (2005). CAP event
detection by wavelets and GA tuning. In Intelligent
Signal Processing, 2005 IEEE International Workshop
on, pages 44 — 48.
Mariani, S., Bianchi, A., Manfredini, E., Rosso, V.,
Mendez, M., Parrino, L., Matteucci, M., Grassi, A.,
Cerutti, S., and Terzano, M. (2010). Automatic
detection of a phases of the cyclic alternating pattern
during sleep. In Engineering in Medicine and Biology
Society (EMBC), 2010 Annual International
Conference of the IEEE, pages 5085 —5088.
Mariani, S., Grassi, A., Mendez, M., Parrino, L., Terzano,
M., and Bianchi, A. (2011). Automatic detection of
CAP on central and fronto-central EEG leads via
support vector machines. In Engineering in Medicine
and Biology Society,EMBC, 2011 Annual
International Conference of the IEEE, pages 1491 —
1494.
Terzano, M. G., Mancia, D., Salati, M. R., Costani, G.,
and et al (1985). The cyclic alternating pattern as a
physiologic component of normal NREM sleep. Sleep:
Journal of Sleep Research & Sleep Medicine,
8(2):137—145. ID: 1989-28667-001.
Terzano, M. G. and Parrino, L. (1993). Clinical
applications of cyclic alternating pattern. Physiology
& Behavior, no. 54, pp. 807-813.
BIOSIGNALS2013-InternationalConferenceonBio-inspiredSystemsandSignalProcessing
346
