
Classification of Hepatitis Patients and Fibrosis Evaluation using
Decision Trees and Linear Discriminant Analysis
Romasa Qasim and Rashedur M Rahman
Department of Electrical Engineering and Computer Science, North South University,
Plot # 15, Block B, Bashundhara, Dhaka 1229, Bangladesh
Keywords: Decision Tree, Data Mining, Hepatitis, LDA.
Abstract: In this paper we try to solve the challenge presented by the Chiba University and Hospital, Japan. Learning
from the available liver biopsy data, the type of hepatitis of a test patient is found out without performing
patient’s liver biopsy. The degree of liver fibrosis is also determined without performing biopsy. It is
observed that for hepatitis type classification, linear discriminant classification performed well, and for
finding the degree of liver fibroses decision tree’s results are encouraging. Later, the obtained decision tree
is used to find out whether the interferon therapy, taken by set of patients, is effective or not. Result shows
that linear discriminant analysis best suits to classify the type of hepatitis. However, to find the stage of
fibrosis, decision tree performs well. The research finding reveals the fact that interferon therapy either
reduces the liver fibroses level or does not let it increase from the diagnosed level.
1 INTRODUCTION
Liver plays a central role in processing, storing and
redistributing the nutrients provided by the meals to
the human body (Rolfes and Whitney, 2009). If this
organ is affected, all other parts of the body will be
affected. One such fatal disease which affects liver is
Hepatitis which keeps on damaging tissues of liver.
By definition it is the inflammation of liver, caused
by infection with specific viruses, designated by the
letters A, B, C, D and E. Among all types of
hepatitis, B and C are most severe. Besides, the
vaccination of C is yet not available. The situation is
more critical because hepatitis B and C are not easily
diagnosable in their early stages and it may result in
chronic or liver cancer when the patient starts
feeling disturbance and goes for his first diagnosis.
So, most of the cases on first diagnosed, already the
patient has reached to the severe stage. In this paper
an effort is made to classify the hepatitis type and
the level of severity using the results of different
types of examinations performed in hospital by
applying data mining techniques. The data used for
this purpose is provided by the Chiba Hospital
University, Japan (EMCL/PKDD Discovery
Challenge, 2005). This data consists of 7 tables
which contain basic information of patients, results
of liver biopsy, in-hospital examination results, out-
hospital examination, measurements of in-hospital
examination, hematological data.
Total 694 hepatitis patients information were
recorded in the dataset. The data collection period
spanned over 20 years which makes it a rich data set.
Since it is a pretty large set of data, therefore, data
mining techniques suit best for the analysis and
information extraction. The providers of the data
also present four challenges to the researchers
(EMCL/PKDD Discovery Challenge, 2005), which
are as follows:
1. Discover the differences in temporal patterns
between hepatitis B and C.
2. Evaluate whether laboratory examinations can
be used to estimate the stage of liver fibrosis.
3. Evaluate whether the interferon therapy is
effective or not.
4. Validate the following hypothesis regarding
GOT and GPT: GOT and GPT are considered
to measure the speed of the inflammation. Does
an equation "progress speed" x "time" = "the
clinical stage of hepatitis" hold on the real
data?
In this paper, we tried to address second and third
challenge using decision trees. Linear discriminant
analysis is also used to compare with the results of
decision tree. Decision tree induction is based on
239
Qasim R. and M Rahman R..
Classification of Hepatitis Patients and Fibrosis Evaluation using Decision Trees and Linear Discriminant Analysis.
DOI: 10.5220/0004449602390246
In Proceedings of the 15th International Conference on Enterprise Information Systems (ICEIS-2013), pages 239-246
ISBN: 978-989-8565-59-4
Copyright
c
2013 SCITEPRESS (Science and Technology Publications, Lda.)

CART method which is specially chosen among
other methods due to its reliability, speed and
accuracy.
2 RELATED WORK
Durand and Soulet (2005) worked on the
characterization of liver fibrosis using clustering on
the same dataset. They proposed a soft clustering
method to build a global model from emerging
pattern which describe local contrasts between two
or more classes. Focusing on the in-hospital
examination, the authors came up with some
examinations which are more associated with the
severe stages of liver fibrosis. They also noticed that
it is more difficult to characterize the initial stages as
compared to the severe stages.
Yaseen el al. (2011) proposed a model using
Principle Component Analysis and Regression
model to predict the probability of life and death of
hepatitis C patients on the dataset of machine
learning warehouse of University of California.
Ho et al. (2007) worked with the same dataset,
which is used in this paper, to solve the first and
second challenge given by the data provider. They
tried to find the change patterns of the test results
provided in the dataset. The authors then tried to
find the temporal relations between these temporal
patterns.
Different techniques have been used to address
the above mentioned challenge given by Chiba
University Hospital in (Aubrecht and Kejkula,
2005). The authors searched the temporal patterns
between Hepatitis B and C by using trend
characterization technique.
Vatham and Osmani (2005) made an effort to
classify the patients according to their types, i.e., B
and C. After the classification, the authors used the
processed data to find the temporal patterns between
Hepatitis B and C. They have used 3 fold cross
validation to measure the accuracy of their
methodology. The system they developed classified
samples as Class B and C correctly around 57% and
61% respectively.
Multi-relational association rules were used by
Pizzi et al. (2005). An algorithm named Connection
was used to infer the degree of liver fibrosis. The
authors examine the blood and urine tests along with
the biopsy results to find out the pattern which may
set up a correlation between the exam results and the
degree of fibrosis. They used the support and
confidence value to rate the rules and divide the
selected tests into three groups.
Karthikeyan and Thangaraju (2013) analyzed the
hepatitis patients from the dataset provided in UC
Irvine machine learning repository. They made use
of an open source tool named WEKA and performed
different algorithms and data processing techniques.
They used naive bayes, j48, trees, random forest and
multilayer perceptron to the dataset and found that
the performance of naive bayes both in terms of time
and accuracy is better than other classifiers. They
achieved the accuracy of around 84% for naive
bayes classifier.
Same data set as used in this paper was analyzed
by Geamsakul et. al. (2007). They had used a graph
based induction method for the classification of
hepatitis type. The algorithm constructed a decision
tree for graph structured data while simultaneously
constructing attributes of classification. They also
performed the classification of hepatitis type and
stage of its fibrosis for which they have constructed
a total of 262 graphs for both. The authors achieved
an average accuracy of 79.6% for the classification
of hepatitis type.
3 DATA PREPROCESSING
Data pre-processing is usually the first step in any
work involving data mining. The dataset, as
mentioned before, contains data with different
patterns, which needs pre-processing before
applying data mining techniques to it. As mentioned
before the data consists of 7 tables, out of which 5
tables have been used in this paper. The tables
consist of patients’ data including their id for
reference, gender and date of birth. Most of the
patients in that table performed liver biopsy which is
maintained in another table. It is worth mentioning
here that not all the patients have gone through with
liver biopsy and the date of liver biopsy is different
for different patients. Liver biopsy test also results in
the fibroses and activity of the virus inside the body.
The in-house examinations of patients contain the
results of different medical examinations taken on
different period of times spanning 20 years. The set
of examinations taken are not the same for all the
patients, all the time. So there are missing values in
this table.
Data mining provides different techniques to
handle the missing values like filling up the data
using the global constant mean or may be
interpolation but since the nature of this dataset is
sensitive so did not fill the missing values by using
off-the-shelf techniques. That is why, the missing
values in data set is simply ignored in this work.
ICEIS2013-15thInternationalConferenceonEnterpriseInformationSystems
240

Therefore, out of 148 tests performed on different
patients on different time, only 15 tests were
selected, which do not have any missing values. The
data of selected 15 tests is available in the dataset for
all patients whose examinations results have been
collected. Selecting these data will provide a clear
insight about the condition of patients since there is
no missing value. Normal ranges of these tests for a
healthy body with no such infection are also
provided by Chiba University and hospital in a
separate table for reference purpose.
Since the data span on 20 years and the biopsy is
performed once during this period of time which is
not necessarily at the start of the examination period,
therefore, careful attention is required while
selecting in-house examination data for patients.
Because there might be a possibility that the patient
is not already infected with hepatitis in earlier dates.
So, data of examinations performed on dates near to
the biopsy date is selected only to be sure that the
patient is actually infected with hepatitis.
Pre-processing of data also involves reading the
data from different comma separated files of
different formats, combing the data present in
different tables to related fields to make sense and
fetching only set of related information from bulk of
data provided.
4 METHODOLOGY
One of the challenge given by Chiba University
Hospital is to find out the fibrosis level using
different test results provided in the data set so that
liver biopsy should be avoided which is invasive to
the body. To address this goal, two different
classification techniques have been used, for
example, linear discriminant analysis and decision
trees. Before applying the classification, only those
examination results are fetched out which are
performed next twenty days to the test date of liver
biopsy. The test results performed before the date of
liver biopsy examination is not taken because there
is no proof that whether the patient was actually
affected with hepatitis in that date or not. Records
having missing values are completely ignored for
this classification. Out of 246 patient samples, 200
samples are used to train the model and 46 samples
are used to test the classification model.
In the data, two kinds of hepatitis are considered
i.e., Hepatitis B and C. Since Hepatitis C Virus
(HCV) and Hepatitis B Virus (HBV) are distinct
viruses with different epidemiological profiles,
mode of transmission, natural histories and
treatments (Bradford et al., 2008), therefore, to
address second challenge, first target is to classify
the type of hepatitis (i,e., either B or C) using the in-
house examination of patients. The second target is
to classify the test results in its degree of liver
fibroses.
In this paper, two techniques i.e., linear
discriminant classification and decision trees, have
been used for classification purpose and their results
have been compared later. The algorithm used in the
decision tree is Classification and Regression Tree
(CART). The impurity measure used for tree split in
CART tree is chosen to be Gini Index, which can be
calculated using the formula given below:
1
|
(1)
CART selects the split that maximizes the
decrease in impurity,
(2)
where,
p
L
and p
R
are the left terminal and right terminal
probability of i th. node respectively and i(t) is the
gini index.
The reason to choose CART in the presence of
other methods is because of its reliability, speed and
accuracy. Loh (2008) has pointed out some
undesirable properties of CART. But, there are no
chances of CART to be failed in this work for
missing values or biasing because the data used in
this paper has already ignored missing values and
since it is not categorical so not much chances of
biasness as discussed by Loh (2008). It is also
mentioned in his paper that CART does exponential
splits in the case of categorical data. Since the nature
of data is not categorical therefore, it is safe to use
CART.
Accuracy and precision are used for the
performance measurement of linear discriminant
analysis.
(3)
(4)
The effectiveness of interferon therapy is then
analyzed by using the generated decision trees. Only
those medical examination records are fetched
which lies between the start and end date of the
interferon therapy of the patient. Because of the
ClassificationofHepatitisPatientsandFibrosisEvaluationusingDecisionTreesandLinearDiscriminantAnalysis
241
bulkiness of medical examination data (i.e., the table
contains in-house examination results of all patients
spanning 20 years contain 1565876 records), the
analysis of interferon effectiveness is performed on a
sample of the total set provide. 50 patients are
selected randomly who have taken the interferon
therapy as a sample space for the analysis. The
sample size is further reduced because some of the
patient’s medical examination records are not
present. So, the total sample space reduced to 30
patients which is actually not enough but we had to
go with this option because of the richness of data
and missing values in the dataset. The patients’
degree of liver fibroses is recorded at the time of
their liver biopsy; therefore, medical examination
near the end date of interferon therapy is taken. The
result of medical examination is then evaluated
using the decision tree generated for the
classification of degree of liver fibroses and the
results of both levels are compared at the end.
5 RESULTS AND DISCUSSION
Out of the two techniques used, the discriminant
analysis method performs well for the classification
of Hepatitis type. We have used 200 samples to
build the system and rest of 46 samples to test it.
During the testing phase, the confusion matrix
obtained for discriminant analysis is shown in Table
1.
Table 1: Confusion matrix of linear discriminant analysis
for classification of Hepatitis type.
Predicted Hepatitis Class
Actual
Hepatitis
Class
B C
B
25 1
C
5 15
Average accuracy and precision measure using
equations (3) and (4) from the above performance
matrix is around 87% and 83.3% respectively.
However, the performance of discriminant analysis
is drastically reduced when the same classification
method is applied to classify the data according to its
degree of fibrosis. The confusion matrix of data
classification based on its degree of fibrosis is given
in Table 2.
The accuracy measured from this confusion
matrix is 32% and the precision for each level from
F1 to F5 are 33.3%, 31.25%, 50%, 50%, 0%
respectively. The accuracy and precision measured
from this result very low. Such low rate of precision
obtained from linear discriminant analysis for the
classification of degree of fibrosis should not be
used for medical diagnosis purpose.
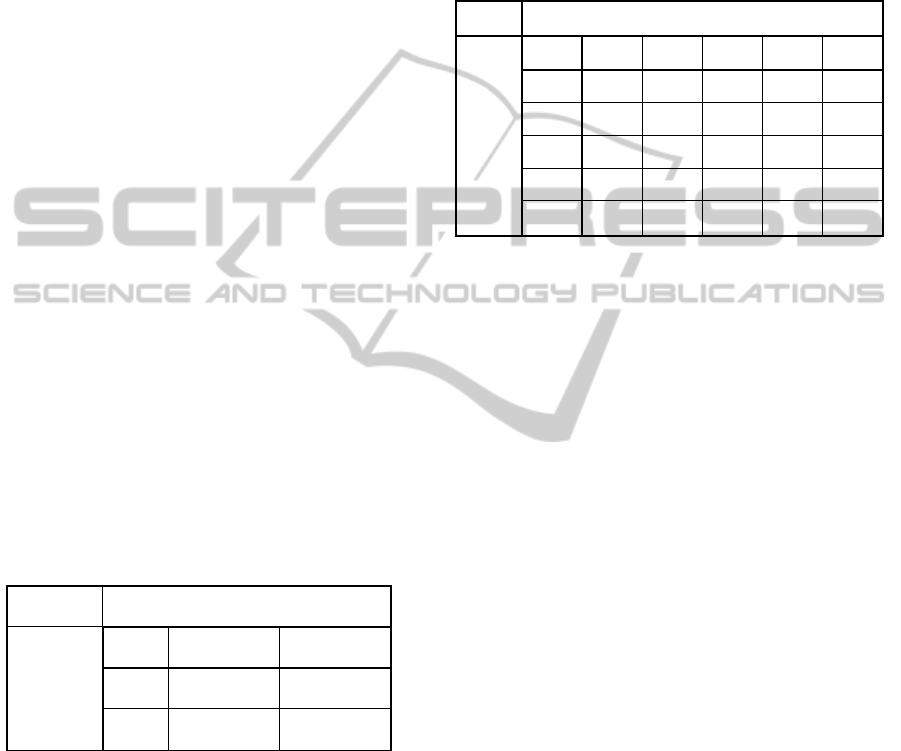
Table 2: Confusion matrix of LDA for classification of
stage of liver fibrosis level.
Predicted Classification of Fibrosis
Actual Classification
of Fibrosis
F1 F2 F3 F4 F5
F1
3 7 1 4 5
F2
5 5 2 0 2
F3
1 4 3 0 0
F4
0 0 0 4 0
F5
0 0 0 0 0
Reason for this reduced performance may be that
in the hepatitis type classification there are only two
classes, either A or B, however, in the classification
of degree of fibrosis, there are five levels given
numeric value of 0 – 4. It can be deduced from the
accuracy and precision value that linear discriminant
analysis can be well applied to small number of
classes. But with more classes, the performance is
significantly reduced.
Decision tree is, however, a data mining
technique which is proven to be efficient in several
applications. The same set of data with same
distribution is applied to the decision tree for the
classification of hepatitis type.
The classification tree generated using the same
data is shown in Figure 1. The decision tree shown
in Figure 1 is a fully grown tree for the classification
of hepatitis type. One of the features of CART
method is that it generates complete tree depending
on the data. But this tree overfits on the given data.
The problem with the overfitting is that, after
learning that tree works well specifically for this
data but not with any other set of data because in
overfitting, it memorizes the data provided. So, if the
testing is performed using the dataset used for
training, high accuracy will be achieved, however, if
the data other than training data is used to test the
system then accuracy will be reduced much. To
overcome this problem, the method of tree pruning
is used in CART method. After tree pruning, the
tree becomes more generalized, which is shown in
Figure 2.
ICEIS2013-15thInternationalConferenceonEnterpriseInformationSystems
242
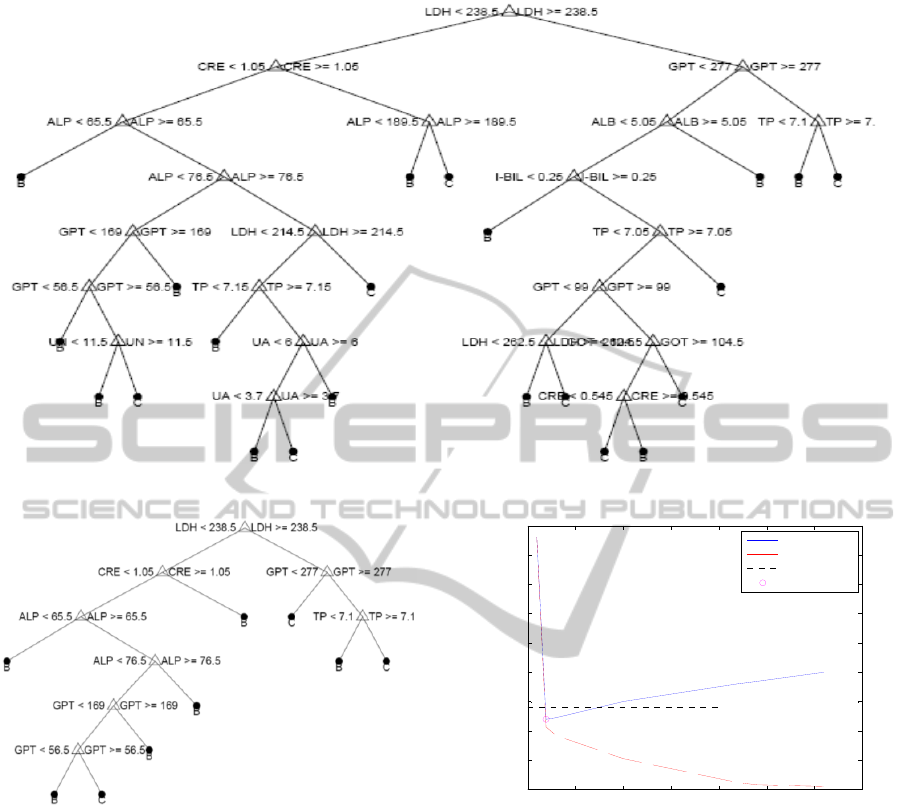
Figure 1: Full grown decision tree for classification of hepatitis type.
Figure 2: Pruned decision tree for the classification of
hepatitis types (B and C).
Figure 3 shows the cost of misclassification error
with increasing number of terminal nodes.
Resubstitution error is the proportion of original
observations that were misclassified. It is evident
that increasing number of terminal nodes decreases
the error. However, cross validation error which is a
measure of true error is decreasing up to certain
point then it starts increasing with increasing number
of nodes.
As a rule of thumb, level of tree pruning can be
determined by taking the simplest tree with one
standard error. But in our case, this thumb rule tree
selection results in a tree with very less amount of
nodes such that very few medical examinations had
been covered. So, rather using the thumb rule, we
prune the tree to a point where error is reduced and
Figure 3: Cost vs Number of terminal nodes analysis of
decision tree for the classification of hepatitis types (B and
C).
significant medical examinations have been
considered.
Table 3 summarizes the performance of
discriminant analysis and decision tree with and
without pruning. It is shown that decision tree for
the classification of hepatitis type is not as efficient
as the discriminant analysis technique. Possible
reason is that this classification is a simpler problem
then fibrosis and decision trees works efficient for
problems more complex than that. For a relatively
simpler problem like hepatitis type classification, the
tree is comparatively complex, hence performance is
reduced.
0 5 10 15 20 25 30 35
0.05
0.1
0.15
0.2
0.25
0.3
0.35
0.4
0.45
0.5
Number of terminal nodes
Cost (misclassification error)
Cross-validation
Resubstitution
Min + 1 std. err.
Best choice
ClassificationofHepatitisPatientsandFibrosisEvaluationusingDecisionTreesandLinearDiscriminantAnalysis
243
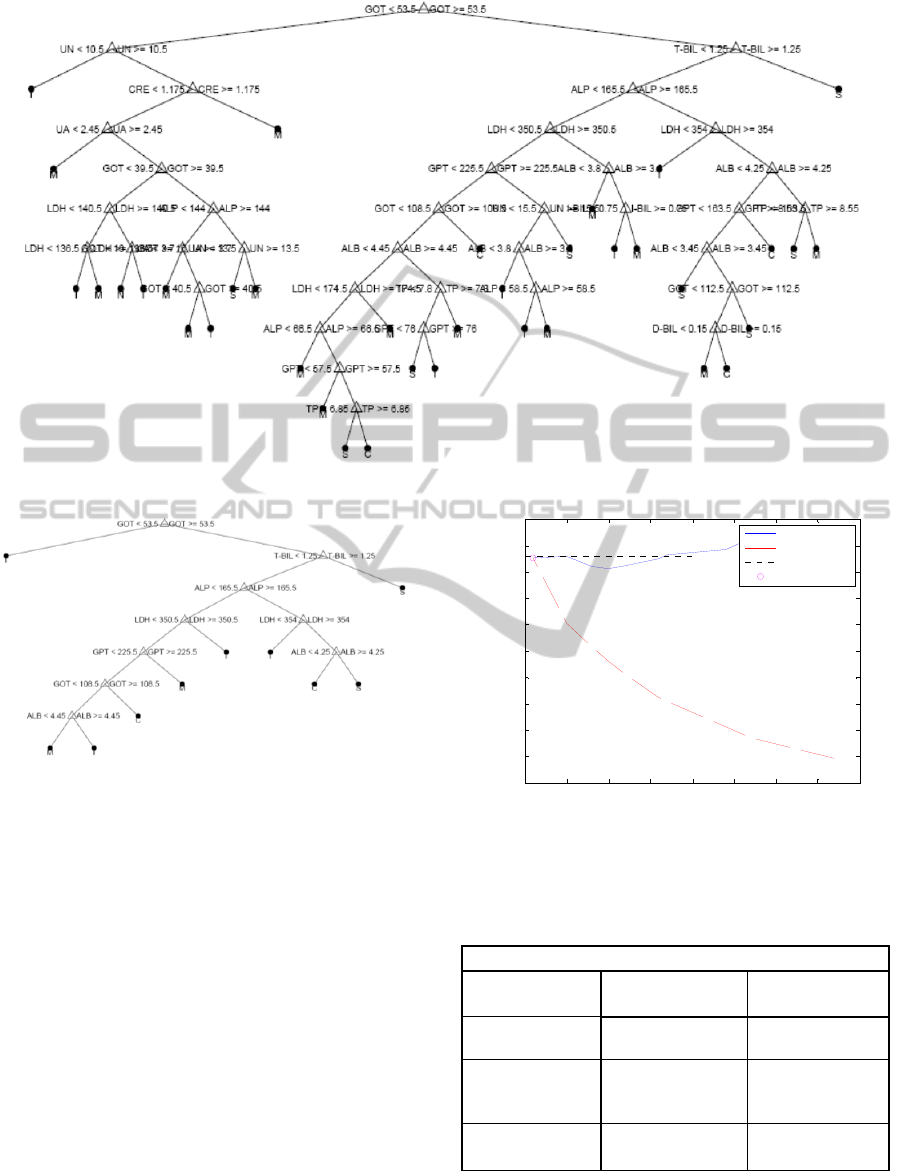
Figure 4: Fully grown decision tree for the classification of fibroses level.
Figure 5: Pruned decision tree for the classification of
fibrosis level.
Results show that the decision tree for the
classification of fibrosis degree (Figure 4 & 5) is
more efficient than that of discriminant analysis.
As mentioned above this tree overfits the data.
Figure 5 shows the pruned tree out of this fully
grown tree using the cost diagram shown in Figure
6. For tree pruning we followed the same approach
because again in the degree of fibrosis classification
tree the best prune choice results in very small tree.
So to make efficient use of patients’ medical
examination, we pruned decision tree on a level
where cross validation error is least and tree size is
also reasonable.
It is depicted that the resubstitution error and
cross validation error are both very low for linear
discriminant in the classification of hepatitis type.
However, in the fibrosis level classification, decision
tree performed well.
Figure 6: Cost vs number of terminal nodes for the
decision tree for the classification of fibrosis level.
Table 3: Resubstitution and cross validation error for
Hepatitis type classification.
Classification for Hepatitis Type
Resubstitution
Error
Cross
Validation Error
Discriminant
Analysis
0.003378378 0.1824
Decision Tree
(Without
pruning)
0.0405 0.25
Decision Tree
(With prunining
0.027 0.222972973
Finally, we addressed third challenge which is to
find out whether the interferon therapy is of any
affect or not. For this, the pruned decision tree is
0 5 10 15 20 25 30 35 40
0.2
0.25
0.3
0.35
0.4
0.45
0.5
0.55
0.6
0.65
Number of terminal nodes
Cost (misclassification error)
Cross-validation
Resubstitution
Min + 1 std. err.
Best choice
ICEIS2013-15thInternationalConferenceonEnterpriseInformationSystems
244
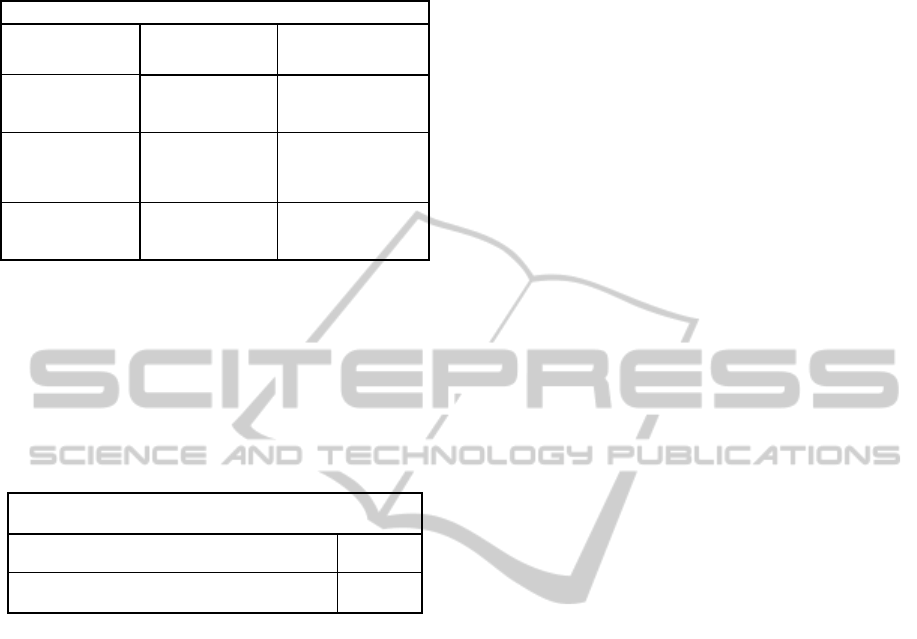
Table 4: Resubstitution and Cross validation Error for
classification of liver fibrosis level.
Classification for Liver Fibrosis Level
Resubstitution
Error
Cross Validation
Error
Discriminant
Analysis
0.0034 0.6182
Decision Tree
(Without
pruning)
0.0912 0.6014
Decision Tree
(With prunining
0.0878 0.5845
used to find out whether the fibroses level is
increased or decreased. It is observed using the data
that most of the patients who have taken interferon
therapy either improve or their degree of fibrosis
neither is increased nor decreased. Table 5 shows the
result.
Table 5: Effectiveness of Liver fibrosis analysis for
patients taken interferon therapy.
LiverFibrosis
Increased 6
Decreasedornoaffect 24
Effectiveness of interferon therapy is analysed on
30 patients out of whom the liver fibrosis of 6
patients is observed to be increased and rest of 24
patients either remain unaffected or their liver
fibrosis is decreased. In the light of this analysis, it
can be said that interferon therapy indeed has some
positive effects on the patients because even if not
reducing the degree of fibrosis, interferon therapy is
able to stop the increase of fibrosis thus helping the
patient to sustain longer.
6 CONCLUSIONS
In this paper, decision tree method is used to classify
the patient’s medical examination results to the type
of hepatitis and also the severity of liver fibrosis. It
is observed that the decision tree performs well for
the complex problems like the stage of liver fibrosis
and the results of decision tree out performed linear
discriminant classification. The decision trees
generated after learning the medical examination
results of patients are used to find the effectiveness
of interferon therapy taken by some of the patients.
It is observed that the interferon therapy is indeed
effective by either decreasing the level of fibrosis or
by not letting it to increase.
7 FUTURE WORK
In this paper, we have used decision tree and linear
discriminant analysis for the classification of
hepatitis B and C and to find out the fibrosis level of
the patients using the above mentioned techniques.
Furthermore, it is also determined that the interferon
therapy is effective on the patient or not. Both the
techniques belong to data mining. Our future plan is
to apply other machine learning techniques on this
data set, for example, neural network or support
vector machine. An interesting work would be to
design the machine learning methods such that it
might work with the time series data with missing
values, since in this paper, many medical
examination data have been discarded because the
same examination data are not present for other
patients.
Also, in this paper, only second and third
challenges posted by the Chiba University and
Hospital have been addressed. It would be worthier
if other challenges may also be addressed. It will be
a good future work to work on other challenges
specially the last one (EMCL/PKDD Discovery
Challenge, 2005).
The dataset used in this paper is indeed a large
amount of data. Only part of the data is used in the
present work. Using the data completely, will
hopefully unveil many aspects of the infections and
even its mode of action inside the body and it would
definitely be of greater medical importance.
REFERENCES
Aubrecht, P., Kejkula, M., 2005. Mining in Hepatitis Data
by LISp-Miner and SumatraTT, Proceedings of the
European Conference on Machine Learning and
Principles and practices for knowledge discovery in
databases (ECML/PKDD 2005), pp. 131 – 138,
Slovenia.
Bradford, D., Dore, G., Hoy, J., 2008. HIV, viral hepatitis
and STIs: a guide for primary care, Australasian
Society for HIV Medicine (ASHM) Publishing,
Darlinghurst, New South Wales, Australia, , ISBN
978-1-920773-50-2.
Durand N., Soulet, A., 2005. Emerging overlapping
clusters for characterizing the stage of liver fibrosis.
Proceedings of the European Conference on Machine
Learning and Principles and practices for knowledge
ClassificationofHepatitisPatientsandFibrosisEvaluationusingDecisionTreesandLinearDiscriminantAnalysis
245

discovery in databases (ECML/PKDD 2005), pp. 139
– 150, Slovenia.
ECML/PKDD Discovery Challenge, 2005. PKDD
Discovery Challenge Available from: http://
lisp.vse.cz/challenge/ecmlpkdd2005. [Accessed: 7th
August 2012]
Geamsakul, W., Matsuda, T., Yoshida, T., el al. 2007.
Analysis of Hepatitis Dataset by Decision Tree Based
on Graph-Based Induction. Lecture Notes in Computer
Science, Springer, Volume 3609, 2007, pp 5-28.
Ho, T. B., Nguyen, C. H., et al., 2007. Exploiting
Temporal Relations in Mining Hepatitis Data, Journal
of New Generation Computing, Springer, Vol. 25, No.
3, pp-247-262.
Karthikeyan, T., Thangaraju, P., 2013. Analysis of
Classification Algorithms applied to hepatitis patients,
International Journal of Computer Applications,
volume 62, no. 15, pp. 25-30.
Loh, W. Y., 2008. Classification and regression tree
methods. Encyclopaedia of Statistics in Quality and
Reliability, F. Ruggeri, R. Kenett, and F. W. Faltin
(Eds.), Wiley, pp. 315-323.
Pizzi, L. C., et al., 2005. Analysis of Hepatitis dataset
using multi-relational association rules. Proceedings
of the European Conference on Machine Learning and
Principles and practices for knowledge discovery in
databases (ECML/PKDD 2005), pp.161-167,
Slovenia.
Rolfes, P. K, Whitney, E., 2009. Understanding normal
and clinical nutrition, 8
th
edition, Belmont: West-
Wardsworth Publishing Company, ISBN 13-978-0-
495-55646-6.
Vatham, S. A., Osmani, A., 2005. Mining short sequential
patterns for hepatitis type detection. Proceedings of
the European Conference on Machine Learning and
Principles and practices for knowledge discovery in
databases (ECML/PKDD 2005), Slovenia.
Yaseen, H., Tahseen, A., Jilani, Danish, M., 2011.
Hepatitis-C Classification using Data Mining
Technique, International Journal of Computer
Applications (IJCA) Vol. 24, No. 3, pp.1-6.
ICEIS2013-15thInternationalConferenceonEnterpriseInformationSystems
246
