
Testware Visualized
Visual Support for Testware Reorganization
Artur Sosnówka
Faculty of Computer Science, West Pomeranian University of Technology, ul.Żołnierska 49, Szczecin, Poland
Keywords: Visualization Metaphor, Testware, Test City, Test Metrics, Test Management, Data Mining, Test Case
Visualization, Low Level Test Case, Test Selection.
Abstract: The majority of formal description for software testing in the industry is conducted at the system or
acceptance level, however most formal research has been focused on the unit level. This paper propose
formal test selection criteria for system or integration test based on visualization analysis for low level test
cases. Visual analysis for low level test case selection is to be based on inputs from available Test
Management system. Presented analysis criteria shows a subset of test metrics which has been used in pilot
projects in the industry as a base for testware reorganization.
1 INTRODUCTION
Software development is dealing with growing
complexity, shorter delivery times and current
progress made in the hardware technology. Within
the software lifecycle the biggest, however not
directly seen, part is the maintenance. Increasing
number of systems used in the corporation and
tolerated number of deviations is decreasing when
time progressing and users get trusted to the used
software. As soon as software is put in the
production environment, every big change or even
small adaption of the source code can cause
potential danger in best case, monetary, in worst
image or even human being loses. Nevertheless the
maintenance is very often provided during the whole
period through different groups of technicians or
business partners. This makes the task of
programming, understanding and maintaining of the
source code for the system and its testware more
complex and difficult.
To be successfully introduced each software
system requires properly defined requirements.
Those can and are very often changing during the
whole project or software lifecycle. The changes are
based on legal, business, functional or software
architectural needs (e.g. new programming
techniques). Required new functionality is gaining
focus and the old one is put aside and threatened to
not be as important as before. Testware
management, especially for the high (HLTC) and
low level test cases (LLTC) (ISTQB, ISTQB®
Glossary of Testing Terms, 2012), which are
focusing on old but still valid functionality keeps
going to be not affordable, or getting be forgotten by
purpose. The situation is causing raised maintenance
costs to the limit, when new development can
produce less cost and even be easier to implement
than creation of the new functionality within the old
system.
Required quality of the software is very often to
be reached through quality assurance activities on
several levels, starting from unit test, through
system, integration and ending on acceptance tests.
Artefacts produced during the test process required
to plan, design, and execute tests, such as
documentation, scripts, inputs, expected out-comes,
set-up and clear-up procedures, files, databases,
environment, and any additional software or utilities
used in testing are named, according to ISTQB,
testware (ISTQB, ISTQB® Glossary of Testing
Terms, 2012). Detection of the problems within a
testware can save much effort and reduce necessary
maintenance costs. Number of executed tests in the
first or second year of software maintenance is not
being a disruptive factor for the test projects. As
soon as software is coming into the last phase,
associated teams are very often moved to the other
development projects or taken out of the company
(e.g. consultants are being moved from customer to
customer). To prove necessary quality after
performed adaptations, growing complexity of the
109
Sosnówka A..
Testware Visualized - Visual Support for Testware Reorganization.
DOI: 10.5220/0004451001090114
In Proceedings of the 8th International Conference on Evaluation of Novel Approaches to Software Engineering (ENASE-2013), pages 109-114
ISBN: 978-989-8565-62-4
Copyright
c
2013 SCITEPRESS (Science and Technology Publications, Lda.)

system is demanding high professional skills and
understanding from people and organizations taken
over the responsibility for the system.
Software quality is according to IEEE definition:
1. The degree to which a system, component or
process meets specified requirements.
2. The degree to which a system, component or
process meets customer or user needs or
expectations (Dickinson, 2001).
Above given definition is obligating quality
assurance teams to perform planned and systematic
pattern of actions to provide adequate confidence to
the product or item that it conforms to established
technical requirements (Dickinson, 2001). Execution
of needed actions to provide at least same quality
during the whole maintenance phase is a big cost
factor. According to survey-analysis presented
during the iqnite 2011 conference in Düsseldorf,
almost 60% of the software projects are spending
between 20 and 30% of its budget on Quality
Management (QM) and testing activities. Right
handling of created artefacts is not a question of an
effort but a need for efficiency and effectiveness.
Especially big and complex systems are
providing large number of functions and demanding
even larger number of objects within the testware.
To provide 100% fulfilment the test team has to
ensure that each function is not affected through the
code adaptation and its site effects. Adaptation of the
system demands adaptation of testware to fulfil
quality requirement for the current system.
Even best managed testware, after few years of
usage, is not free of objects which are old, obsolete,
duplicated or there are no HLTCs or LLTCs
covering demanded functionality. Those objects are
causing additional management effort and its
existence does not increase expected quality needs.
Often developers and managers believe that a
required change is minor and attempt to accomplish
it as a quick fix. Insufficient planning, design,
impact analysis and testing may lead to increased
costs in the future. Over time successive quick fixes
may degrade or obscure the original design, making
modifications more difficult (IEEE, 1059-1993) and
finishing in not acceptable, low quality of the
system.
As long as we are accepting loose of the software
and testware quality, its transparency, increasing
maintenance costs, decreasing test efficiency,
continuous testware erosion is not a subject.
However, in time of financial crisis and decreasing
IT budgets, there is none of the project which can
come over this dilemma. In the next chapters we
would like to show results from pilot project which
has been executed in the industry in order to prove
usefulness for the approach of the visualization
metaphor for testware reorganization.
2 RELATED WORK
Since the early days of software visualization,
software has been visualized at various levels of
detail, from the module granularity seen in Rigi
(Muller et al., 1988) to the individual lines of code
depicted in SeeSoft (Eick et al., 1998)
The increase in computing power over the last 2
decades enabled the use of 3D metric-based
visualizations, which provides the means to explore
more realistic metaphors for software representation.
One such approach is poly cylinders (Marcus, A.,
2003), which makes use of the third dimension to
map more metrics. As opposed to this approach in
which the representations of the software artefacts
can be manipulated (i.e., moved around), our test
cities imply a clear sense of locality which helps in
viewer orientation. Moreover, our approach provides
an overview of the hierarchical (i.e., package, test
object) structure of the systems.
The value of a city metaphor for information
visualization is proven by papers which proposed the
idea, even without having an implementation.
(Santos et al., 2000) Proposed this idea for
visualizing information for network monitoring and
later (Panas et al., 2003) proposed a similar idea for
software production. Among the researchers who
actually implemented the city metaphor, (Knight and
Munro, 2000); (Charters et al., 2002); (Wettel and
Lanza, 2008) represented classes are districts and the
methods are buildings. Apart from the loss of
package information (i.e., the big picture), this
approach does not scale to the magnitude of today’s
software systems, because of its granularity.
The 3D visual approach closest in focus to ours
is (Langelier et al., 2005), which uses boxes to
depict classes and maps software metrics on their
height, colour and twist. The classes’ box
representations are laid out using either a modified
tree map layout or a sunburst layout, which split the
space according to the package structure of the
system. The authors address the detection of design
principles violations or anti-patterns by visually
correlating outlying properties of the
representations, e.g., a twisted and tall box
represents a class for which the two mapped metrics
have an extremely high value. Besides false
positives and negatives, the drawbacks of this
approach is that one needs different sets of metrics
ENASE2013-8thInternationalConferenceonEvaluationofNovelSoftwareApproachestoSoftwareEngineering
110

for each design anomaly and the number of metrics
needed for the detection oftentimes exceeds the
mapping limit of the representation (i.e., 3). The
detection strategies (Marinescu, 2004) were
introduced as a mechanism to formulate complex
rules using the composition of metrics-based filters,
and extended later (Lanza and Marinescu, 2006) by
formalizing the detection strategies and providing
aid in recovering from detected problems.
3 VISUALIZATION METAPHOR
A visualization metaphor is defined as a map
establishing the correspondence between concepts
and objects of the application under test and a
system of some similarities and analogies. This map
generates a set of views and a set of methods for
communication with visual objects in our case - test
cases (Huffaker et al., 2010).
Lev Manovich has said: “an important
innovation of computers is that they can transform
any media into another”. This gives us possibility to
create a new world of data art that the viewer will
find as interesting. It does not matter if the detail is
important to the author; the translation of raw data
into visual form gives a viewer possibility to get
information which is the most important just for
him. Hence, any type of visualization has specific
connotations, which may become metaphoric when
seen in context of a specific data source. Metaphor
in visualization works at the level of structure, it
compares the composition of a dataset to a particular
conceptual construct, and the choice of any
visualization is always a matter of interpretation.
Numerous currently existing visualization
systems are divided into three main classes:
Scientific visualization systems (Friendly, 2008);
Information visualization systems (González and
Kobsa, 2003);
Software visualization systems (Stasko and
Patterson, 1992).
Although all visualization systems differ in purposes
and implementation details, they do have something
common; they manipulate some visual model of the
abstract data and are translating this into a concrete
graphical representation.
In this paper we are not aiming to present all
possible visualization metaphors, as this is not the
focus for our research. We would like to show basic
and easy to understand “City metaphor” which is
helpful for representation specific test data and allow
easier test reorganization. After some of the previous
research work which is however not in focus of this
paper we settled our first attempt to the metaphor
which is very widely presented in (Richard Wettel,
2001) and is a part of his Phd (Richard Wettel,
2010). In its research and implementation for
software source code classes are represented as
buildings located in city districts which in turn
represent packages, because of the following
reasons:
A city, with its downtown area and its suburbs is a
familiar notion with a clear concept of orientation.
A city, especially a large one, is still an
intrinsically, complex construct and can only be
incrementally explored, in the same way that the
understanding of a complex system increases step
by step. Using an all too simple visual metaphor
(such as a large cube or sphere) does not do justice
to the complexity of a software system, and leads
to incorrect oversimplifications: Software is
complex; there is no way around this.
Classes are the cornerstone of the object-oriented
paradigm, and together with the packages they
reside in, the primary orientation point for
developers.
Figure 1: Example of “Software City” representation of
JBoss application server.
In our attempt we perform mapping between
available LLTC and its basic metrics to provide easy
to understand and manage overview about the
current state of testware.
3.1 Test Metrics
To be able to perform data visualization, defined set
of the static and dynamic data has to be prepared.
Based on the available information’s for LLTC we
can extract following basic metrics, which would be
used later for mapping:
Amount of LLTC
Execution status for available LLTC
Last modification date/age
Number of executions
TestwareVisualized-VisualSupportforTestwareReorganization
111

Number of steps
Description length
Execution cost
Complexity
Risk
Priority
Dependent on the metrics type, those are to be taken
as a data export through the available API from the
test management tool or statistical data taken from
the support or test organization.
Fetched metric can be mapped into the chosen
visualization metaphor as:
Data physical properties (colour, geometry, height
mapping, abstract shapes)
Data granularity (unit cubes, building border or
urban block related)
Effect of Z axis mappings on the image of the city
Abstraction of data and LOD are key issues
Resulting "data compatible" urban models are
much larger than the original VR urban models.
4 TEST REORGANIZATION
AND TEST MINING
In this paper we would like to show how useful can
be usage of visualization based on the “Test City”
metaphor. We would like to show how to perform
test reorganization based on the very basic set of
metrics available in the test project.
For our experimental work we have established a
new system interacting with several Test
Management applications placed on the market. The
base idea of the system is an automation extraction
and pre-evaluation of several different test metrics.
Those metric are imported via available API
connections from the Test Management tool and
evaluated to get required set of metrics. The test
metrics are provided as a text file, e.g. CSV (Comma
Separated Values), and imported into visualization
framework. Visualization framework allows us
performing necessary analysis. The analysis result is
taken as an input to the Test Management tool for
Test-Set creation and evaluation.
Within our research for three test projects that
contains over 4000 LLTC each, we have performed
analysis for basic and extended test metrics. Those
projects have been running independently with large
number of common requirements. This allows us to
gain information’s which are valuable to prove our
concept and create inputs for further work on
possible visualization usage in test management
domain.
Visualization results for one of those test projects
with testware structure shown in the tables 1 and 2
are shown in the Figure 2 and 4. Parameters have
been based on following test metrics:
1. Test execution age mapped to the colour.
2. Number of executions mapped to the height.
3. Number of steps mapped to size.
Figure 2: Test City based on LLTC for Test Project.
To provide real reference to the analysed testware,
the districts (as a square group) of the Test City are
mapped to the structure created by test teams and
managed with help of the Test Management system
(e.g. Test folder or Test object).
Looking at the possible analysis for testware
visualization according to the Figure 3 we can
provide following input for the improvements:
1. There is a large number of old LLTC which has
been executed later than threshold set to 3000
days (red buildings – left circle in the Figure 2).
Most of them had a small height which gives as
an information about low number of executions.
Those LLTC shall be either archived, or
completely removed from the Testware. LLTC
not executed for longer than 9 years and rarely
executed is with very high probability obsolete.
2. In the middle top, there is a circle pointing to
some amount of LLTCs which has to be taken
under closer investigation (yellow buildings).
Execution or those objects has been done in the
range of 400 to 3000 days in the past. Based on
the height we can assume, most of them are
obsolete; however moving to the archive is better
option than leaving them within the testware.
3. Circle on the right side of the Figure 2 shows us
area which has been most likely commonly used
in the last 400 days. Large number of high and
green buildings allows us to assume area of
regression tests. Those LLTC has been used in
the last period to assure certain quality of the
product and shall not be moved to the archive or
adapted within the first phase for testware
reorganization.
ENASE2013-8thInternationalConferenceonEvaluationofNovelSoftwareApproachestoSoftwareEngineering
112
Below, the tables shows the visualized artefacts in
numbers.
Table 1: Testware quantity for given Test project.
Object type Quantity
LLTC 18473
Executions 38128
Table 2: Testware – quantity structure.
Number of executions LLTC (%)
0 11519 62,36
1 ... 10 5995 32,45
10 … 30 584 3,16
31 … 1000 439 2,38
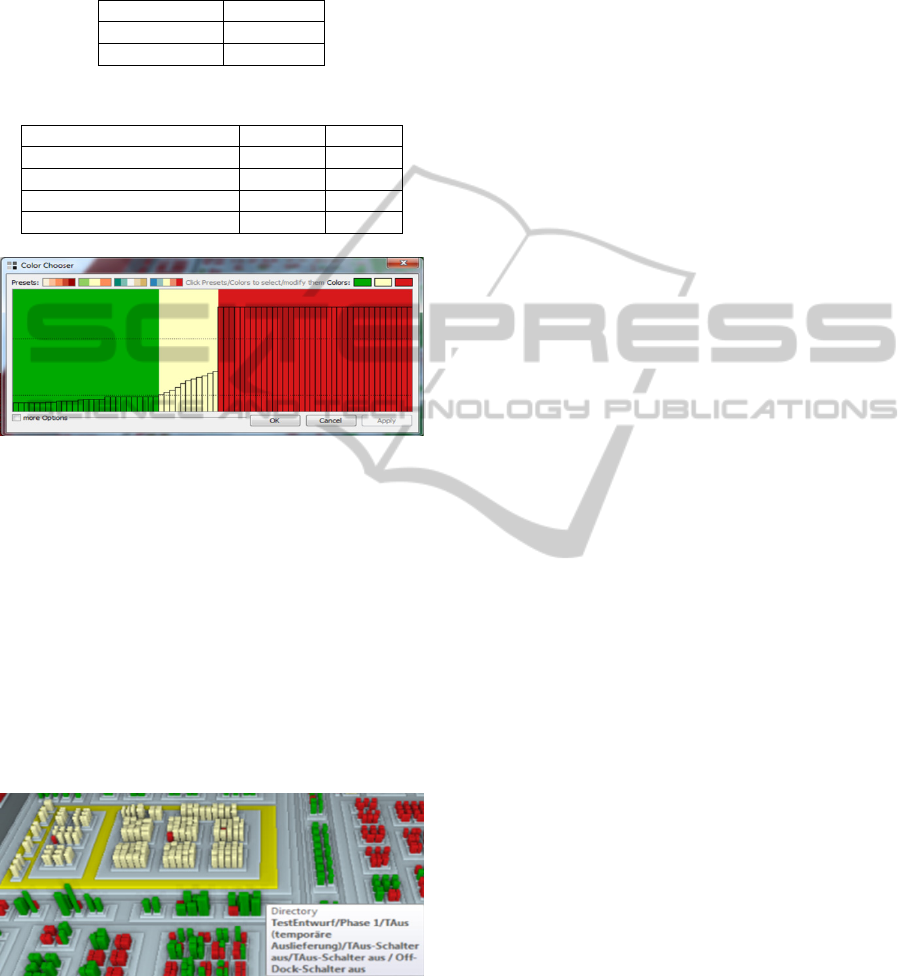
Figure 3: Testware characteristics, looking at LLTC
execution age.
Figure 3 shows testware characteristics for LLTC
last executions as follows:
green 1..380 days (~30%)
yellow 400… 3300 days (~15%)
red 3300 days (~55%)
Using a visualization to show up hotspot without
possibility to localize exact coordinates cannot be
used in further reorganization process. In order to
localize objects within the testware we are focusing
the interesting area with help of built in zoom
function. Please see Figure 4 for an example.
Figure 4: Zoom for LLTCs executed between 400 and
3000 days in the past.
Without having a deep knowledge about the current
testware and objects details we can provide the test
managers with exact information regarding that
LLTCs. Currently used metrics are very basic but
are giving very good start for testware
reorganization and have been taken as a feedback for
involved test managers.
5 FEEDBACK
FROM TESTMANAGERS
Created results have been presented to the involved
Test managers and their feedback has been checked.
Following results has been achieved:
There is no false positives, all ugly layouts
represents real problems
No false negatives, no beauty layout should be
ugly
Unique global overview on the testware landscape
Identify of hotspots (“there was always a
question”)
Identify cluster of issues (e.g. regression test)
Identify cluster of stagnation
The feedback has proven our first impression we got
by looking at the testware visual representation.
Even if the system looks well-organized, in spite of
the numerous disharmonious artefacts: we see a
districts, where the test which were executed more
than 365 days ago are localized and districts of
increased number of high building, even
skyscrapers, in which several very important and
common tests are defined.
The skyscrapers are giving us the impression
how many of existing LLTC have been executed
very often. Their colour shows execution age as an
important factor for testware reorganization.
Within very short time we were able to locate
and show large number of obsolete and suspicious
LLTCs. Identified hotspots and pain points based on
very basic test metrics has been confirmed by the
personal working for longer time with the testware,
even without our deeper knowledge for the system
itself. Necessary data for LLTC adaptation and/or
reorganization has been exported based on zooming
information at interesting areas/districts given to the
test managers and used for next iteration.
6 CONCLUSIONS
Test case management, test analysis and test creation
are the most important tasks within the whole test
management process. It is very hard to concentrate
the analysis on small set of the LLTC as it is not
getting potential win against the requirement
TestwareVisualized-VisualSupportforTestwareReorganization
113

spectrum. Possible loss of testware quality can be
threated only as additional cost factor and each
activity steering against is helping to keep those on
needed level. Performed visualization has shown us,
how easy in use and efficient can be presented
method for testware analysis. Finding an obsolete
LLTC based on available metrics is very
comfortable and does not require deep system
knowledge, even if analysed system seems to be
very complex. Getting the fast overview about large
number of LLTCs without deep knowledge of
testware saves needed time, resources and allows
problem presentation not only on technical but as
well on management level. Presented results have
been used for further deeper analysis and
reorganization activities.
Additionally we have observed person
performing analysis is tending to point its view on
maximum two metrics in time and not searching for
further information on the third one. This behaviour
was partly driven via visualization framework and
its available mapping attributes and partly human
laziness.
Our future directions will focus on the points
listed below:
1. Extension for more APIs to Test Management
tools available on the market.
2. Comparison for analysis outcome when using
same metrics but different Visualization
Metaphors.
3. Visualization for metrics within the timeline.
4. Extend number of evaluated metrics, especially
to find out duplicate tests..
REFERENCES
Charters, S. M., Knight, C., Thomas, N., Munro, S., 2002:
Visualisation for informed decision making; from code
to components. In Proceedings of SEKE 2002, 765–
772, ACM Press.
Dickinson, W., 2001, The Application of Cluster Filtering
to operational testing of Software. Doctoral
dissertation. Case Western Reserve University.
Eick, S., Graves, T., Karr, A., Marron, J., Mockus, S.,
1998: Does code decay? Assessing the evidence from
change management data. IEEE Transactions on
Software Engineering 27, 1, 1–12.
Friendly, M., 2008, Milestones in the history of thematic
cartography, statistical graphics, and data
visualization, http://www.math.yorku.ca/SCS/Gallery/
milestone/milestone.pdf
González, V., Kobsa, A., 2003, Benefits of Information
Visualization Systems for Administrative Data Analysts,
Proceedings. Seventh International Conference, 331-
336, Information Visualization, IV 2003.
Huffaker, B., Hyun, Z., Luckie, M., 2010, IPv4 and IPv6
AS Core: Visualizing IPv4 and IPv6 Internet Topology
at a Macroscopic Scale in 2010,
http://www.caida.org/research/topology/as_core_netw
ork/
IEEE, 1059-1993 - IEEE Guide for Software Verification
and Validation Plans, http://standards.ieee.org/
findstds/standard/1059-1993.htm
ISTQB, ISTQB® Glossary of Testing Terms, 2012,
http://www.istqb.org/downloads/finish/20/101.html
Knight, C., Munro, M. C. S., 2000: Virtual but visible
software. 2000 IEEE Conference on Information
Visualization, 198–205 , IEEE CS Press.
Langelier, G., Sahraoui, H. A., Poulin, P. S., 2005:
Visualization-based analysis of quality for large-scale
software systems. In Proceedings of ASE 2005, 214–
223, ACM Press.
Lanza, M., Marinescu, R. S., 2006:. Object-Oriented
Metrics in Practice. Springer
Marcus, A., Feng, L., Maletic, J. I., 2003: 3d
representations for software visualization. In
Proceedings of SoftVis 2003, 27–36, ACM Press.
Marinescu, R. S, 2004: Detection strategies: Metrics-
based rules for detecting design flaws. In Proceedings
of ICSM 2004, 350–359, IEEE CS Press
Muller, H., and Klashinsky, S., Rigi, 1988: a system for
programming-in-the-large. In Proceedings of ICSE
1988, 80–86, ACM Press.
Panas, T., Berrigan, R., and Grundy, J. S., 2003: A 3d
metaphor for software production visualization. IV
2003 - International Conference on Computer
Visualization and Graphics Applications, 314, IEEE
CS Press.
Santos, C. R. D., Gros, P., Abel, P., Loisel, D., Trichaud,
N., and Paris, J. P. S., 2000: Mapping information
onto 3d virtual worlds. In Proceedings of the IV
International Conference on In-formation
Visualization 2000, 379–386.
Stasko, J.T., Patterson, C., 1992, Understanding and
characterizing software visualization systems,
Proceedings., 1992 IEEE Workshop, 3 – 10.
Wettel, R., 2010, Software Systems as Cities, Doctoral
Dissertation, Faculty of Informatics of the Università
della Svizzera Italiana
Wettel, R., Lanza, M., 2008: Visually Localizing Design
Problems with Disharmony Maps, SoftVis '08
Proceedings of the 4th ACM symposium on Software
visualization, ACM Press.
ENASE2013-8thInternationalConferenceonEvaluationofNovelSoftwareApproachestoSoftwareEngineering
114
