
Simulation of Collision Avoidance by Considering Potential Area
of Water for Maneuvering based on MMG Model and AIS Data
I. Putu Sindhu Asmara
1,2
, Eiichi Kobayashi
1
and Trika Pitana
3
1
Graduate School of Maritime Sciences, Kobe University, 5-1-1 Fukae-Minami Higashinada, Kobe, Japan
2
Department of Shipbuilding and Naval Architecture, Surabaya Shipbuilding State Polytechnic, Surabaya, Indonesia
3
Department of Marine Engineering, Institut Teknologi Sepuluh Nopember, Surabaya, Indonesia
Keywords: Collision Avoidance, PAW for Maneuvering, Ship Maneuverability, MMG Model, AIS Data.
Abstract: A vessel should follow a planned route. However, when a target ship deviates from its original track, the
subject ship should maneuver to avoid a ship-to-ship collision. This paper presents a trial maneuver-based
method for collision avoidance that considers the potential area of water (PAW) for maneuvering that is
available to the target ship. The initial conditions, including the position, speed, rudder angle, drift angle,
and yaw rate of the target ship, are derived from automatic identification system (AIS) data. AIS data from
Madura Strait were used to simulate collision avoidance. The PAW of the target ship was predicted based
on a probability distribution of the initial conditions using a mathematical maneuvering group (MMG)
model. Finally, a trial maneuver method for the subject ship was simulated to avoid a ship-to-ship collision.
The MMG model for the simulation was developed to consider the effects of shallow water and wind and
current disturbances.
1 INTRODUCTION
The potential area of water (PAW) for maneuvering
is defined as the water area that can be used before a
ship’s movement is completed if the navigator
encounters an emergency, such as the need to
perform a crash astern (Inoue, 1990). The PAW was
originally developed by superimposing ship paths
predicted by a ship navigating simulator. These ship
paths resulted from variations in the times needed
for a crash astern.
In this study, the PAW was developed based on
the variation in time needed to take action and by
considering the uncertainty in ship maneuverability
caused by the probability distribution of the initial
conditions. The probability distribution of the ship
maneuverability in terms of ship advancement is
significantly affected by the probability distributions
of the initial yaw rate and drift angle (Asmara et al.,
2012). The PAW of the target ship was predicted
based on initial conditions derived from automatic
identification system (AIS) data. The maneuvers of a
subject ship were simulated to restrict the PAW
when trying to avoid a ship-to-ship collision. A trial
maneuver-based method using a mathematical
maneuvering group (MMG) model was simulated
for collision avoidance.
The MMG model was developed by considering
the effects of shallow water, wind forces and
moment, and current. A Monte Carlo algorithm was
developed for the MMG model to randomize the
initial ship conditions based on the distribution
derived from the AIS data.
AIS data for the Madura Strait were taken from a
server in a laboratory at ITS, Indonesia. The
Surabaya canal in the strait is the most important
fairway located between Java and the Madura
Islands. Tanjung Perak Port, which is located in the
strait, plays an important role in domestic and
international trading. A new port in Lamong Bay
near Tanjung Perak is being developed in
anticipation of an increase in the number of ship
calls.
A subject ship exiting the new port in Lamong
Bay was simulated to avoid collision with a target
ship entering Tanjung Perak Port. Maneuvering
parameters were proposed for ships to enter and exit
the port area based on the PAW for maneuvering.
Figure 1 shows the positions in the port area.
243
Putu Sindhu Asmara I., Kobayashi E. and Pitana T..
Simulation of Collision Avoidance by Considering Potential Area of Water for Maneuvering based on MMG Model and AIS Data.
DOI: 10.5220/0004478002430250
In Proceedings of the 3rd International Conference on Simulation and Modeling Methodologies, Technologies and Applications (SIMULTECH-2013),
pages 243-250
ISBN: 978-989-8565-69-3
Copyright
c
2013 SCITEPRESS (Science and Technology Publications, Lda.)
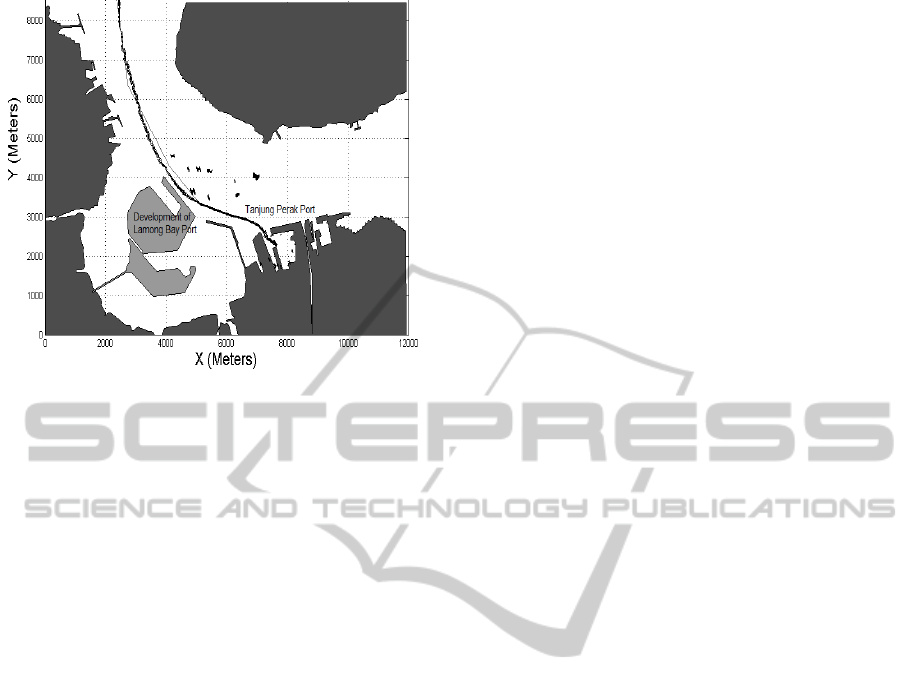
Figure 1: Area of Lamong Bay Port.
Figure 1 shows a target ship entering Tanjung Perak.
The ship deviates from the passage to avoid
collisions with vessels anchored out of the
anchorage zones. This paper proposes a method for
analyzing the maneuvering safety in a port area.
2 LITERATURE REVIEW
The distance to the closest point of approach
(DCPA) and time to reach the point (TCPA) are
generally used in collision risk assessment and
collision avoidance systems. Szlapczynski (2006)
introduced the approach factor f as a new measure of
collision risk that considers the courses of both ships
and can be used for any type of ship domain. Wang
et al. (2009) proposed mathematical descriptions for
each type of ship domain.
The minimum distance to a collision (MDTC) is
simulated based on the position, course, speed, and
maneuverability of ships to develop a quantitative
assessment of marine traffic safety (Montewka et al.,
2009). The effects of external disturbances and the
possibility of a crash astern are not considered in the
simulation.
Fujiwara et al. (2001) developed a method to
estimate the wind forces and moments acting on a
ship. They developed a linear multiple regression
model based on experimental results for ships built
after Isherwood and Yamano’s experiment in the
1970s.
Terada (2009) developed a method to estimate
the maneuverability of a ship under an external
disturbance using a linear maneuvering model; the
estimated ship trajectory is compared with that of
the nonlinear maneuvering of an MMG model.
Kobayashi (1995) developed an MMG model to
evaluate ship maneuverability in shallow water.
Soda et al. (2012) numerically simulated the
weather and ocean in a bay by using the Princeton
oceanography model for tidal currents, a fifth-
generation mesoscale model for the wind over the
sea, and simulated waves in Osaka Bay for research
on ship navigation. They used the MMG model to
estimate the ship positions in the simulations.
Xia et al. (2006) investigated the ability of a
small ship to sail on a planned route by studying
navigation simulation in coastal water. The
navigation simulation results based on an MMG
model were compared with the results of onboard
experiments.
Inoue and Usui (1998) systematically analyzed
the difficulty of maneuvering a ship between
anchored ships by using an environmental stress
model; the arrangement of the anchorages was
designed based on the allowable level of difficulty
for mariners.
Zhuo et al. (2008) used the MMG model for trial
maneuvers to develop a ship-based intelligent anti-
collision decision-making support system. This
system assumes that the AIS is installed onboard,
and an offline adaptive neuro-fuzzy inference
system is used to obtain the time to take action for
ship-to-ship collision avoidance. The time to take
action and the angle between the original and new
courses are determined.
Tsou et al. (2010) did not use an MMG model
when studying ship collision avoidance. An ant
colony algorithm was implemented on a GIS
platform to provide collision avoidance route
planning.
In this study, a trial maneuver-based collision
avoidance method was developed based on the
uncertainty of the PAW. The safe distance was
determined based on the uncertainty of the
maneuverability expressed by the PAW. A
simulation was developed using an MMG model that
considers the effects of shallow water and wind and
current disturbances.
3 MMG MODEL
The MMG model was developed based on a
practical simulation system to evaluate ship
maneuverability in shallow water (Kobayashi,
1995). The coordinate system is shown in Figure 2.
The effect of shallow water on ship maneuverability
is calculated based on Equations 1–5 (Kobayashi,
SIMULTECH2013-3rdInternationalConferenceonSimulationandModelingMethodologies,Technologiesand
Applications
244
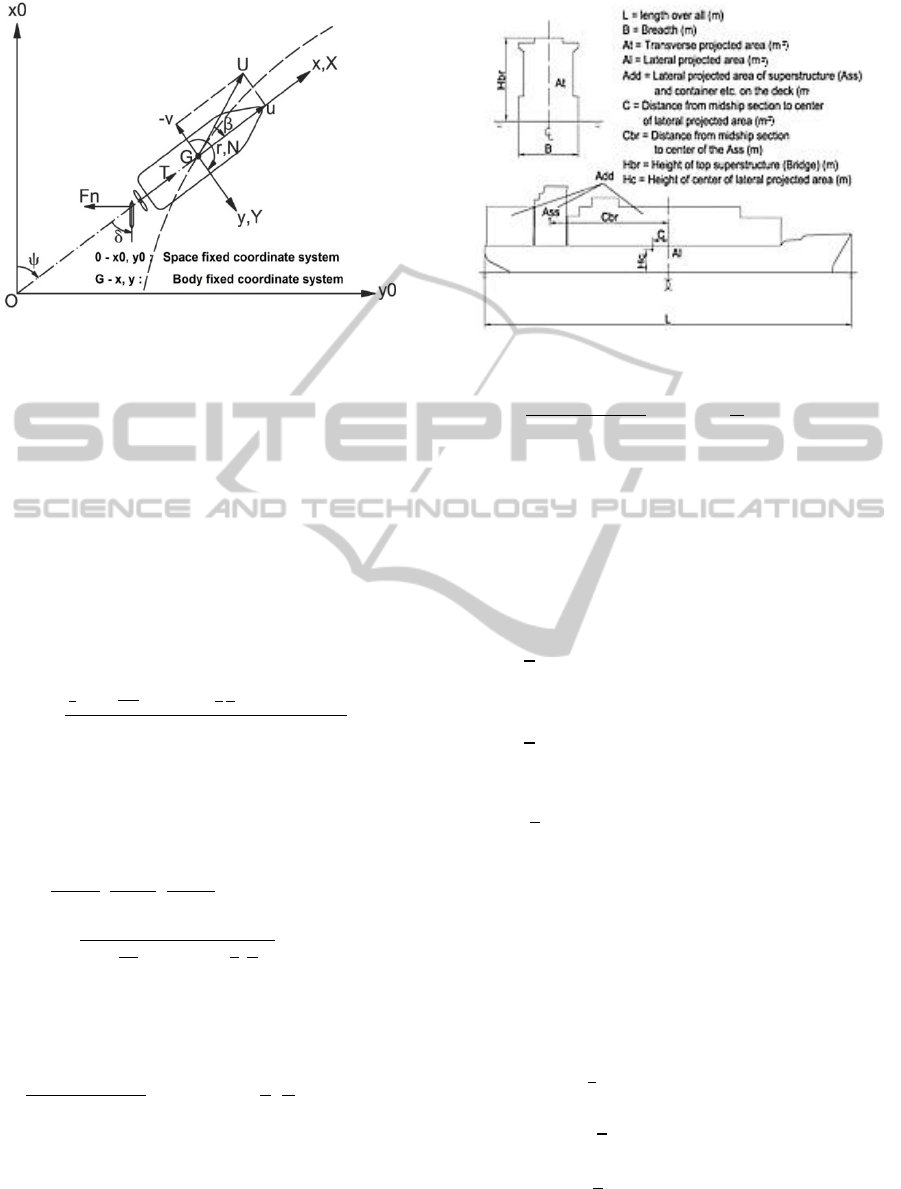
Figure 2: Coordinate system.
1995). The effect of shallow water on ship
maneuverability is calculated based on Equations 1–
5 (Kobayashi, 1995). The hull resistance in shallow
water is corrected based on the Millward formula, as
shown in Equation 1.
0.644d/H
.
(1)
where
and
are resistance form factors in deep
and shallow waters, respectively, and H is the water
depth.
Linear swaying derivative
is refined according
to Equation 2 as follows.
1⁄
2
⁄
2
⁄⁄
(2)
where k = 2d/L is the aspect ratio, Cb is the block
coefficient, B is the width of the ship, and p is equal
to 1.4 (Yoshimura and Masumoto, 2012). Other
linear derivatives are expressed in Equation 3.
,
,
,.
1
1⁄
(3)
where q1 = 3, q2 = 1.4 for
, q2 = 1.2 for
, and
q2 = 0.5 for
. The added mass and added mass
moment of inertia are corrected using Equation 4.
1
π
2
(4)
where q3 = 0.21 and q4 = 1.2 for m' + my', and q3 =
0.15 and q4 = 1.2 for Izz' + Jzz'. The effect of
shallow water on other coefficients such as
,
, and κ is expressed by Equation 5.
Figure 3: Variables of wind forces and moment.
1
(5)
where q5 = 1.4 and q6 = 3 for fv
′
l
′
r
′
fv
′
l
′
r
′
, q5 = 0.8 and q6 = 3 for ε, and q5 = –1.2 and
q6 = 3 for κ.
The effect of wind on ship maneuvering is
calculated in the mmg model based on the estimated
wind forces and moment, as expressed by equations
6–8 (fujiwara et al., 2001).
1
2
3
5
(6)
1
2
3
5
(7)
N
1
2
2
3
(8)
where ρ
air
is the density of air, Uw is the velocity of
wind, L is the length overall (LOA) of the ship, is
the attack angle,
is the transverse projected area,
and
is the lateral projected area. Other parameters
are determined using regression equations based on
the variables described in Figure 3.
Current forces and moment are calculated
according to Equations 9–11 (Wichers, 1988).
X
ρdL.U
.C
ψ
(9)
1
2
ρ.
.
(10)
N
1
2
ρ
.
.
(11)
where ρ is the density of water, d is the ship draft, L
SimulationofCollisionAvoidancebyConsideringPotentialAreaofWaterforManeuveringbasedonMMGModeland
AISData
245
is the LOA of the ship, and
is the relative current
velocity. The hydrodynamic coefficients of
,
, and
are calculated based on other
studies (Leite et al., 1998, and Souza and Fernandes,
2005), where
,
is the attack
angle of the current.
4 AIS DATA
The AIS data were obtained from an AIS receiver
installed at the Institut Teknologi Sepuluh
Nopember, Indonesia. The installation was
performed with the cooperation of Kobe University,
Japan.
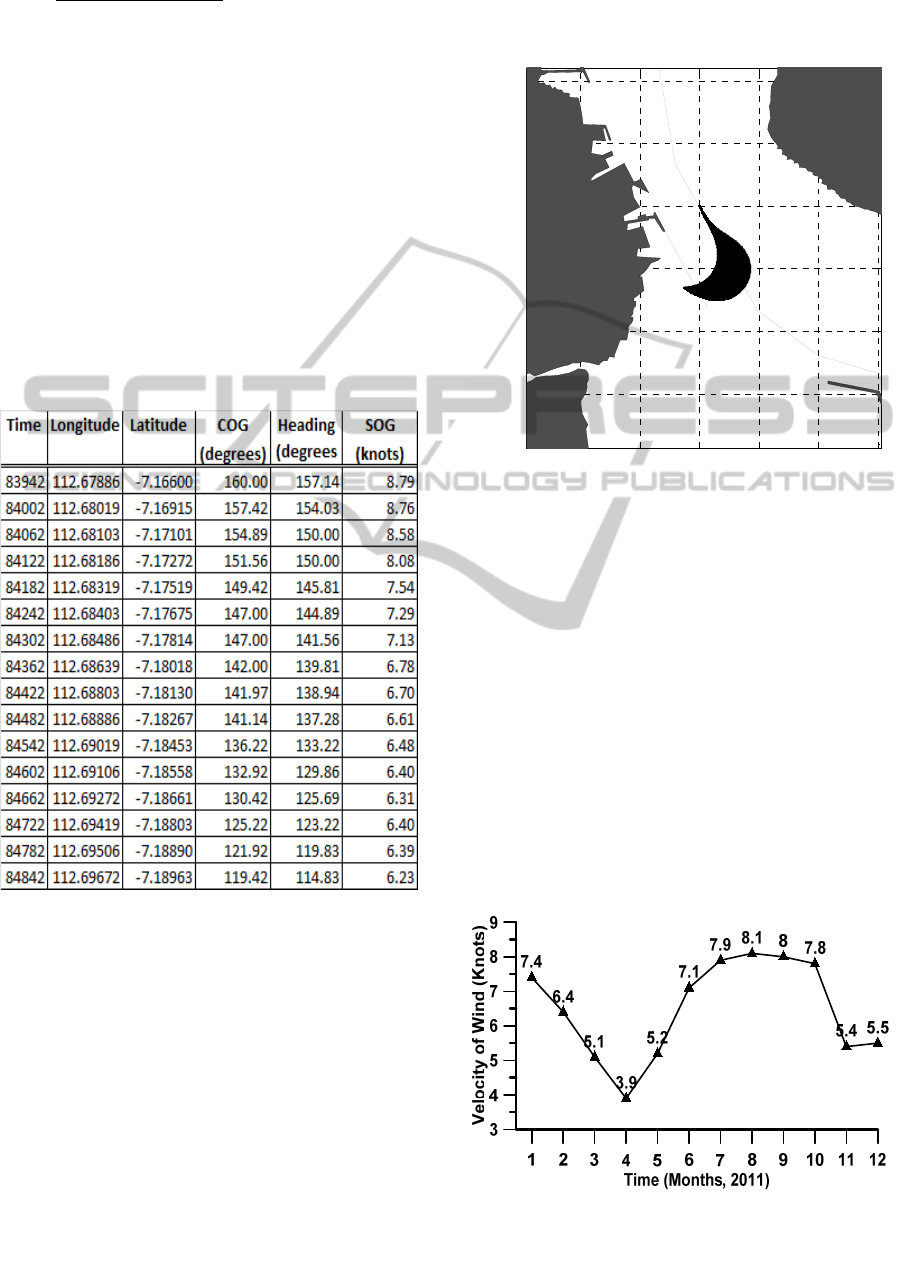
Table 1: AIS data of target ship, MMSI 370017000.
The longitude and latitude position, speed on the
ground (SOG), and course on the ground (COG) of a
target ship based on AIS data from 2300 to midnight
on January 1, 2011, are presented in Table 1. The
AIS data presented in Table 1 were synchronized
using the interpolation method. The initial time of
83942 in the table indicates a time of 23:19:02. The
data were selected for a 15-min voyaging period,
starting from the north side of the anchorage area.
At the same time, a simulated subject ship
exiting the new port in Lamong Bay was assumed to
have similar characteristics as the target ship. Based
on the AIS data, the PAW of the target ship was
predicted in the MMG model. Figure 4 shows an
example of the PAW for turning without considering
the effect of shallow water or wind and current
disturbances.
Figure 4: Potential area of water for turning (Asmara et al.,
2012).
5 ENVIRONMENT
Figure 5 shows data pertaining to the average wind
speed in 2011. The data were taken from the
maritime climatology station in Tanjung Perak. In
the rainy season (October–April), the prevailing
wind direction in the area is from the west. The most
extreme wind velocity of 55 knots occurred in June
1985. Based on data from the maritime climatology
station, the tidal height when the subject ship entered
the port was 0.3 m, as shown in Figure 6. The
maximum tidal height in 2011 was 1.3 m, whereas
the minimum tidal height was –1.4 m.
Figure 5: Velocity of wind in Tanjung Perak area.
-2000 -1000 0 1000 2000 3000
-3000
-2000
-1000
0
1000
2000
y0 (Meters)
x0 (Meters)
SIMULTECH2013-3rdInternationalConferenceonSimulationandModelingMethodologies,Technologiesand
Applications
246
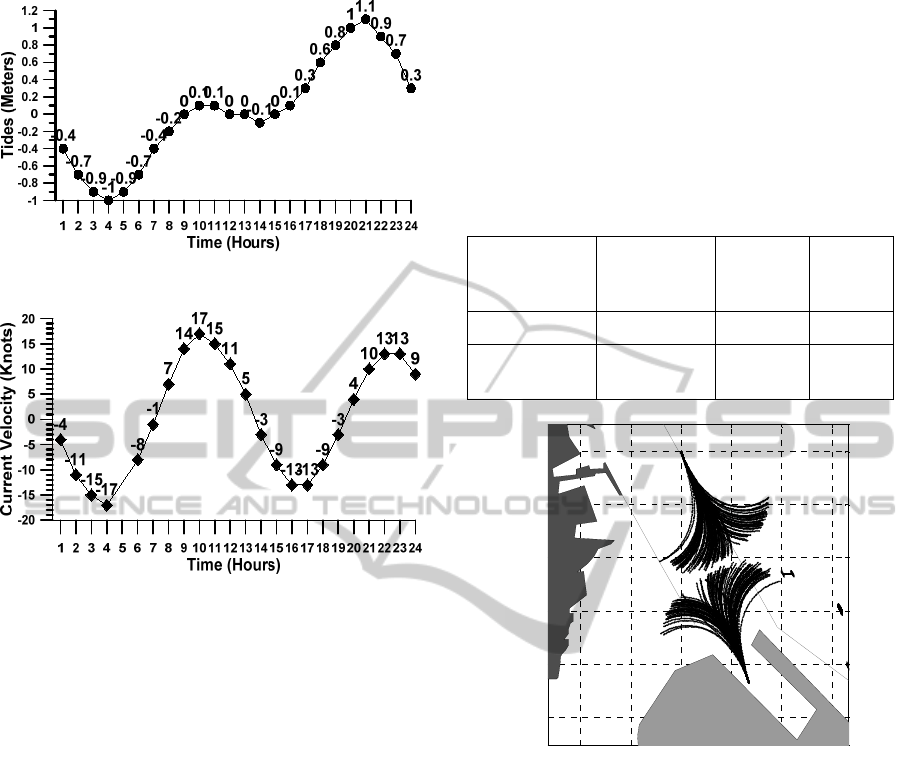
Figure 6: Height of tides in Tanjung Perak area.
Figure 7: Velocity of current in Tanjung Perak area.
Data for the current velocity on January 1, 2011,
were derived from the tidal stream table for the
Indonesian archipelago, as shown in Figure 7. The
direction of the current out of the channel (0°) to the
Java Sea is represented by a positive sign. In
contrast, the current direction toward the port area
(180°) is represented using a negative sign. The
maximum current velocities in 2011 occurred in
March and April with magnitudes of 21 and –21
knots, respectively.
6 METHODS AND RESULTS
The rudder angle of the target ship entering the port
area was predicted using a linear maneuvering
model. The method was proposed as an attempt to
predict maneuvering indices using AIS (Nakano and
Hasegawa, 2012). The K′ and T′ correlations
(Kobayashi, 1978) were used to implement the
method. The results of this method are shown as a
normal distribution of the rudder angle with a mean
of -0.11° and standard deviation of 0.33.
Table 2 lists the distributions of the rudder angle,
yaw rate, and drift angle of the target ship expressed
as normal distributions. By randomizing the initial
conditions of the ship for those variables, the PAW
was developed and treated as an obstacle for a
subject ship. The PAW of the target ship is shown in
Figure 8. The PAW was also developed for the
subject ship. In this simulation, the subject ship was
assumed to have the same principle dimensions as
the target ship.
Table 2: Distributions of rudder angle, yaw rate, and drift
angle.
Parameters of
Normal
Distributions
Rudder
Angle (rad)
Yaw Rate
(rad/s)
Drift
Angle
(rad)
Mean -0.00192 -0.00016 0.02
Standard
Deviation
0.00576 0.0012 0.12
Figure 8: PAW of subject ship and target ship with initial
speed of 3 knots.
Figure 9 shows the method used to consider the
PAW in collision avoidance. The PAW of the target
ship was considered an additional obstacle. The
maneuvering parameters of the subject ship were
simulated to avoid the PAW of the target ship.
Figure 10 shows a simulation of the subject ship
exiting from Lamong Bay. The ship tried to
determine a route out of the danger areas indicated
by red lines; these include the PAW of the target
ship and shallow water areas.
The initial heading angle of the target ship was
270° to allow it to face the wind force from the west
direction and current force from the south direction.
Figure 11 shows the time series of heading angles.
To obtain the route, rudder angles and propeller
revolutions were simulated under the criterion of
-1000 -500 0 500 1000 1500
-2500
-2000
-1500
-1000
-500
0
y0 (Meters)
x0 (Meters)
SimulationofCollisionAvoidancebyConsideringPotentialAreaofWaterforManeuveringbasedonMMGModeland
AISData
247
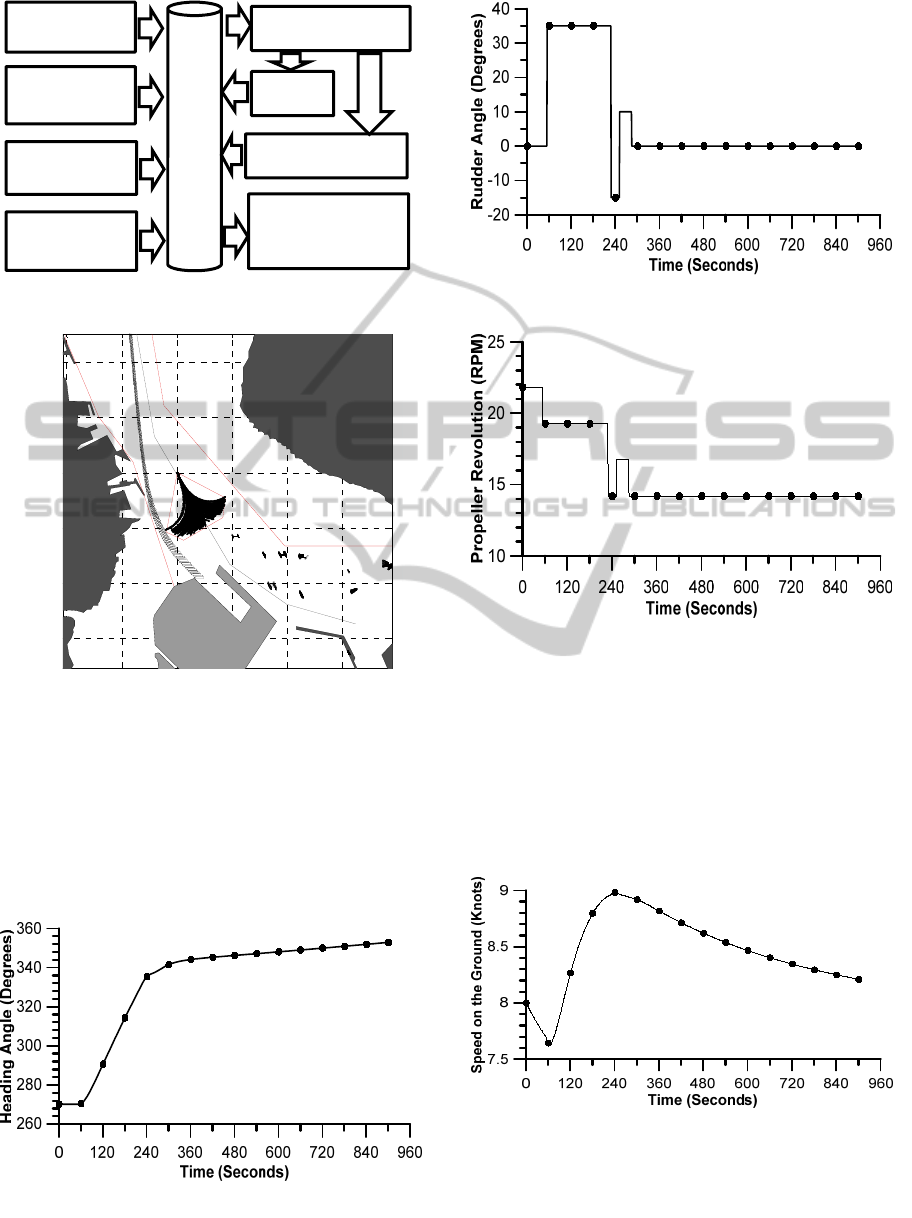
Figure 9: PAW-based collision avoidance method.
Figure 10: Collision and grounding avoidance for
wind and current disturbances.
minimizing the emergency levels (ELs). The method
to calculate the shortest distance of obstacle, shortest
stopping time (SST), time to collision (TTC), and
ELs are described in another paper (Asmara, et al.,
2013).
Figure 11: Time series of heading angle.
Figure 12: Time series of rudder angle.
Figure 13: Time series of propeller revolution.
Figures 12 and 13 show the time series of the rudder
angle and propeller revolutions. Figure 12 shows
that, 60 s from the initial position, the subject ships
should take the maximum rudder angle of 35° for a
right turn to avoid grounding in shallow water. To
avoid collision with the target ship in the danger area
of the PAW, the subject ship should change the
rudder angle to -15° within 180 s.
Figure 14: Speed of simulated subject ship.
-2000 -1000 0 1000 2000 3000
-3000
-2000
-1000
0
1000
2000
y0 (Meters)
x0 (Meters)
MMG Model
Database
Maneuvering
Parameters of
Sub
j
ect Shi
p
AIS
Other Ships
Obstacles
Disturbances
PAW
Trial Maneuvers
SIMULTECH2013-3rdInternationalConferenceonSimulationandModelingMethodologies,Technologiesand
Applications
248
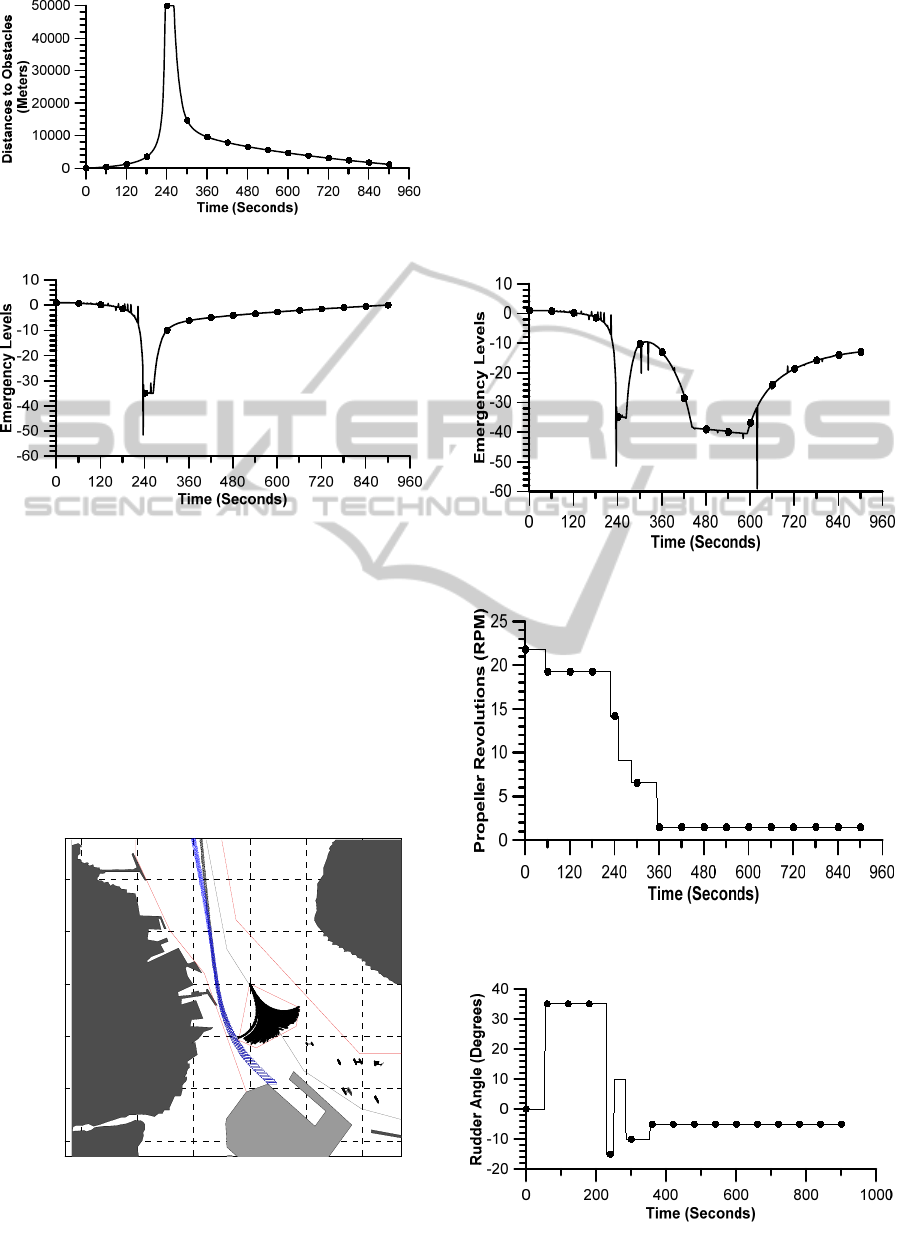
Figure 15: Distances to the shortest obstacle.
Figure 16: Time series of emergency levels.
Figure 14 shows the velocity of the ship required to
cross the current at a speed of 11 knots to avoid the
danger area (PAW). This causes the ELs of the ship
to be positive at the beginning of the simulation, as
shown in Figure 16. At the end of the simulation, the
ELs were back to positive. This was caused by the
steady rudder angle at the end of simulation. The
extreme values for the distance to the shortest
obstacle and EL at a simulation time of 238–264 s
are shown in Figure 15 to clarify the low values
during the rest of the simulation.
Figure 17: Improved emergency levels.
In another trial to simulate maneuvering, the
conditions were improved by decreasing the ship
speed and changing the rudder angle after the PAW
was avoided, as shown in Figures 17–20. The
improved ship track is shown in blue in Figure 17.
However, because the ELs at the beginning of the
simulation were still positive, as shown in Figure 18,
the use of a tug before the ship leaves the danger
area of the PAW is recommended. The
recommended propeller revolutions and rudder angle
are shown in Figures 19 and 20.
Figure 18: Improved emergency levels.
Figure 19: Propeller revolutions for improvement of
emergency levels.
Figure 20: Recommended rudder angle.
-3000 -2000 -1000 0 1000 2000
-3000
-2000
-1000
0
1000
2000
y0 (Meters)
x0 (Meters)
SimulationofCollisionAvoidancebyConsideringPotentialAreaofWaterforManeuveringbasedonMMGModeland
AISData
249

7 CONCLUSIONS
The existing MMG model was refined in MATLAB
to consider the shallow water of a port area and
external disturbances. The simulation of a subject
ship exiting a new port and obstacles such as
shallow water and the PAW of a target ship are
presented. The maneuvering parameters for
propeller revolutions, rudder angles, initial ship
heading, and recommended use of tugs in critical
areas are presented for a developing port area.
Future work will involve the use of more ship details
in a database of the proposed navigation system for
conducting research on maneuvering safety analysis
in a port area based on ship maneuvering
simulations using the MMG model and AIS data.
REFERENCES
Asmara, I. P. S., Kobayashi, E., Wakabayashi, N.,
Khanfir, S., and Pitana, T., 2012. Uncertainty Analysis
for the Estimation of Ship Maneuverability in Tanjung
Perak Port Area using MMG Model and AIS Data.
Proceedings of 15th the Autumn Conference of The
Japan Society of Naval Architects and Ocean
Engineers, pp. 295–298.
Asmara, I. P. S., Kobayashi, E., Wakabayashi, N., Artana,
K. B., Dinariyana, A.A.B, and Pitana, T., 2013. Trial
Maneuvers Based Collision Avoidance between
Anchorage Areas using MMG Model and AIS Data.
Proceedings of the Spring Conference of The Japan
Society of Naval Architects and Ocean Engineers.
Fujiwara, T., Ueno, M., and Nimura, T., 2001. An
Estimation Method of Wind Forces and Moments
Acting on Ships. Mini Symposium on Prediction of
Ship Maneuvering Performance, pp. 83–92.
Inoue, K., 1990. Concept of Potential Area of Water as an
Index for Risk Assessment in Ship Handling. The
Journal of Navigation, Vol. 43 (1), pp. 1–7.
Inoue, K., and Usui, H., 1998. On the Navigating between
Anchored Ships and Its Maneuvering Difficulty. The
Journal of Japan Institute of Navigation, Vol. 99, pp.
155–168. (in Japanese)
Kobayashi, E., 1978. Prediction of Maneuvering Indices
by Optimization Method. Master Thesis of Osaka
University, Japan.
Kobayashi, E., 1995. The Development of Practical
Simulation System to Evaluate Ship Maneuverability
in Shallow Water. Proceedings of the Sixth
International Symposium on Practical Design of Ships
and Mobile Units (PRADS ’95), pp. 1.712–1.723.
Leite, A. J. P., Aranha, J. A. P., Umeda, C., and Conti, M.
B. D., 1998. Current Forces in Tankers and
Bifurcation of Equilibrium of Turret System:
Hydrodynamics Model and Experiments. Applied
Ocean Research, Vol. 29, pp. 145–156.
Montewka, J., Kujala, P., and Ylitalo, J., 2009. The
Quantitative Assessment of Marine Traffic Safety in
the Gulf of Finland, on the Basis of AIS Data.
Scientific Journals of Maritime University of Szczecin,
Vol. 18 (90), pp. 105–115.
Nakano, T., and Hasegawa, K., 2012. An Attempt to
Predict Maneuvering Indices Using AIS Data for
Automatic OD Data Acquisition. The Japan Society of
Naval Architects and Ocean Engineers, Vol. 14,
pp.49-52.
Soda, T., Shiotani, S., Makino, H., and Shimada, Y., 2012.
Research on Ship Navigation in Numerical Simulation
of Weather and Ocean in a Bay. International Journal
on Marine Navigation and Safety of Sea
Transportation, Vol. 6 (1), pp. 19–25.
Souza, Jr., J. R. D., and Fernandes, C. G., 2005. Nonlinear
Dynamics of an Archetypal Model of Ships Motions
in Tandem. Applied Mathematics and Computation,
Vol. 164, pp. 649–665.
Szlapczynski, R., 2006. A Unified Measure of Collision
Risk Derived from the Concept of a Ship Domain. The
Journal of Navigation, Vol. 59, pp. 477–490.
Terada, D., 2009. Estimation of the Maneuverability under
External Disturbance. Proceedings of the 13th
International Association of Institutes of Navigation.
Tsou, M. C., and Hsueh, C. K., 2010. The Study of Ship
Collision Avoidance Route Planning by Ant Colony
Algorithm. Journal of Marine Science and
Technology, pp. 746–756.
Wang, N., Xianyao, M., Qingyang, X., and Wang, Z.,
2009. A Unified Analytical Framework for Ship
Domain. The Journal of Navigation, Vol. 62, pp. 643–
655.
Wichers, J. E. W., 1988. A Simulation Model for a Single
Point Moored Tanker. Maritime Research Institute
Netherlands, Vol. 797, pp. 241.
Yoshimura, Y., and Masumoto, Y., 2012. Hydrodynamic
Database and Maneuvering Prediction Method with
Medium High-Speed Merchant Ships and Fishing
Vessels. International MARSIM Conference, pp. 1–9.
Zhuo, Y., and Hearn, G. E., 2008. A Ship Based
Intelligent Anti-Collision Decision-Making Support
System Utilizing Trial Maneuvers. Chinese Control
and Decision Conference.
SIMULTECH2013-3rdInternationalConferenceonSimulationandModelingMethodologies,Technologiesand
Applications
250
