
An Interactive Evaluation Method of Decentralized Procurement
Plan by Multi-Objective Genetic Algorithm
Ryoji Kobayashi
1
, Masakatsu Mori
2
, Masaki Samejima
1
and Norihisa Komoda
1
1
Graduate School of Information Science and Technology, Osaka University, 2-1, Yamadaoka, Suita, Osaka, Japan
2
Yokohama Research Laboratory, Hitachi, Ltd., 292 Yoshida-cho, Totsuka-ku, Yokohama, Kanagawa 244-0817, Japan
Keywords: Supply Chain, Decentralized Procurement Plan, Multi-Objective Genetic Algorithm, Interactive Evaluation.
Abstract: This paper addresses evaluation of a decentralized procurement plan for the support of the discussion among
decision-makers with considering a catastrophic disaster. For the evaluation of the decentralized
procurement plan, we have formulated the decentralized procurement planning problem as 3-objective
optimization problem. However, multiple-objective genetic algorithms (MOGA) to solve the problem take
several minutes and display many Pareto solutions. We propose the interactive evaluation method of the
decentralized procurement plan that is an expanded interactive MOGA (iMOGA) with loss evaluation
simulator and solution selection by characteristics of the decentralized procurement plan. Experimental
results show that the proposed method can allow the decision-makers to find their preference solutions with
38% fewer interactions than the basic iMOGA can.
1 INTRODUCTION
Supply chain is a sequence of operations such as
procurement, production, logistics and sale for
supplying products from suppliers to final
consumers. Retailers in the supply chain procure
products from suppliers and sell products to the
consumers. In supply chain, there is a problem that
catastrophic disasters such as earthquakes may
interrupt the procurement from suppliers. The
retailers suffer losses because they can not sell the
products along with the consumers' demand. In
order to decrease the losses, the retailer increases the
stock of the products and decentralizes procurement
of the product from geographically distributed
multiple suppliers (Chopra and Sodhi, 2004),
(Kleindorfer and Saad, 2005). However, there are so
many plans of decentralizing procurement with
inventory stock that the decision-makers in the
retailers can not find the appropriate plan. In this
paper, we address evaluating the decentralized
procurement plans for the decision making.
For evaluating the decentralized procurement
plans, we formulate the decentralized procurement
planning problem. Decentralizing procurements can
decrease the losses because surviving suppliers from
the catastrophic disasters can keep supplying
products to the retailers. And the increase of the
stock is also available for decreasing the losses. But,
the retailers have to cost in the decentralizing
procurement and the control of the increased stock.
This discussion leads us to formulate the
decentralizing procurement planning problem as a 3-
objective optimization problem to decrease the loss,
the cost for the decentralization, and the cost for the
stock.
Through the formulation, the decision makers
can discuss the plans based on the evaluation by
solving the 3-objective optimization problem by
computer. For more efficient discussion, it is
possible to solve the problem by the Multiple
Objective Genetic Algorithm (MOGA) that is one of
the meta heuristics. However, the computational
time by MOGA is not so short as the decision
makers can use in their discussion because MOGA
is the method for finding many Pareto solutions. The
decision makers can not understand many Pareto
solutions and rather hope to select about 10
representative Pareto solutions based on their
preferences in short time. In this paper, we apply
the interactive MOGA (iMOGA) to decentralizing
procurement planning problem and propose the
method to display the representative solutions with
fewer interactions.
361
Kobayashi R., Mori M., Samejima M. and Komoda N..
An Interactive Evaluation Method of Decentralized Procurement Plan by Multi-Objective Genetic Algorithm.
DOI: 10.5220/0004507203610368
In Proceedings of the 4th International Conference on Data Communication Networking, 10th International Conference on e-Business and 4th
International Conference on Optical Communication Systems (ICE-B-2013), pages 361-368
ISBN: 978-989-8565-72-3
Copyright
c
2013 SCITEPRESS (Science and Technology Publications, Lda.)
2 DECENTRALIZED
PROCUREMENT PLANNING
PROBLEM
2.1 Target Supply Chain Model
First, we introduce a basic supply chain model that
consists of a retailer and multiple suppliers. In order
to consider that a catastrophic disaster hits the
supplier, we have expanded such the basic supply
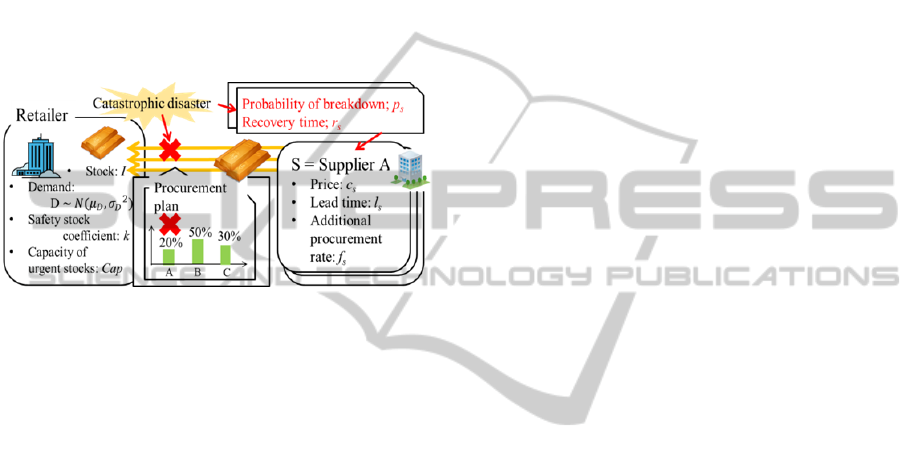
chain model. Fig.1 shows the target supply chain
model.
Figure 1: The target supply chain model.
Unless the catastrophic disaster happens, the retailer
makes a procurement plan to replenish the stock I up
to the safety stock SS. The stock I is remained
products when the products for demand D is shipped
from safety stock SS;. The amount of
replenishment M is decided by the following:
As the above formula shows, because the time
for delivery to the customer from the retailer is 0, the
replenishment M is equal to D. The demand D
follows the Gaussian distribution. And the retailer
has design the strategy of the procurement; what
percent of the amount of the replenishment is
assigned to each supplier. We call the rate of the
assignment “order rate: o
s
”. In the procurement plan,
the retailer orders (
products to supplier s.
When the catastrophic disaster hits some
suppliers, the supplier can not supply their products
at the rate of the probability of the breakdown
;
0 for
days. In order to make up the lacking
products, the retailer place the orders to the
surviving suppliers. Then, the supplier can supply
additional products up to a ceiling of the additional
procurement rate (
) of the order rate. Furthermore,
the retailer can store the urgent stocks U up to a
ceiling of the capacity Cap. When the total stock
(I+U) is below the demand D, the loss L (=D-I-U)
happens.
2.2 Problem Formulation
The decision-makers in the retailer make a
decentralized procurement plan P that indicates both
of each order rate o
s
and the urgent stock U. So, the
decision variables of this problem are P as shown in
the following:
,
,…,
,
The decision-makers decide the procurement plan P
to decrease the loss L. But the decrease of the loss
by decentralization carries cost E for orders to the
suppliers that supply the high price c
s
products. Here,
decentralized ordering costs E is defined as the
increased cost compared to the cheapest plan.
min
Furthermore, the urgent stocks U also cost in being
stored in the warehouse. Therefore, we formulate the
decentralized procurement planning problem as the
following 3-objectives optimization problem:
Objective functions
Loss → minimize
Decentralizedorderingcosts
→ minimize
Urgentstocks → minimize
Constraints
1
where the above described constraints are only the
constraints that represent the decentralized
procurement planning problem.
2.3 Research Purpose
In the multi-objective optimization problem, it is
impossible to decide the optimal solution; some
solutions indicate low loss and high cost, but the
others indicate high loss and low cost. General
approaches derive Pareto optimal solutions whose
one or more objective functions’ values are not
worse than the other solutions, and has the decision-
makers to select solutions that they prefer. The
Pareto optimal solution is decided by Pareto ranking
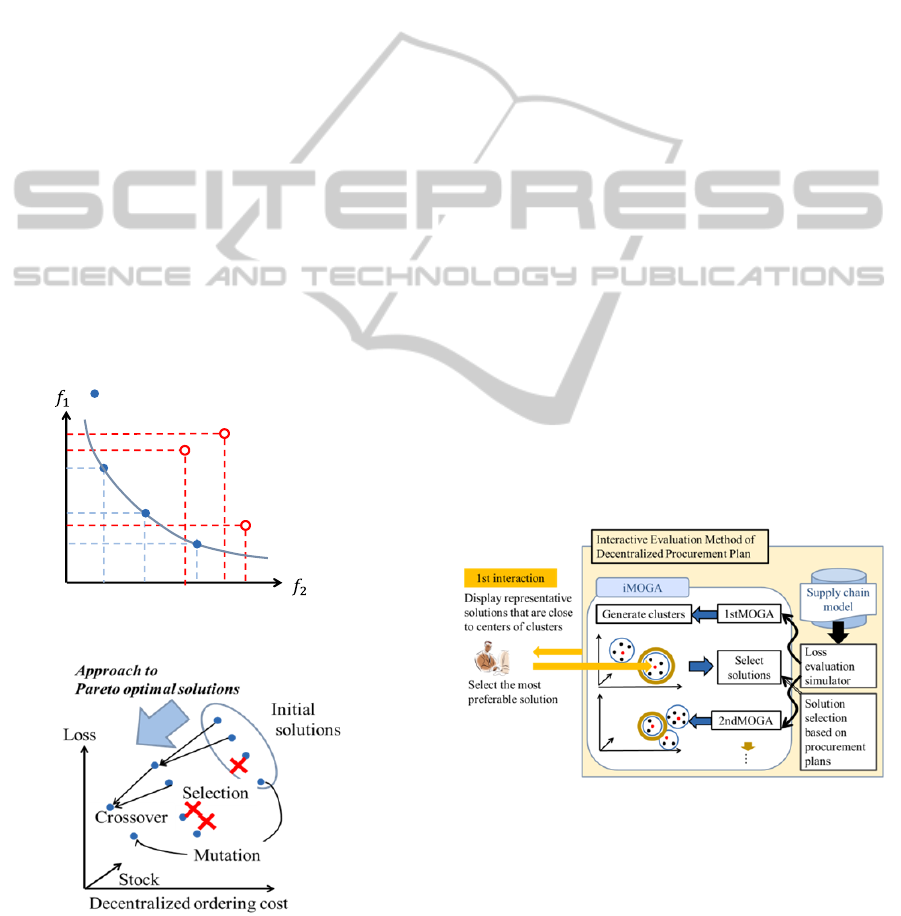
method shown in Fig. 2. Fig. 2 assumes two kinds of
the objective functions (
,
) to be minimized. The
most inner coordinates indicate the value of Pareto
optimal solutions. The evaluation values of Pareto
optimal solutions shape a Pareto curve. Generally, in
ICE-B2013-InternationalConferenceone-Business
362
order to solve such a multi-objective optimization
problem, the multi-objective genetic algorithm
(MOGA) has been applied (Murata and Ishibuchi,
1995), (Fonseca and Fleming, 1993). MOGA is the
method to derive Pareto optimal solutions efficiently
by the weighting sum of objective functions (Murata
1995) or ranking the solutions (Fonseca and
Fleming, 1993). In this paper, MOGA with Pareto
ranking method (Fonseca and Fleming, 1993) is
applied to the problem. The basic idea of MOGA is
shown in Fig. 3. MOGA is performed based on the
following steps:
(1) Initialize: generate some P
(2) Crossover: generate two solutions from a pair of
P
(3) Mutation: generate a solution from P
(4) Selection: select generated P based on Pareto
rank
Pareto rank indicates the rank of the solution in
generated P. In order to decide Pareto rank, MOGA
count the number of non-dominated solutions x
whose all objective functions’ values are better than
P. Let n(x, P) denote the number of x for P. Pareto
rank is decided as n(x, P)+1. In this paper, we
assume that only the solutions have Pareto rank of
1are selected.
Figure 2: Pareto ranking method.
Figure 3: Basic idea of MOGA.
Because MOGA is the method for deriving many
different Pareto optimal solutions, there are
following problems in the use of MOGA for the
support of the decision-makers’ discussion.
The decision-maker has their preferences of the
solutions, e.g. the loss is more important than the
cost for the stock. But they can not select the
preference solution from many Pareto optimal
solutions.
MOGA takes several minutes to solve the
decentralized procurement planning problem.
The decision-makers have to wait the response from
MOGA in their discussion.
So, our research purpose is to allow the decision-
makers to find preference solution in a minute.
3 INTERACTIVE EVALUATION
METHOD
OF DECENTRALIZED
PROCUREMENT PLAN
3.1 Outline of the proposed Method
Because many Pareto optimal solutions are hard for
decision-makers to select and are derived in several
times, we introduce the interactive MOGA
(iMOGA) that stops the crossover and the mutation
in a short time and displays about 10 representative
solutions to the decision-makers (Ishibashi, 2011),
(Hiroyasu, 2008), (Takagi, 2001). Fig. 4 shows the
outline of the interactive evaluation method by
iMOGA.
Figure 4: Outline of the interactive evaluation method by
iMOGA.
iMOGA executes MOGA with fewer crossovers and
mutations several times in order to display the
solutions in a short time. The proposed method uses
the general crossovers and mutations method: blend
crossover (Takahashi and Kita, 2001) and mutation
to exchange randomly selected two o
s
each other.
Because the decision-makers can watch only about
Pareto optimal solutions
1
1
1
2
3
5
Pareto curve
AnInteractiveEvaluationMethodofDecentralizedProcurementPlanbyMulti-ObjectiveGeneticAlgorithm
363
10 solutions, iMOGA makes about 10 clusters of the
solutions by MOGA. In this method, we apply k-
means method as a typical clustering algorithm
(Hearst, 2006). And, the decision-makers select the
preferable solution from the displayed representative
solutions that are closest to the center of each cluster.
Basic iMOGA uses the solutions in the cluster that
the decision-maker selects for the next GA. By
repeating MOGA and the decision-makers’ selection,
the preference solution appears in iMOGA.
Furthermore, in order to display the preference
solutions through fewer times of the interaction, the
proposed method has the following two functions:
Loss evaluation simulator
Because the breakdown happens at random and the
demand changes with following the Gaussian
distributions, it is impossible to evaluate loss L
uniquely. The loss evaluation simulator can
evaluate the distribution of the loss L by Monte
Calro Method.
Solution selection based on decentralized
procurement plan
iMOGA uses the solutions in the cluster that the
decision-makers select. However, if the preference
solution is not in the cluster, it becomes difficult to
search the preference solution by the crossover and
the mutation.
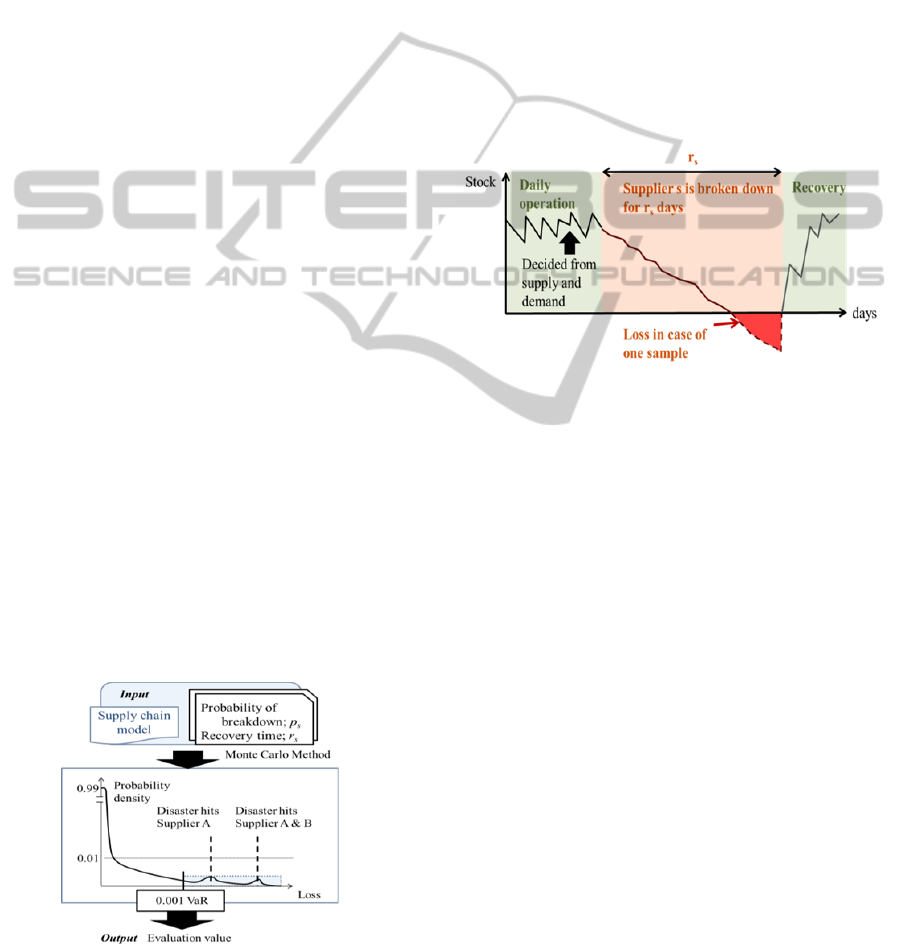
3.2 Loss Evaluation Simulator
The outline of the loss evaluation simulator is shown
in Fig. 5. As shown in Fig. 5, the probability of the
distribution is not Gaussian distribution. A survey in
Japan reports that the catastrophic earthquake
happens below 1%. So, it is not appropriate to
evaluate the loss as the expectation of the probability
distribution of the loss because there is potential for
underestimating the loss (Azaron et al., 2008), (Wu
et al., 2010).
Figure 5: Outline of loss evaluation simulator.
In order to evaluate such the catastrophic disaster
that causes great loss but rarely happens, we
introduce the index of Value at Risk (VaR)
(Johnathan, 2010). By integrating the probability
density from the largest loss in the distribution to the
smaller, the loss when the value of integral is a
certain rate (0.001 in Fig.5) is VaR of the rate (0.001
VaR in Fig.5).
It is necessary to decide the distribution of the
loss for deciding VaR. Therefore, the proposed
method uses Monte Carlo method that samples form
the distribution of the demand and the probability of
the breakdown and decide the loss (Johnathan, 2010).
In order to evaluate the loss for the recovery time r
s
days, the proposed method uses the time-series
simulation with a set of sampled values shown in Fig.
6.
Figure 6: Time-series loss simulation.
After sampling by Monte Carlo method, the time-
series simulator evaluates the loss by using the
sample set of the demand. As shown in Fig. 6, there
no losses before the breakdown. When the
breakdown happens, the supply from the supplier
that is broken down is 0. Then the retailer places
orders to the other suppliers additionally. But, if the
demand is larger than the supply, the stock is
decreased day by day. Finally, the stock is exhausted
and the demand is regarded as the loss until the
supplier is recovered.
3.3 Solution Selection based
on decentralized Procurement
Plans
In order to search the preference solution that is not
in the cluster selected by the decision-makers, the
proposed method selects not only the solutions in the
selected cluster but also a part of the other solutions.
From the other solutions, it is necessary to select the
solutions that tend to generate the preference
solutions by crossover. In the decentralized
procurement planning problem, there are the
relations between the plan and the preference. Fig. 7
shows the relation and our approach to decide which
ICE-B2013-InternationalConferenceone-Business
364
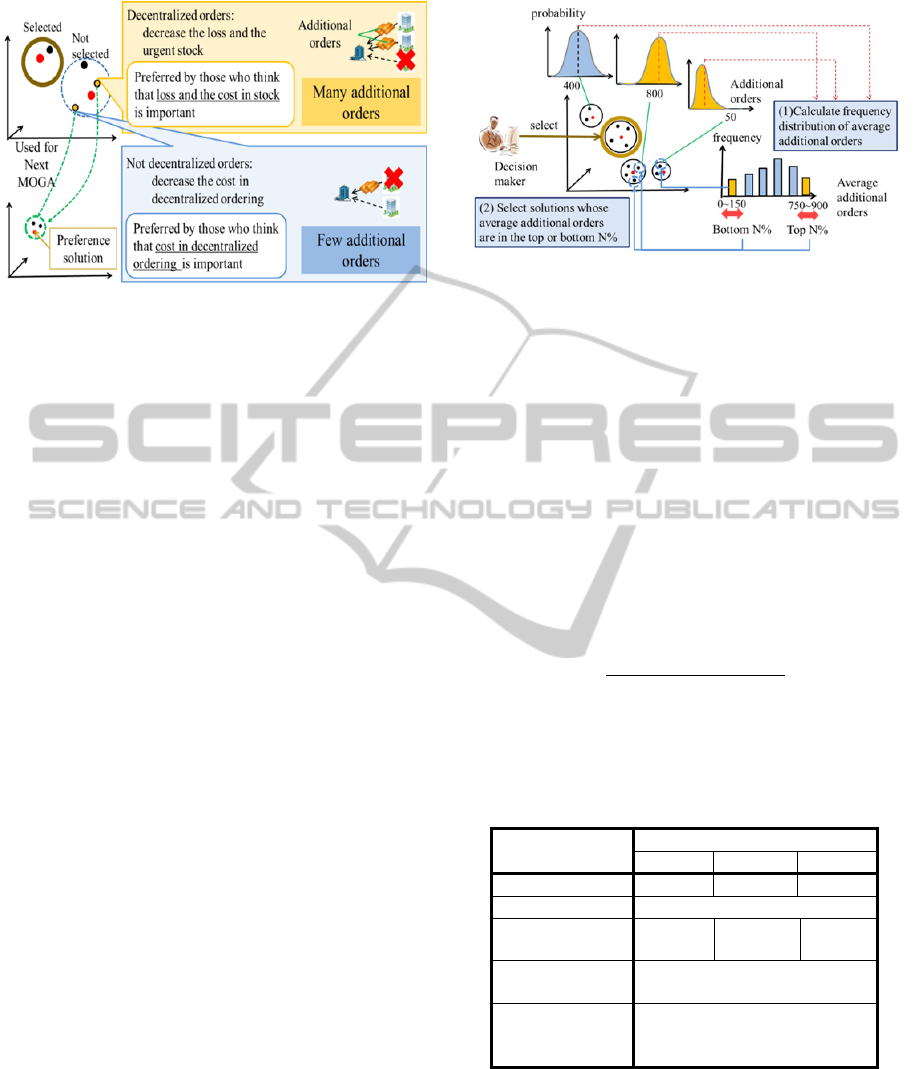
Figure 7: Approach to select solutions.
solutions to be used in addition to the solutions in
the selected cluster.
As described in section 3.2, the retailer places
orders to surviving suppliers when the catastrophic
disaster prevents some suppliers to supply products.
As Fig. 7 shows, when the retailer plans the
decentralized ordering to many suppliers, the loss
and the urgent stock can be decreased by additional
orders. This plan is preferred by those who think that
the loss and the cost for stock are important. On the
other hand, when the retailer does not decentralize
the orders, the loss and the urgent stock can not be
decreased, but the cost for decentralized ordering is
decreased. This plan is preferred by those who think
that cost for decentralized ordering is important.
Therefore, the proposed method selects the solutions
that indicate either decentralized ordering or not-
decentralized ordering, and generate preference
solutions by crossover of the solutions.
In order to select such plans, the amount of the
additional orders is an effective index. The amount
of the additional orders is large in the decentralized
procurement plan. Here, the process of selecting
solution based on the amount of the additional
orders is shown in Fig. 8. The amounts of the
additional orders are calculated in the loss evaluation
simulator and follow the Gaussian distribution. By
using the amounts of the additional orders, the
proposed method selects the solutions that have
large amount or small amount of the additional
orders by the following:
(1) The proposed method calculates the frequency
distribution of average additional orders based on
the solutions by the loss evaluation simulator.
(2) From the distribution, the proposed method
selects the solutions whose average additional
orders in the top or bottom N%.
The selected solutions are used for next MOGA
together with the solutions in the cluster that the
Figure 8: Process of selecting solution based on the
amount of the additional orders.
decision-makers select.
4 EVALUATION EXPERIMENT
4.1 Target of Experiment
The target retailer deals with electronic device that
the retailer procures from 3 suppliers A, B and C
(Mitsukuni et al., 1997). The demand to the retailer
follows Gaussian distribution of N(1500, 250000).
The safety stock coefficient is 1.96 and the retailer
stores the safety stock SS:
1500
1.96
√
250000
=7960
The parameter setting of the suppliers is shown in
Table 1.
Table 1: Parameter setting of the suppliers.
Supplier
A B C
Price [yen] 1,000 1,010 1,020
Lead time [day] 4
Probability of
breakdown
0.83% 0.126% 0.06%
Recovery time
[day]
30
Additional
procurement
rate
20%
In this experiment, we use the agent to express the
decision-makers’ preferences and evaluate the
proposed method by simulating the decision-makers’
selection. The agent selects the representative
solution in the interaction based on the following
utility function (Shixin et al., 2006):
AnInteractiveEvaluationMethodofDecentralizedProcurementPlanbyMulti-ObjectiveGeneticAlgorithm
365
1
By changing the weight
randomly 250 times, we
have the 250 kinds of agents to find their preference
solution. The agent gives up the search when the
interaction is over 10 times. In order to compare the
proposed method, we applied the following methods
too:
Brute force search method
Brute force search method searches Pareto optimal
solutions by evaluating all the solutions. The
preference solution is displayed but many Pareto
optimal solutions are also displayed. And the
computation time is so long that the decision-
makers can not use for the discussion.
MOGA
As described in the section 2.3, MOGA is the
method to search efficiently Pareto optimal
solutions. As well as the brute force search method,
MOGA displays many Pareto optimal solutions.
iMOGA
As described in the section 3.1, iMOGA repeats
short MOGA. iMOGA does not select the solution
based on the amount of the additional orders.
First, MOGA, iMOGA and the proposed method
generate the solutions through changing the order
rates by 10% or the urgent stock by Cap / Lead time
for the initialization of the solutions. And, MOGA,
iMOGA and the proposed method performs the
blend crossover; a new solution is generated from 2
solutions by selecting a supplier randomly and set
new order rate on the selected one as a uniform
random number based on the order rates of 2
solutions. MOGA and iMOGA performs mutations
to exchange order rates among supplier A, B and C.
The mutation rate is 1%. The proposed method does
not perform the mutation because the proposed
method selects solutions, described in section 3.3, to
diversify the solutions. In iMOGA and the proposed
method, 6 generations are generated in MOGA and
10 representative solutions by k-means clustering
are displayed for one interaction.
The computer used in this experiment has the
specification of Intel® Xeon® 2.1GHz 32 cores
1
and
128 GB Memory. The evaluation criteria are the
following:
Response time
Response time indicates how long the decision-
1
Intel and Xeon are trademarks or registered trademarks of Intel
Corporation.
makers can wait the output from each method after
they execute the methods. The decision-maker can
wait about 10 or 20 seconds. Decision-making takes
several minutes, but the decision-makers have to
check as many solutions as possible. So the
decision-makers can wait only 10 or 20 seconds to
get the output.
The number of the interactions
iMOGA and the proposed method have the
decision-makers to select the solutions
interactively. The better method can decrease the
number of the interactions by displaying the
preference solutions early.
Rate of successful search
Because the decision-makers give up the search in
10 interactions, the rate of successful search
indicates the rate of the preference solutions to be
displayed within 10 interactions.
4.2 Experimental Result
The response time, the number of interactions and
the rate of the successful search are shown in Fig. 9,
Fig. 10, and Fig. 11, respectively.
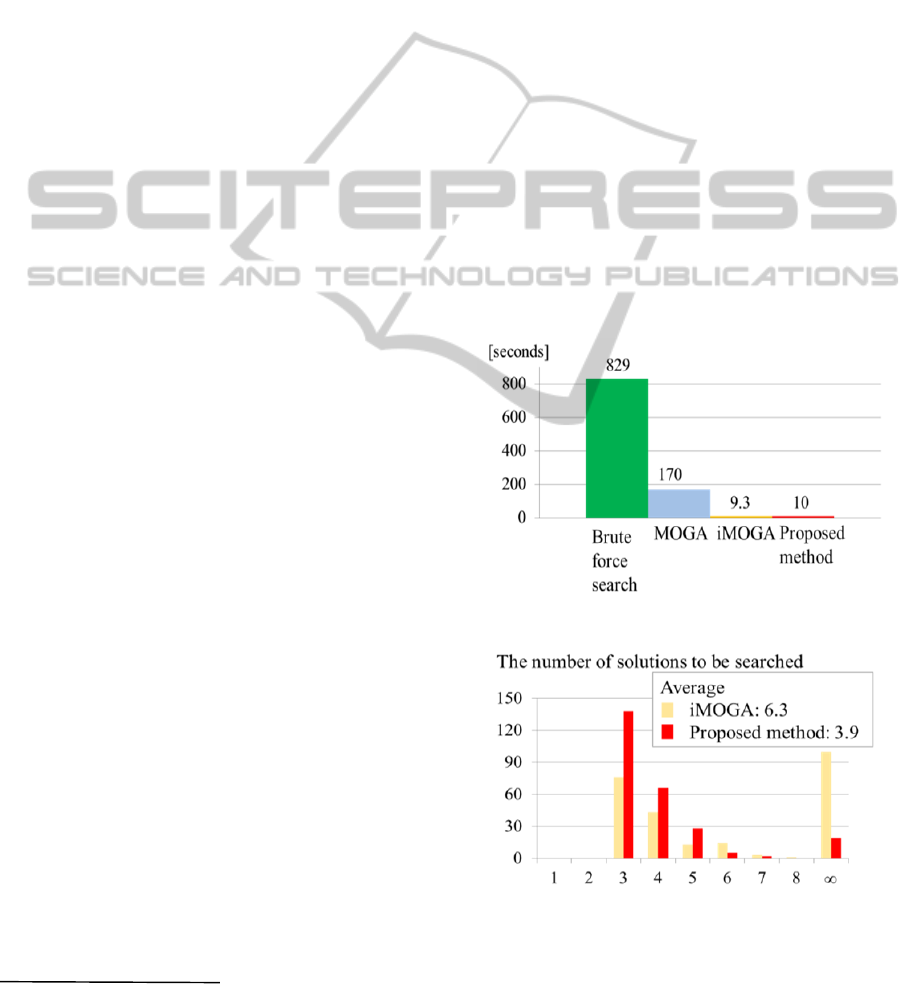
Figure 9: Response time.
Figure 10: The number of the interactions.
Fig. 9 shows that brute force method and MOGA
takes over a few minutes, which is not available for
the decision-makers discussion. On the other hand,
ICE-B2013-InternationalConferenceone-Business
366
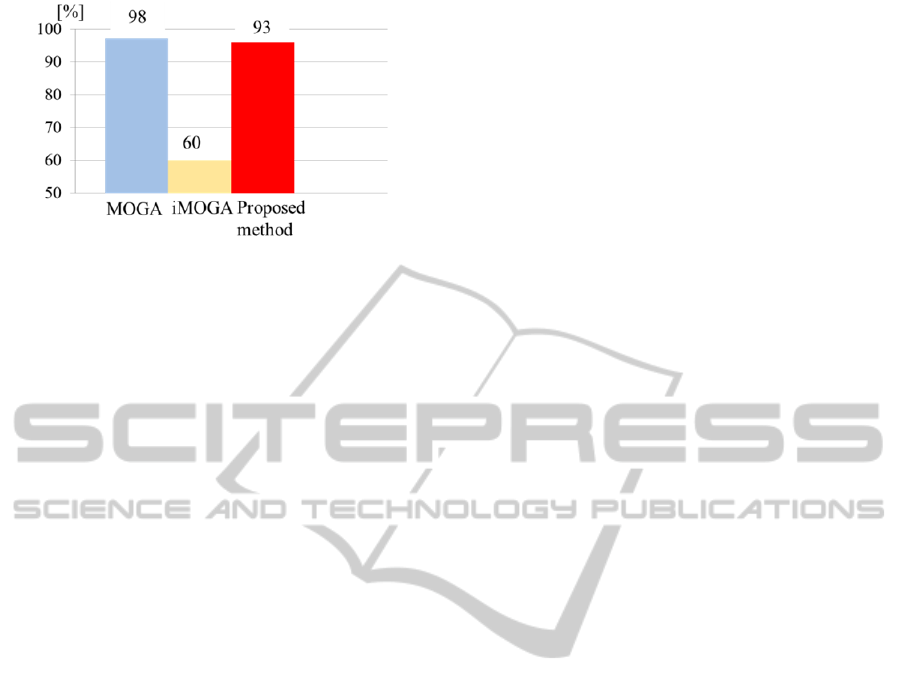
Figure 11: The rate of the successful search.
iMOGA can be executed in 9.3 seconds, and the
proposed method can be executed in 10 seconds.
Response time of proposed method is a little bit
longer than that of iMOGA because of selecting the
solution based on the amount of the additional
orders. But the increase of the computational time is
trivial for the decision-makers.
Fig. 10 shows the result of the interaction by 250
kinds of the agent. The proposed method can search
the preference solutions for the half of the agents
with 3 interactions. The more preference solutions
are searched up to 7 interactions. Finally, the
proposed method can not search 7% of the
preference solutions within 10 times of the
interactions. iMOGA can search the preference
solutions for 30% of the agents with 3 interactions
and also search more solutions up to 7 interactions.
iMOGA can not search 40% of the preference
solutions within 10 times of the interactions. As
shown in Fig. 10, the average of the interactions by
the proposed method is 3.9 and one by iMOGA is
6.3. So, the proposed method can succeed in
decreasing the number of the interactions by 38%
compared to iMOGA.
Focusing the rate of the successful searches
shown in Fig. 11, MOGA can search the preference
solutions for 98% of the agents within 10
interactions. The proposed method can search the
preference solutions for 93% of the agents within 10
interactions. This indicates that the proposed method
is as available as MOGA from the viewpoint of the
accuracy of displaying the preference solutions.
Because iMOGA selects solutions for next MOGA
only from a selected cluster, iMOGA often fails to
search the preference solutions within 10
interactions.
From the experimental result, it is confirmed that
it is possible to search more preference solutions by
the proposed method with fewer interactions
compared to iMOGA. And the representative
solutions are displayed within 10 seconds, which is
short enough to support the discussion.
5 CONCLUSIONS
In this paper, we proposed an interactive evaluation
method of decentralized procurement plan by Multi-
objective genetic algorithm (MOGA). Although
MOGA has been applied to the multi-objective
optimization problem, the decision-maker can not
understand many Pareto optimal solutions by
MOGA. And, MOGA takes several minutes to solve
the multi-objective optimization problem. Our
proposed method displays the representative
solutions to the decision-makers and has them to
select one. By repeating this interaction, the
decision-maker can search their preference solutions
in a short time. In order to evaluate the loss that is
caused probabilistic catastrophic disaster, we
developed the loss evaluation simulator. This
simulator can evaluate the loss by simulating the
stock with Monte Carlo method. Furthermore, in
order to decrease the interaction, the proposed
method selects not only the solutions that are in the
selected cluster but also the solutions that tend to
generate the preference solutions based on the
amount of the additional orders. Through the
application of the proposed method to the supply
chain model, we confirmed that the proposed
method decreased the 38% of the interactions of
selecting solutions compared to iMOGA.
Our future work is to expand the versatility of
the proposed method to apply other supply chain
model. It will be necessary to analyse the sensitivity
of the parameters, especially the number of suppliers
and additional procurement rates. For practical use
of this method, we will implement the graphical user
interface to display the representative solutions to
support selecting solutions by the decision-maker.
REFERENCES
Azaron, M. A., Brown, K.N., Tarim, S.A., Modarres M.,
2008. “A multi-objective stochastic programming
approach for supply chain design considering risk,”
International Journal of Production Economics, Vol.
116, pp. 129-138.
Chopra, S., Sodhi, M. S., 2004. “Managing Risk to Avoid
Supply-Chain Breakdown,” MIT Sloan Management
Review, Vol. 46, No. 1 pp.53-61.
Fonseca C. M., Fleming, P. J., 1993. “Genetic Algorithms
for Multiobjective Optimization: Formulation,
Discussion and Generalization,” In Proceedings of the
5
th
International Conference on Genetic Algorithms,
pp. 416-423.
Hearst, M. A., 2006. “Clustering versus faceted categories
for information exploration,” Communications of the
AnInteractiveEvaluationMethodofDecentralizedProcurementPlanbyMulti-ObjectiveGeneticAlgorithm
367

ACM, Vol. 49, No. 4, pp.59-61.
Johnathan, M., 2010. Modeling Risk: Applying Monte
Carlo Risk Simulation, Strategic Real Options,
Stochastic Forecasting, and Portfolio Optimization,
John Wiley & Sons.
Kleindorfer, P. R., Saad, G. H., 2005. “Managing
Disruption Risks in Supply Chains,” Production and
Operations Management, Vol. 14, No. 1, pp.53-68.
Mitsukuni, K., Komiya, F., Sugiyama, K., Tomita, Y.,
Maki, H., Komoda, N., 1997. “Coupling point
production control system for quick response to orders
and minimum inventories”, In Proceedings of the 6th
International Conference on Emerging Technologies
and Factory Automation, pp. 154 – 159.
Murata, T., Ishibuchi, H., 1995. “MOGA: multi-objective
genetic algorithms,” In Proceedings of IEEE
International Conference on Evolutionary
Computation, vol. 1, pp. 289.
Shixin, L., Jiafu, T., Jianhai, S., 2006. “Order-planning
model and algorithm for manufacturing steel sheets,”
International Journal of Production Economics, Vol.
100, No. 1, pp. 30-43
Takagi, H., 2001. “Interactive evolutionary computation:
Fusion of the capabilities of EC optimization and
human evaluation,” In Proceedings of the IEEE, Vol.
89, No. 9, pp.1275-1296.
Ishibashi, K., 2011. “Proposal of Font Selection Method
using Interactive Genetic Algorithm and Similarity
Serch,” ITE Technical Report, Vol. 35, No. 39, pp.33-
36.
Hiroyasu, T., 2008. “Discussion of the Evaluation Method
of the Individual for interactive Genetic Algorithm, ”
IPSJ SIG Technical Report, Vol. 68, No. 29, pp.113-
116.
Takahashi M., Kita H., 2001. “A Crossover Operator
Using Independent Component Analysis for Real-
Coded Genetic Algorithm,” In Proceedings of the
2001 Congress on Evolutionary Computation, pp.
643-649.
Wu, D. D., Zhang, Y., Wu, D., Olson, L., 2010. “Fuzzy
multi-objective programming for supplier selection
and risk modeling: A possibility approach,” European
Journal of Operational Research, Vol. 200, pp. 774-
787.
ICE-B2013-InternationalConferenceone-Business
368
