
FSR MARINE TARGET CLASSIFICATION WITH DATA
MINING APPROACH
Dorina Kabakchieva
University of National and World Economy, Sofia, Bulgaria
dkabakchieva@unwe.bg
Hristo Kabakchiev
Faculty of Mathematics and Informatics, Sofia University St. Kliment Ohridski, Sofia, Bulgaria
ckabakchiev@fmi.uni-sofia.bg
Vera Behar
Institute of Information and Communication Technologies, Bulgarian Academy of Sciences, Sofia, Bulgaria
behar@bas.bg
Ivan Garvanov
University of Library Studies and Information Technologies, Sofia, Bulgaria
igarvanov@yahoo.com
Keywords: Radar target classification, Data mining
Abstract: The purpose of this paper is to present the research results from a study focused on the possibilities for
implementing data mining approach for classification of radar detected marine targets. The study is based
on experimental data collected by researchers from Birmingham University with Bistatic Forward
Scattering Radar. The data is further processed by using a CA CFAR approach for radar detection and target
specific estimation, proposed by Sofia University team. Rough estimation of the target parameters in time
domain in implemented, based on the hypothesis that the number of detected samples received from the
target defines the target projection (length) and the energy reflected from the target. The classification
models for predicting the class of the detected marine targets, achieved with selected algorithms in data
mining software WEKA, for two values of the predicted variable (the marine target class), are described in
the paper. The results from the evaluation of the models are compared with the results received in our
previous paper, concerning classifiers achieved for predicted target variable with three values. The proposed
hypothesis that the decreased number of values for the predicted variable will lead to achieving classifiers
with better quality is validated.
1 INTRODUCTION
Forward scattering radar (FSR) is a special type of
bistatic radars that operate in the narrow area of the
forward scattering effect where the bistatic angle β is
close to 180
0
. FSR has some fundamental
limitations: the absence of range resolution;
operation within narrow angles (±10
0
). Due to the
forward scattering effect (diffraction), the Radar
Cross Section of a target extremely increases (by 2-3
orders) and mainly depends on the target’s physical
cross section and is independent of the target’s
surface shape and the absorbing coating on the
surface. Forward Scattering Radar is effective for
detection of “stealth” targets. The Doppler shift
(radial velocity) of the target reduces when the target
145
Kabakchieva D., Kabakchiev H., Behar V. and Garvanov I.
FSR MARINE TARGET CLASSIFICATION WITH DATA MINING APPROACH.
DOI: 10.5220/0004786501450152
In Proceedings of the Second International Conference on Telecommunications and Remote Sensing (ICTRS 2013), pages 145-152
ISBN: 978-989-8565-57-0
Copyright
c
2013 by SCITEPRESS – Science and Technology Publications, Lda. All rights reserved

moves from the boundary of the forward scattering
zone to the baseline “transmitter-receiver”, equals
zero when the target crosses the baseline and
increases again as the target approaches the zone
(see Fig.1 and Fig.2).
Figure 1: FSR system topology.
Figure 2: Coverage of BS and FS radar systems.
A team from Birmingham University has been
working on these issues and considers different
structures and algorithms for detection, estimation
and classification of ground and marine targets in a
Forward Scatter Radar (FSR) system in many
published papers. They propose equations for
calculating marine target parameters, i.e. velocity
and length, on the basis of the estimated signal
parameters (Cherniakov, Gashinova et al., 2007,
Cherniakov, Raja, et al., 2005, Rashid, et al., 2008,
Raja, 2005). One of these equations shows that the
linear size of the target is proportional to the speed
of movement of the target and inversely proportional
to the first spectrum minimum. The time duration of
the target signal is related in the FSR zone to the
approximate profile of the object. Then, the
precision estimation of the time duration of the
Doppler signal is very important because it
guarantees the quality of estimates of the frequency
calculated on the first minimum and the maximum
of the Power Spectrum Density. In our previous
papers (Kabakchiev, et al., IRS, 2011, Kabakchiev,
et al., SPS, 2011) we have considered a rough
approach in time domain for calculating the length
(time duration) and energy (FSR Radar Cross
Section) of marine targets in a Forward Scatter
Radar (FSR) system. The error of estimation of the
target length is about 15-20% which is within the
engineering accuracy.
The purpose of this paper is to present the
research results from a study focused on the
possibilities for implementing data mining approach
for classification of radar detected marine targets.
The study is based on experimental data collected by
researchers from Birmingham University with the
constructed by them Bistatic Forward Scattering
Radar, as described in (Cherniakov, Gashinova et
al., 2007). The collected data is further processed, by
using the CA CFAR approach presented in
(Kabakchiev et al., IRS, 2011, Kabakchiev et al.,
SPS, 2011), for achieving radar detection and target
specific estimation development from Sofia
University team. They use rough estimation of the
target parameters in time domain, based on the
hypothesis that the number of detected samples in
the signal received from the target defines the target
projection (length) and the energy reflected from the
target. In our previous paper (Kabakchiev,
Kabakchieva et al., 2011), the targets were
distributed in three classes corresponding to three
variants of detected marine objects (water-jets,
boats, ships) that are crossing a maritime electronic
fence (Cherniakov, Gashinova et al., 2007). The
classification models for predicting the detected
target class were based on the received and pre-
processed target data and were built by applying
different data mining methods. The WEKA software
(Witten, 2005) was used for the Data Mining
analysis. The achieved results from the
classification, for the three classes of marine targets
(MISL Boat, Average Boat, Big Boat) in time
domain, were similar to the results achieved by
Birmingham University team for speed and length
estimates of ground targets in frequency domain.
The thorough analysis of the achieved results
revealed that the trained classifiers for predicting the
class of the detected marine targets based on the
available signal data did not perform with high
accuracy for all the three classes (Kabakchiev,
Kabakchieva et al., 2011). The classifiers worked
best for the MISL Boat class which was most
represented in the available data, and much worse
for the other two classes which were less represented
in the data.
The purpose of this paper is to find an approach
for increasing the classifiers’ accuracy of prediction
of the marine target class for the same dataset. Our
hypothesis is that the accuracy of prediction will
increase if the number of classes is decreased, i.e. by
combining the marine targets from the two less
represented classes into a single class. The
classification models for predicting two classes of
marine targets are described in the paper, using
popular evaluation criteria for estimating the
classifiers’ quality. A comparison is also made
between the classifiers achieved for the two variants
of the predicted target variable – with three and two
classes. The received results confirm the validity of
the proposed hypothesis, showing that the decreased
Tx Rx
T
x
R
x
Bistatic zone
Bistatic zone
Target shadow (FS zone)
Second International Conference on Telecommunications and Remote Sensing
146

number of classes of the predicted variable lead to
achieving classifiers with better quality. These
results are comparable to the results achieved by the
researchers from Birmingham University for
classification based on the Doppler velocity
(Cherniakov, Raja et al., 2005, Rashid et al., 2008,
Raja, 2005, Ibrahim, 2009).
2 DATA COLLECTION AND
MARINE TARGET ATTRIBUTE
EXTRACTION
2.1 Data Collection
The experimental data is collected by the team from
Birmingham University in February and March
2010. The experiment site and the MISL Boat used
for the experiments are presented on Fig.3 and Fig.4.
Figure 3: The Experiment Site.
Figure 4: The MISL Boat used for the Experiments.
The signal detection and data processing are
based on the experimental records provided by the
team from Birmingham University.
2.2 Marine Target Attribute
Extraction
Several target attributes are extracted from the
experimental data, including target time duration
(length or sample number), reflected energy (power)
from the target, signal-to-clutter ratio, the level of
correlation before and after pulse cancellation, etc.
They are calculated at the output of an original
structure of an MTI CA CFAR K/M-L processor in
time domain (Kabakchiev, Kabakchieva et al.,
2011).
Moving Target Indicator is a method to reject the
radar clutter. If one pulse is subtracted from the
previous pulse, clutter echoes will cancel and will
not be detected. Moving targets change in amplitude
from one pulse to the next because of their Doppler
frequency shift. If one pulse is subtracted from the
other, the result will be not enough non-cancelled
residue power after cancellation. In our previous
papers (Kabakchiev et al., SPS, 2011, Kabakchiev et
al., IRS, 2011) we used a two-pulse MTI technique
for removing of correlated sea clutter, because
implementation of three pulse MTI algorithm further
reduced the correlation, but the improvement is not
as great.
After the MTI processing, an original CA CFAR
processor is used. The original CA CFAR processor
differs from the standard CA CFAR because it uses
bigger distance between the test cell and the two
reference windows (equal to the half cells of the
biggest target).
Then a K/M-L test is implemented. When the
time duration of the target (corresponding to the
signal sample size) is unknown, the approach for
automatic batch detection of binary samples is
usually used - determining the beginning and the end
of the target plot and then estimating the plot length.
Two nonparametric tests are used – a K/M test for
determining the beginning of the target plot and a
nonparametric L test for determining the target plot
end based on the number of detected zero values.
The aim is to use this approach for estimation of the
unknown length of the samples of marine targets.
The calculation of the number of samples
corresponding to the detected target at the output of
the K/M-L detector is performed with a standard
mathematical operator in Matlab. The time duration
of the Doppler signal is calculated by multiplying
the number of samples by the value of the Pulse
Repetition Time. The time duration of the target
signal is equivalent in FSR to the approximate
profile/length of the target.
The average Doppler target power estimate is
formed as square of the average difference between
the amplitude of the extracted Doppler target signal
and the CFAR detection threshold. The average
energy of the Doppler target is formed as a product
of the time duration and the average power. A
standard statistical average procedure in Matlab is
used to calculate roughly the average estimation of
the target energy or power.
FSR Marine Target Classification With Data Mining Approach
147
For investigating the robustness of the MTI CA
GFAR K/M-L detector in different marine
situations, we use estimation on other parameters in
the time domain. These are estimates at the output of
the K/M-L detector including correlation coefficient
and signal-to-clutter ratio. The correlation
coefficient and the SNR parameter are calculated as
a ratio between the two standard deviations of the
detected package pulses after the CA CFAR filtering
and the clutter from the tested window, with
standard functions in Matlab.
3 DESCRIPTION OF THE DATA
USED IN THE DATA MINING
RESEARCH
The data received at the output of the MTI CA
CFAR K/M-L processor is used for the data mining
analysis. It is currently organized in a simple excel
file, because the originally collected data to this
moment is actually very limited. However, if the
radar system is put into operation, it is assumed that
large volumes of data will be collected and
processed, and they should be arranged in a database
or a data warehouse in order to be in a format that is
suitable for further analysis.
The currently analyzed data contains 80
instances described by 16 features (see Table 1),
including the target variable. It contains nominal and
numeric variables, describing various aspects,
including the distance between the radars used in the
experiment, the antenna parameters, the weather
conditions including the wind speed and direction,
and the evaluated target parameters.
As it is shown in Table 1, there are a lot of
missing values for some of the data features. This is
either due to missing information from the trials
data, or to difficulties in measuring those
parameters.
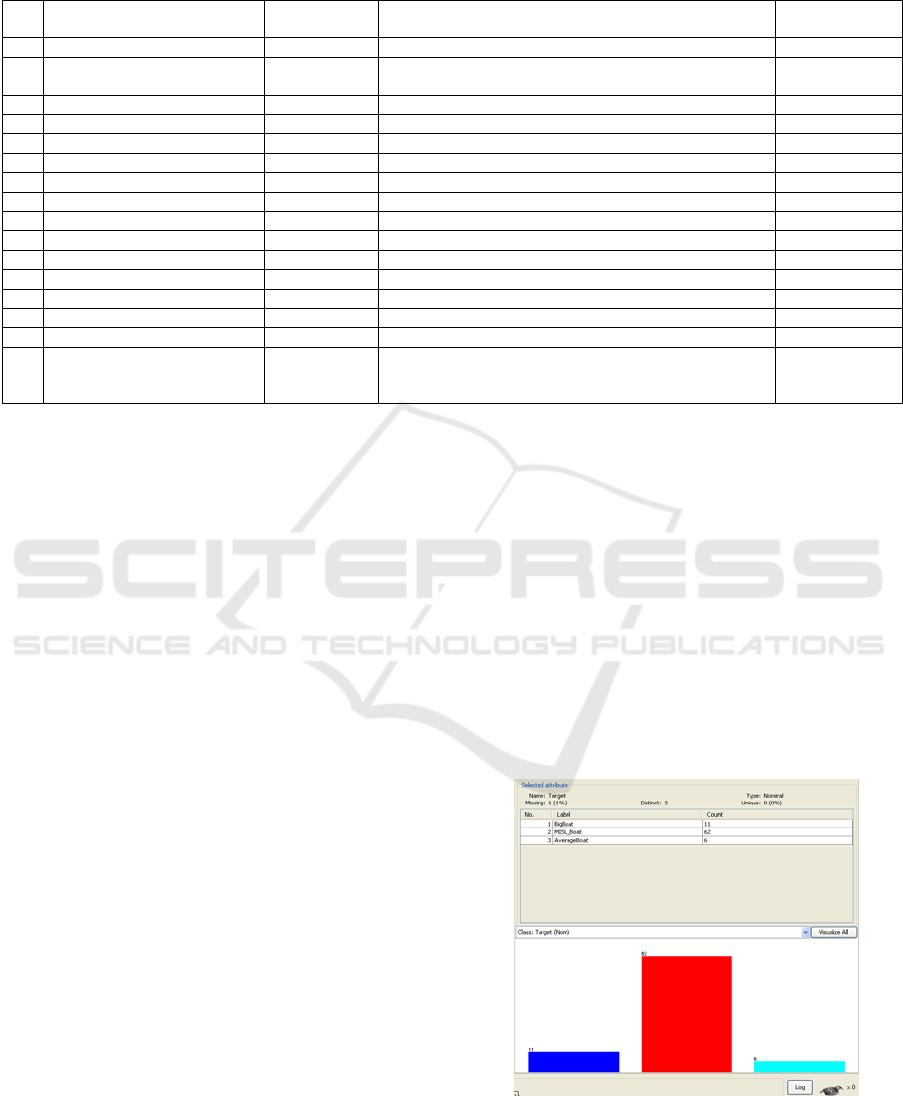
The Target Variable is the detected radar target
that has to be classified in order to identify it. The
original trial data contains 14 different targets that
have been recorded. However, since the available
data for the analysis is very limited (80 instances), it
is decided to organize the actual radar targets into
limited number of classes.
Figure 5a: Distribution of the Target Variable.
The research results presented in this paper refer
to two variants of the target variable. In the first
Table 1: Dataset used for the Data Mining Analysis.
No Variable Name Variable
Type
Values Missing Values
1 Trial Date Nominal 17/02/10 (43), 18/02/10 (10), 21/03/10 (14), 23/03/10 (13) 0 (0%)
2 Distance Between Radars Numeric Min=300m, Max=500m, Mean=330.6m, StdDev=57.22
(300m, 316m, 500m)
0 (0%)
3 Antenna Nominal A1/2/V/A2/1/V; A1/3/H/A2/1/H 0 (0%)
4 Weather Nominal Sunny (56), Gloomy (11), Raining (13) 0 (0%)
5 Wind Speed Numeric 1 - 5.1 m/s 2 (3%)
6 Wind Direction Nominal SE (42), S (22), NW (1), SW (10), W (3) 2 (3%)
7 Boat Direction Nominal South (11), North (12) 57 (71%)
8 S/N Ratio Before PC Numeric 0 – 93.04, Mean=37.246, StdDev=26.207 12 (15%)
9 S/N Ratio After PC Numeric 0 – 65.59, Mean=17.937, StdDev=22.605 14 (18%)
10 Number of Pulses Before PC Numeric 0 – 2557, Mean=1148.892, StdDev=720.049 15 (19%)
11 Number of Pulses After PC Numeric 0 – 4361, Mean=863.424, StdDev=1113.801 14 (18%)
12 Correlation Before PC Numeric 0.62 – 1, Mean=0.954, StdDev=0.099 17 (21%)
13 Correlation After PC Numeric 0.008 – 0.982, Mean=0.676, StdDev=0.322 18 (23%)
14 Energy Before PC Numeric 0 – 2.939, Mean=0.599, StdDev=0.712 14 (18%)
15 Energy After PC Numeric 0 – 0.499, Mean=0.024, StdDev=0.067 13 (16%)
16 Target
Variant 1 – 3 Classes
Variant 2 – 2 Classes
Nominal
BigBoat (11), MISL_Boat (62), AverageBoat (6)
MISL_Boat (62), OtherBoat (17)
1 (1%)
Second International Conference on Telecommunications and Remote Sensing
148

variant the target variable contains three distinct
values (Kabakchiev, Kabakchieva et al., 2011) –
MISL Boat, Big Boat and Average Boat, and in the
second variant, presented in this paper, the target
variable contains two distinct values – MISL Boat
and Other Boat. The MISL Boat class includes data
records about a small rubber boat, used for the
experiments by the research team from Birmingham
University, and that is the reason for having the
majority of instances for this class of marine targets.
The other classes are formed based on the expert
opinion of the participants in the real experiments,
and refer to larger boats in the Big Boat class, and to
smaller boats in the Average Boat class.
The distribution of instances in the different
classes, for the two variants of the Target Variable,
visualization from WEKA software, is presented on
Fig.5a and Fig.5b respectively.
Figure 5b: Distribution of the Target Variable.
4 DATA MINING ANALYSIS
The data mining analysis for the second variant of
the predicted variable is performed by using the
same research approach as in (Kabakchiev,
Kabakchieva et al., 2011; Kabakchieva, 2013). The
data mining classification task is implemented
following the CRISP-DM (Cross-Industry Standard
Process for Data Mining) approach (Chapman et al.,
2000), because it is a non-propriety, freely available,
and application-neutral standard for data mining
projects, and it is widely used by researchers in the
field during the last ten years. It is a cyclic approach,
including six main phases – Business understanding,
Data understanding, Data preparation, Modelling,
Evaluation and Deployment. There are a number of
internal feedback loops between the phases,
resulting from the very complex non-linear nature of
the data mining process and ensuring the
achievement of consistent and reliable results.
The software tool that is used for the task
implementation is the open source software WEKA,
offering a wide range of classification algorithms
(Witten, 2005).
Several different classification algorithms are
applied during the Modelling Phase, selected
because they have potential to yield good results.
Popular WEKA classifiers (with their default
settings unless specified otherwise) are used in the
experimental study, including common decision tree
algorithms - J48 (based on the C4.5 algorithm) and
RandomForest, two rule learners (OneR and JRip),
two Bayesian classifiers (NaiveBayes and
BayesNet), a Neural Network (Multilayer
Perceptron), and a SimpleLogistic algorithm.
Two decision tree classifiers are applied – J48
and RandomForest. The J48 classification filter is
based on the C4.5 decision tree algorithm, building
decision trees from a set of training data using the
concept of information entropy. The RandomForest
is an ensemble classifier that consists of many
decision trees and outputs the class that is the mode
of the class's output by individual trees.
Bayesian classifiers are statistical classifiers that
predict class membership by probabilities, such as
the probability that a given sample belongs to a
particular class. The two fundamental Bayes’
algorithms are applied in the research work -
Bayesian networks and naive Bayes. Naive Bayes
algorithms assume that the effect that an attribute
plays on a given class is independent of the values of
other attributes. Bayesian networks are graphical
models, which can describe joint conditional
probability distributions.
Two algorithms for generating classification
rules are considered. The OneR classifier generates a
one-level decision tree expressed in the form of a set
of rules that all test one particular attribute. The JRip
classifier implements the RIPPER (repeated
incremental pruning to produce error reduction)
algorithm. Classes are examined in increasing size
and an initial set of rules for the class is generated
using incremental reduced-error pruning.
The Multilayer Perceptron (MLP) algorithm
used in the research is a feed-forward artificial
neural network model that maps the input data (input
variables) onto a set of appropriate output (the target
variable, or the defined classes in this case). MLP
utilizes a supervised learning technique called back-
propagation for training the network.
FSR Marine Target Classification With Data Mining Approach
149
Logistic Regression is a well-known statistical
technique that is used for modelling binary
outcomes. A simple logistic regression is used for
prediction of the probability of occurrence of an
event by fitting data to a logistic curve. It is a
generalized linear model used for binomial
regression.
The 10-fold cross validation test option is chosen
for the classification algorithms implementation,
because it proves to be very effective when the
available data is very limited. Every time an
algorithm is run, the available data is distributed in
two data sets – training data containing 9/10 of the
whole dataset, and test data including the other 1/10
of the data. Each algorithm is run ten times and the
final results for the algorithm evaluation are
calculated as average values.
5 THE ACHIEVED RESULTS
The classification models, generated with the
selected data mining algorithms, for the two variants
of the Target Variable, are compared by using the
following evaluation measures: % of correctly
classified instances, Kappa Statistic, True Positive
(TP) and False Positive (FP) Rates, and ROC Area.
These are well known measures for evaluation of
data mining models for classification.
The results, achieved by applying selected data
mining algorithms for classification of detected
radar targets for the first variant of the predicted
variable (with three values) show that the received
overall accuracy of the classification algorithms is
near 80%, although it differs for the three target
classes (Kabakchiev, Kabakchieva et al., 2011). The
data attribute Energy After PC is the attribute with
the highest predictive power. The classification
model with the highest accuracy of prediction is
achieved with the Decision tree algorithm and it is
easy to interpret and understand. However, that
classifier performs best for the MISL Boat class and
worse for the Average Boat and the Big Boat
classes. The only algorithm that performs with
similar accuracy of prediction for the three classes is
achieved with the NaiveBayes algorithm.
Our hypothesis is that the accuracy of prediction
will increase if the number of classes is decreased,
i.e. by combining the marine targets from the two
less represented classes into a single class. The
results from the comparison of the classification
models received for the two variants of the predicted
variable are presented below.
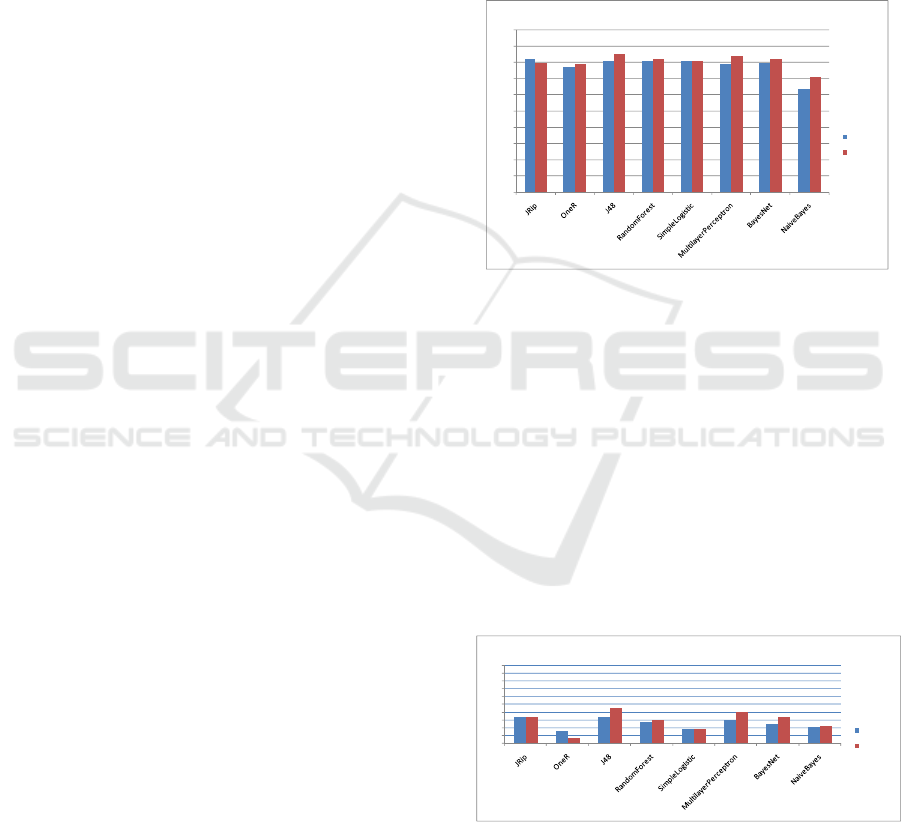
The overall classification model accuracy is
evaluated based on the % of correctly classified
instances, and the classification error is based on the
% of incorrectly classified instances. The results
from the accuracy evaluation of the generated
classification models are presented on Fig.6.
The results on Fig.6 reveal that all classifiers
perform with accuracy above 70%. Moreover, the
classifiers’ accuracy for a Target Variable with 2
classes is higher than that for a Target Variable with
3 classes.
Figure 6: Accuracy evaluation of the generated
classification models.
The results from the evaluation of the generated
classification models, based on the Kappa Statistic
evaluation measure, an index that compares correct
classifications against chance classifications and
taking values in the range from -1 for complete
disagreement, to 1 for perfect agreement, are
presented on Fig.7. Higher values are achieved again
for the classifiers with the second variant of the
Target Variable (with two classes). However, most
of the values are quite below 0.5 which means that
there is no high level of agreement between the
predicted and the actual class of the targets.
Figure 7: Evaluation of the generated classification models
based on the Kappa Statistic measure.
The ROC curve plots the true positives against
the false positives and the area under the curve
represents the accuracy of the model – the larger the
area, the more accurate the model.
82
77
81
81
81
78
80
63
80
78
85
82
81
84
82
71
0
10
20
30
40
50
60
70
80
90
100
CorrectlyClassifiedInstances,%
3classes
2classes
0.3333
0.148
0.3328
0.2653
0.1827
0.3002
0.2404
0.2108
0.3444
0.0628
0.4577
0.2946
0.1731
0.3969
0.3329
0.2212
0
0.1
0.2
0.3
0.4
0.5
0.6
0.7
0.8
0.9
1
KappaStatistic
3classes
2classes
Second International Conference on Telecommunications and Remote Sensing
150
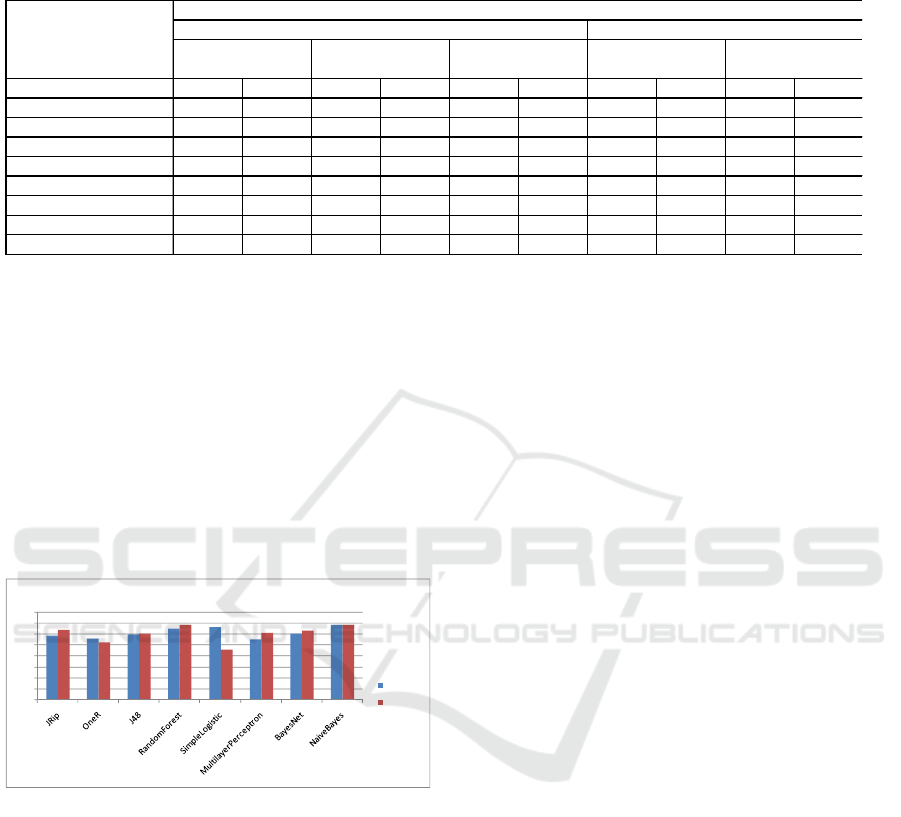
The achieved results for the ROC Area
evaluation measure are presented on Fig.8.
For most of the classifiers the ROC Area values
are slightly above 0.5 which means that they are not
performing very well – slightly better than the naïve
classification (random classification without the use
of a classification model). The models generated
with the Naïve Bayes and Random Forest algorithms
seem to be the best performing classifiers (ROC
Area values between 0.65-0.683), but these values
are still not very high and consequently, the
classifiers are not very reliable for correct
prediction.
Figure 8: Evaluation of the generated classification models
based on the ROC Area measure.
The results for the detailed class accuracy of the
generated classification models are presented in
Table 2. It is obvious that all classifiers perform with
very high accuracy for the MISL boat class – the
class that is most represented in the dataset, but are
much less accurate in the prediction of the other
classes.
6 CONCLUSIONS
All classification models generated with the selected
data mining algorithms for the two variants of the
target variable (with three and two values) perform
with accuracies of prediction above 70% (the only
exception is the NaiveBayes classifier achieved for a
target variable with three values). Moreover, the
classifiers received with the same data mining
algorithms for a target variable with two values
outperform the classifiers achieved for a target
variable with three classes. All classifiers predict
with very high accuracy the MISL Boat class – the
class that is highly represented in the dataset, but are
much less accurate in the prediction of the other
(two or one) classes.
The classifiers achieved with the decision tree
algorithm J48 are the best performing classification
models in both cases, providing 81% prediction
accuracy for a target variable with three classes and
85% prediction accuracy for a target variable with
two classes. A very good classifier in the case of a
target variable with two classes is also achieved with
the neural network algorithm MultiLayerPerceptron
– 84% accuracy, but this algorithm is not so
effective in the case of a target variable with three
classes. These are also the classifiers with the
highest values of Kappa Statistic. However, these
classifiers do not predict equally all classes, they
perform much better for the prediction of the MISL
Boat class, which is most represented in the data
used for the data mining analysis, and are less
accurate when predicting the other classes.
The classification models achieved with the
NaiveBayes algorithm are the only classifiers
working with closer accuracies of prediction for all
classes, although these accuracies are not very high.
The ROC Area values for these classifiers are also
the highest received, which means that the
classification models are properly working for all
classes. However, the ROC Area and Kappa Statistic
values achieved are still not very high and
consequently, the classifiers are not very reliable for
correct prediction.
0.583
0.556
0.596
0.646
0.659
0.551
0.601
0.683
0.636
0.52
0.601
0.683
0.455
0.608
0.629
0.68
0
0.1
0.2
0.3
0.4
0.5
0.6
0.7
0.8
ROCArea
3classes
2classes
Table 2: Detailed class accuracy evaluation of the generated classification models.
DataMiningAlgorithm
TPRate FPRate TPRate FPRate TPRate FPRate TPRate FPRate TPRate FPRate
JRip 0.182 0.029 0.984 0.706 0.333 0 0.903 0.588 0.412 0.097
OneR 0 0.029 0.952 0.824 0.333 0.027 0.984 0.941 0.059 0.016
J48 0.091 0.029 0.968 0.647 0.5 0.027 0.968 0.588 0.412 0.032
RandomForest 0.091 0.015 0.984 0.765 0.333 0.014 0.984 0.765 0.235 0.016
SimpleLogistic 0.091 0 1 0.882 0.167 0 1 0.882 0.118 0
MultilayerPerceptron 0.367 0.059 0.919 0.647 0.167 0.027 0.968 0.647 0.353 0.032
BayesNet 0 0.044 0.984 0.706 0.333 0.014 0.968 0.706 0.294 0.032
NaiveBayes 0.455 0.279 0.677 0.412 0.5 0.041 0.774 0.529 0.471 0.226
Variant2‐2classesVariant1‐3classes
BigBoat MISLBoat AverageBoat MISLBoat OtherBoat
TargetVariable
FSR Marine Target Classification With Data Mining Approach
151

The classification models achieved by applying
selected data mining algorithms on the available data
for FSR detected moving marine targets are similar
to the results received by the research team from
Birmingham University for FSR detected moving
ground targets.
ACKNOWLEDGEMENTS
We would like to acknowledge the work of the
University of Birmingham team who developed the
equipment, experimentation technique and
conducted measurements, and SELEX Galileo
(Luton). This work is financially supported by the
Bulgarian Science Fund DDVU 02/50/2010, and is
partly supported by the project AComIn "Advanced
Computing for Innovation" 2012, grant 316087,
funded by the FP7 Capacity Programme (Research
Potential of Convergence Regions).
REFERENCES
Chapman, P., et al. (2000). CRISP-DM 1.0: Step-by-step
data mining guide. 2000 SPSS Inc. CRISPWP-0800.
Available at: http://www.crisp-dm.org/CRISPWP-
0800.pdf.
Cherniakov, M, Gashinova, M, Cheng, H, Antoniou, M,
Sizov, V, Daniel, L.Y. (2007). Ultra wideband forward
scattering radar: Concept and prospective. Proceedings
of Int. Conf. Radar 2007, 1-5, (2007).
Cherniakov, M., Raja Abdullah, R.S.A., Jancovic, P.,
Salous, M. (2005). Forward Scattering Micro Sensor
for Vehicle Classification. Proceedings of the IEEE
International Radar Conference, Washington DC, US,
pp. 184-189, 2005.
Galati, G. (edit.), 1993. Advanced radar techniques and
systems, IEE Radar, Sonar, Navigation and Avionics
Series 4, Peter Peregrinus Ltd.
Ibrahim, N.K.,. Raja Abdullah, R.S.A, Saripan, M.I.
(2009). Artificial Neural Network Approach in Radar
Target Classification. Journal of Computer Science 5
(1): pp.23-32, 2009, ISSN 1549-3636.
Kabakchiev, C., Garvanov, I., Cherniakov, M., Gashinova,
M., Behar, V., Kabakchiev, A., 2011. CFAR Detection
and Paramiter Estimation of Moving Marine Targets
using Forward Scattering Radar, Proc. of Int. Radar
Simp. IRS’11, Leipzig, Germany, (2011).
Kabakchiev, C., Garvanov, I., Cherniakov, M., Gashinova,
M., Kabakchiev, A., Kiovtorov, V., Vladimirova, M.,
Daskalov,P, 2011. CFAR BI Detector for Mariner
Targets in Time Domain for Bistatic Forward
Scattering Radar, Pros. of Int. SPS-2011, Jachranka,
Poland, 2011.
Kabakchiev, H., Kabakchieva, D., Cherniakov, M.,
Gashinova, M., Behar, V., Garvanov, I., 2011.
Maritime Target Detection, Estimation and
Classification in Bistatic Ultra Wideband Forward
Scattering Radar. Conference Proceedings of the
International Radar Symposium (IRS 2011), 7-9
September 2011, Leipzig, Germany, pp.79-84.
Kabakchieva, D. (2013). Study of Data Mining
Classification Models. PhD. Thesis, Institute of
Information and Communication Technologies (IICT),
Bulgarian Academy of Sciences (BAS), 2013.
Available at:
http://www.iict.bas.bg/konkursi/2013/D_Kabakchieva/
Dorina%20Kabakchieva%20avtoreferat.pdf
Raja Syamsul Azmir Bin Raja Abdulla (2005). Forward
Scattering Radar for Vehicle Classification. PhD
Thesis, July 2005, The University of Birmingham,
UK.
Rashid, N, Antoniou, M, Jancovic, P, Sizov, V, Abdullah,
R, Cherniakov, M, 2008. Automatic Target
Classification in a Low Frequency FSR Network, Proc.
of EuRAD conf. 2008, pp. 68-71.
Witten, I., Frank, E., 2005. Data Mining: Practical
Machine Learning Tools and Techniques. Morgan
Kaufmann Publishers, Elsevier Inc.
Second International Conference on Telecommunications and Remote Sensing
152
