
Can 3D Shape of the Face Reveal your Age?
Baiqiang Xia
1,3
, Boulbaba Ben Amor
2,3
, Mohamed Daoudi
2,3
and Hassen Drira
2,3
1
University Lille1, Lille, France
2
Institut Mines-Telecom/Telecom Lille, Lille, France
3
LIFL (UMR 8022 Lille 1/CNRS), Lille, France
Keywords:
Age Estimation, 3D Face, Dense Scalar Field, Random Forest Regression.
Abstract:
Age reflects the continuous accumulation of durable effects from the past since birth. Human faces deform
with time non-inversely and thus contains their aging information. In addition to its richness with anatomy
information, 3D shape of faces could have the advantage of less dependent on pose and independent of il-
lumination, while it hasn’t been noticed in literature. Thus, in this work we investigate the age estimation
problem from 3D shape of the face. With several descriptions grounding on Riemannian shape analysis of fa-
cial curves, we first extracted features from ideas of face Averageness, face Symmetry, its shape variations with
Spatial and Gradient descriptors. Then, using the Random Forest-based Regression, experiments are carried
out following the Leaving-One-Person-Out (LOPO) protocol on the FRGCv2 dataset. The proposed approach
performs with a Mean Absolute Error (MAE) of 3.29 years using a gender-general test protocol. Finally, with
the gender-specific experiments, which first separate the 3D scans into Female and Male subsets, then train
and test on each gender specific subset in LOPO fashion, we improves the MAE to 3.15 years, which confirms
the idea that the aging effect differs with gender.
1 INTRODUCTION
Face age estimation performs important social roles
in human-to-human communication. Studies in cog-
nitive psychology, presented as a review by (Rhodes,
2009), have discovered that human beings develop the
ability of face age estimation naturally in early life,
and can be fairly accurate in deciding the age or age
group with a given face. These studies, based on sub-
jective age estimation given to face image from hu-
man participants, have also found that multiple cues
contribute to age estimation, including the holistic
face features (like the outline of the face, face shape
and texture, etc.), local face features (like the eyes,
nose, the forehead, etc.) and their configuration (like
the bilateral symmetry of the face (Clinton S. Mor-
rison, 2011)). The aging process is a cumulative,
uncontrollable and personalized slow process, influ-
enced by intrinsic factors like the gene and gender,
and extrinsic factors like lifestyle, expression, envi-
ronment and sociality (Fu et al., 2010; Han et al.,
2013). The appearance and anatomy of human faces
changes remarkably with the progress of aging (Lani-
tis et al., 2002). The general pattern of the aging
process differs in faces of different person (person-
alized or identity-specific), in faces of different age
(age-specific), in faces of different gender (gender-
specific), and in different facial components (Fu et al.,
2010; Rhodes, 2009; Guo et al., 2009; Park et al.,
2010; Guo et al., 2008b). Typically, the craniofacial
growth (bone movement and growth) takes place dur-
ing childhood, and stops around the age of 20, which
leads to the re-sizing and re-distribution of facial re-
gions, such as the forehead, eyes, nose, cheeks, lips,
and the chin. From adulthood to old age, face changes
mainly in the skin, such as the color changes (usually
darker and with more color changes) and the texture
changes (appearance of wrinkles). The shape changes
of faces continues from adulthood to old age. With the
droops and sags of facial muscle and skin, the faces
are tend to be more a shape of trapezoid or rectangle
in old faces, while the typical adult faces are more of
a U-shaped or upside-down-triangle (Rhodes, 2009).
Automatic face age estimation is to label a face
image with the exact age or age group objectively
by machine. With the rapid advances in com-
puter vision and machine learning, recently, au-
tomatic face age estimation have become partic-
ularly prevalent because of its explosive emerg-
ing and promising real-world applications, such as
5
Xia B., Ben Amor B., Daoudi M. and Drira H..
Can 3D Shape of the Face Reveal your Age?.
DOI: 10.5220/0004652300050013
In Proceedings of the 9th International Conference on Computer Vision Theory and Applications (VISAPP-2014), pages 5-13
ISBN: 978-989-758-004-8
Copyright
c
2014 SCITEPRESS (Science and Technology Publications, Lda.)

electronic customer relationship management, age-
specific human-computer-interaction, age-specific ac-
cess control and surveillance, law enforcement (e.g.,
detecting child-pornography, forensic), biometrics
(e.g., age-invariant person identification (Park et al.,
2010)), entertainment (e.g., cartoon film production,
automatic album management), and cosmetology.
Compared with human age estimation, automatic age
estimation yields better performance as demonstrated
in (Han et al., 2013). The performance of age estima-
tion is typically measured by the mean absolute error
(MAE) and the cumulative score (CS). The MAE is
defined as the average of the absolute errors between
the estimated age and the ground truth age, while the
CS, proposed firstly by (Geng et al., 2007) in age es-
timation, shows the percentage of cases among the
test set where the absolute age estimation error is less
than a threshold. The CS measure is regarded as a
more representative measure in relation with the per-
formance of an age estimator (Lanitis, 2010).
As pointed in (Rhodes, 2009; Ramanathan et al.,
2009), the earliest age estimation works used the
mathematical cardioidal strain model, derived from
face anthropometry that measures directly the sizes
and proportions in human face, to describe the cran-
iofacial growth. These approaches are useful for
young ages, but not appropriate for adults. After this,
abundant works exploiting 2D images have been pub-
lished in the literature with more complex approaches.
Different with the comprehensive surveys given by
(Rhodes, 2009; Ramanathan et al., 2009), which cate-
gorized the literature concerning different aging mod-
eling techniques, we represented the literature with
the different ideas underlying these technical solu-
tions. Based on the previous statements, we describe
the face appearance as a function of multiple factors,
including the age, the intrinsic factors (permanent fac-
tors like gene, gender, ethnicity, identity, etc.), and
the extrinsic factors (temporary factors like lifestyle,
health, sociality, expression, pose, illumination, etc.).
A. General Aging Patterns in Face Appearance.
Essentially, face age estimation is to estimate the
age of a subject by the aging patterns shown visu-
ally in the appearance. To analyze the appearance
given in the face image is the basic ways to esti-
mate the age. In the literature of age estimation,
works were carried out with several different per-
ceptions of the general aging patterns in face ap-
pearance. As aging exhibits similar patterns among
different person, several approaches have been de-
signed to learn the general public-level aging pat-
terns in face appearance for age estimation. The
most representative ones are the Active-Appearance-
Model (AAM) based approaches, the manifold em-
bedding approaches, and the Biologically-Inspired-
Feature (BIF) based approaches. The common idea
underlying these approaches is to project a face (lin-
early or non-linearly) into a subspace, to have a low
dimensional representation. Respectively, (i) (Lanitis
et al., 2002; Lanitis et al., 2004) use an Active Ap-
pearance Model (AAM) based scheme for projecting
face images linearly into a low dimensional space.
The AAM was initially proposed by (Cootes et al.,
1998), in which each face is represented by its shape
and texture deviations to the mean face with a set
of model parameters. Age estimation results with a
quadratic regressor showed that the generic aging pat-
terns work well for age estimation. Moreover,(Lanitis
et al., 2004) illustrated that different face parameters
obtained from training are responsible for different
changes in lighting, pose, expression, and individual
appearance. Considering that these parameters work
well for age estimation, we can conclude that these
face co-variants are influential in age estimation. (ii)
The goal of manifold embedding approaches is to em-
bed the original high dimensional face data in a lower-
dimensional subspace by linear or non-linear projec-
tion, and take the embedding parameters as face rep-
resentation. In the work of (Guo et al., 2008b; Guo
et al., 2008a), the authors extracted age related fea-
tures from 2D images with a linear manifold embed-
ding method, named Orthogonal Locality Preserving
Projections (OLPP). (Li et al., 2012) learned age man-
ifold with both local preserving requirements and or-
dinal requirements to enhance age estimation perfor-
mance (Wu et al., 2012) projected each face as a point
on the Grassmann Manifold with the standard SVD
method, then the tangent vector on these points of
the manifold were taken as features for age estima-
tion. (iii) Inspired by a feed-forward path theory in
cortex for visual processing, (Guo et al., 2009) intro-
duced the biologically inspired features (BIF) for face
age estimation. After filtering an image with a Gabor
filter and a standard deviation based filter consecu-
tively, the obtained features are processed with PCA
to generate lower-dimension BIF features. The results
demonstrated the effectiveness and robustness of bio-
inspired features in encoding the generic aging pat-
terns. Beyond the public-level aging patterns, there
could be some less generic aging patterns when deal-
ing with a subset of faces, such as a group of faces
with high similarity, or a temporal sequence of face
images for the same person. Based on the observation
that similar faces tend to age similarly, (Lanitis et al.,
2004; Lanitis et al., 2002) presented an appearance-
specific strategy for age estimation. Faces are firstly
clustered into groups considering their inter similar-
ity, then training is performed on each group sepa-
VISAPP2014-InternationalConferenceonComputerVisionTheoryandApplications
6

rately to learn a set of appearance-specific age estima-
tors. Given a previously unseen face, the first step is to
assign it to the most appropriate group, then the cor-
responding age estimator makes the age estimation.
Experimental results showed that the group-level ag-
ing patterns are more accurate in age estimation com-
pared with the generic-aging patterns. In case there
is no similar enough face image for a testing face im-
age in the database, (Lanitis et al., 2002) presented
a weighted-appearance-specific approach which also
yields fine performance. As different individual ages
differently, (Geng et al., 2006; Geng et al., 2007)
proposed the Aging-Pattern-Subspace (AGES), which
studies the individual-level aging patterns from a tem-
poral sequence of images of an individual ordered by
time. For a test face, the aging pattern and the age
is determined by the projection in the subspace that
has the least reconstruction error. Experiments con-
firm that individual aging patterns contributes to age
estimation. As different face components age differ-
ently, the component-level aging patterns are stud-
ied for age estimation. (Suo et al., 2010) represented
faces with a hierarchical And-Or Graph. Face aging
is then modeled as a Markov process on the graphs
and the learned parameters of the model are used for
age estimation. They found that the forehead and eye
regions are the most informative for age estimation,
which is also supported by discoveries of (Han et al.,
2013) using the BIF features.
B. Considering the Intrinsic/Extrinsic Factors in
Facial Aging. As stated at the beginning of this intro-
duction, the appearance of face is influenced by intrin-
sic factors like the gene, gender, and extrinsic factors
like lifestyle, expressions, environment and sociality
(Fu et al., 2010; Han et al., 2013). Several studies
have given consideration of the influences of these
factors in age estimation with enhanced age estima-
tion performance reported. Specifically, thinking that
faces age differently in different age, age-specific ap-
proaches are adopted by (Lanitis et al., 2004), where
age estimation is obtained by using a global age clas-
sifier first, then adjusted the estimated age by a local
classifier which operates within a specific age range.
Similarly, (Guo et al., 2008b; Guo et al., 2008a) pro-
posed a Locally Adjusted Robust Regressor (LARR)
for age estimation, which begins with a SVR-based
global age regression, then followed by a local SVM-
based classification that adjusts the age estimation
in a local age range. All of these age-specific ap-
proaches have achieved better performance compared
with their corresponding approaches without local ad-
justment. Considering that different gender ages dif-
ferently with age (Ramanathan et al., 2009; Guo et al.,
2008a), (Ueki et al., 2010; Ramanathan et al., 2009;
Guo et al., 2008a; Lakshmiprabha et al., 2011) carried
out age estimation on male and female groups sep-
arately. Considering the individual lifestyle, (Lani-
tis et al., 2002) encoded this information together
with facial appearance in age estimation, and demon-
strated that the importance of lifestyle in determin-
ing the most appropriate aging function of a new in-
dividual. (Ueki et al., 2010) gave weights to dif-
ferent lighting conditions for illumination-robust face
age estimation. (Li et al., 2012) gave consideration
of the feature redundancy and used feature selection
to enhance age estimation. As stated before, in the
childhood, face deformation mainly takes the form of
craniofacial growth with facial features re-sized and
re-distributed. From adulthood to old age, with the
droops and sags of facial muscle and skin, the old
faces usually deform to a trapezoid or rectangle shape
from a typically U-shaped or upside-down-triangle in
adult face (Rhodes, 2009). Another significant shape
deformation is the introduction of facial wrinkles with
aging. While, given the fact that face shape deforms
significantly with age in three dimensions, and given
the robustness of 3D face scans to illumination and
poses compared with 2D face images, all the previous
works in the literature used 2D face datasets for age
estimation, no work has been done concerning the 3D
face. Thus, in this work, we introduce the investiga-
tion of age estimation with 3D face scans. The rest
of the paper is organized as follows: in section 2, we
present an overview of our methodology and summa-
rize the main contributions; in section 3, we explain
our methodology of features extraction from the 3D
faces based on an Riemann framework; in section 4,
we detail the regression strategy for age estimation
using Random Forest; experimental results and their
discussion are presented in section 5 while section 6
comes to the conclusion of this work.
2 METHODOLOGY AND
CONTRIBUTION
From the analysis above, it emerges that most of the
existing works study age estimation with aging pat-
terns chosen at a specified level and some aging fac-
tors enrolled for enhancement. As far as we concern,
all these works are based on 2D images, no work con-
cerning 3D face scans has been attached to age es-
timation. Thus, we introduce in the present work a
new study of 3D-based face age estimation to the do-
main. In our approach, we consider the public-level
aging patterns and gender factor for age estimation.
First, we extract four types of Dense Scalar Field
(DSF) features from each pre-processed face, namely
Can3DShapeoftheFaceRevealyourAge?
7

the Average DSF, the Symmetry DSF, the Spatial DSF
and the Gradient DSF. These DSFs are derived from
different face perception ideas and their computation
is grounding on Riemannian shape analysis of facial
curves. Then we perform age estimation using Ran-
dom Forest Regression on each type of DSFs with
two protocols: one experiment on DSFs of the whole
dataset directly and the other experiments on male
and female DSFs separately. We have also designed a
simple result-level fusion with different type of the
DSFs, to see if the performance improves with all
these face perception ideas combined.
In summary, the main contributions of this work
are as follows. First, as far as we know, this is the
first work in 3D-based age estimation. Although 3D
face growth has been notice for a long time (Mark
and Todd, 1983; Bruce et al., 1989), no work has
been reported to 3D face age estimation. Secondly,
in this work, we introduce four different perspectives
of faces perception for face representation. With the
Dense Scalar Field features, we have obtained signifi-
cant accuracy with each of the perspectives, compared
with typical 2D-based age estimation performance.
Last but not the least, we have enhanced the age esti-
mation performance by experimenting on the scans of
each gender separately, which confirms that the sex-
ual dimorphism exists in terms of face aging patterns.
We have also enhanced the performance by a simple
late fusion rule of the four descriptors.
3 FEATURE EXTRACTION
As mentioned earlier, we adopt the Dense Scalar Field
features in our approach. Based on pair-wise shape
comparison of curves, the Dense Scalar Field (DSF)
grounding on Riemannian shape analysis (Drira et al.,
2012) (Drira et al., 2013) is capable for capturing the
local shape deformation between facial curves. For-
mally, for any curve in the space of R
3
, β: I → R
3
,
where I = [0,1], it is first represented mathematically
by the square-root velocity function q(t), according
to: q(t) =
˙
β(t)
√
k
˙
β(t)k
(Srivastava et al., 2011). With the
L
2
norm k·k scaled to 1, the space of such functions:
C = {q : I → R
3
,kqk = 1} ⊂ L
2
(I,R
3
) becomes a
Riemannian manifold with the L
2
metric on its tan-
gent spaces. Since kqk= 1, C is a also a Hypersphere
in the Hilbert space L
2
(I,R
3
). Given two curves
β
1
and β
2
, they are first represented by the square-
root velocity function, then unified to q
1
and q
2
with
kqk = 1. The geodesic path ψ
∗
between q
1
,q
2
on the
manifold C is given by the minor arc of great circle
connecting them on this Hypersphere, ψ
∗
: [0,1] → C
given by (1),
ψ
∗
(τ) =
1
sin(θ)
(sin((1 −τ)θ)q
1
+ sin(θτ)q
2
) (1)
where θ = d
C
(q
1
,q
2
) = cos
−1
(
h
q
1
,q
2
i
) is the angle
between q
1
and q
2
. The tangent vector field on this
geodesic
˙
ψ
∗
: [0,1] → T
ψ
(C ) is then given by (2):
˙
ψ
∗
=
dψ
∗
dτ
=
−θ
sin(θ)
(cos((1 −τ)θ)q
1
−cos(θτ)q
2
)
(2)
Knowing that on a geodesic path, the covariant deriva-
tive of its tangent vector field is equal to 0. Thus,
˙
ψ
∗
|
τ=0
is sufficient to represent this vector field. Ac-
cordingly, (2) becomes:
˙
ψ
∗
|
τ=0
=
θ
sin(θ)
(q
2
−cos(θ)q
1
) (3)
With the magnitude of
˙
ψ
α
∗
at each all the N indexed
points of the curve, we build a Dense Scalar Field
(DSF) , V = {k
˙
ψ
∗
|
(τ=0)
(k)k, k = 1,2,3,..,N}, which
quantifies the shape difference between two curves.
In our approach, the raw 3D face scans are first
pre-processed for hole-filling, cropping, smoothing
and pose normalization, and then represented by a
set of parameterized radial curves emanating from
the nose tip of the preprocessed face denoted with S.
The radial curve that makes an clockwise angle of α
with the radial curve which passes through the fore-
head (β
0
) is denoted as β
α
, and the neighbor curve
of β
α
that has an angle increase of ∆α is denoted as
β
α+∆α
. Such representation can be seen as a approx-
imation of the preprocessed face S. To extract the
DSF features, one need to first define the correspon-
dence of curves in pair-wise shape comparison. With
four different perspectives from face perception, we
define four different types of correspondence in pair-
wise shape comparison, which results into four dif-
ferent types of DSF features with all the radial curves
considered in a face, namely the Symmetry DSF, the
Averageness DSF, the Spatial DSF and the Gradient
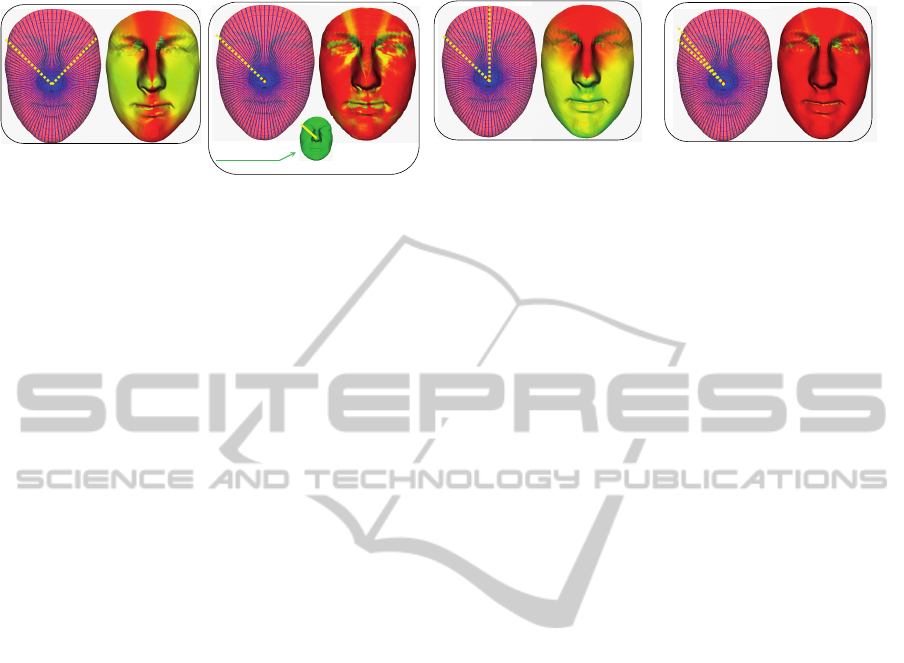
DSF. Figure 1 gives an illustration of these DSF fea-
tures. The Symmetry DSF shown in sub-figure (a)
captures the deformation between a pair of bilateral
symmetrical radial curves (β
S
α
and β
S
2π−α
) in a pre-
processed face S. The Symmetry DSF conveys the
idea that the bilateral facial symmetry loses with age.
The Averageness DSF shown in sub-figure (b) com-
pares a pair of curves with the same angle index from
a preprocessed face β
S
α
and an average face template
β
T
α
. The average face template T (as presented in sub-
figure (b)) is defined as the middle point of geodesic
deformation path from a representative male scan to
a representative female scan. The Averageness DSF
VISAPP2014-InternationalConferenceonComputerVisionTheoryandApplications
8
(a)
Template Face
(b)
(c)
(d)
Figure 1: Illustrations of different DSFs on preprocessed face S. (a) Symmetry DSF: the DSF from radial curve β
S
α
to its
bilateral symmetrical curve β
S
2π−α
; (b) Averageness DSF: DSF from radial curve β
S
α
in a preprocessed face to radial curve β
T
α
in an average face template (with the same angle index α); (c) Spatial DSF: DSF from radial curve β
S
α
to the middle radial
curve β
S
0
in the forehead; (d) Gradient DSF: DSF from radial curve β
S
α
to its neighbor curve β
S
α+∆α
.
represents the idea that faces become more person-
alized and thus deviates more from the average face
shape with age. The Spatial DSF shown in sub-figure
(c) captures the deformation of a curve β
α
to one ref-
erence radial curve β
0
in the forehead in a prepro-
cessed face S. As β
0
is the most rigid curve in the
face, the Spatial DSF can be perceived as the cumula-
tive deformation from the most rigid part of the face.
The Gradient DSF shown in sub-figure (d) captures
the deformation between a pair of neighbor curves
(β
S
α
and β
S
α+∆α
) in a preprocessed face S. In contrast
with the Spatial DSF, the Gradient DSF can be viewed
as a representation of local deformation on the face.
In each sub-figure of Figure 1, the left part shows the
extracted radial curves in the face and correspondence
for curve comparison, the right part shows the cor-
responding DSF features as color-map on the face,
where on each face point, the hotter the color, the
lower of the DSF magnitude.
4 RANDOM FOREST
REGRESSION
Age estimation can be considered as a classification
problem, when each age is taken as a class label. On
the other hand, age estimation can also be considered
as a regression problem, since the age could be inter-
preted as continuous value. Note that there are only
15 subjects of more than 40 years old in FRGCv2,
the number of faces is too small to train classifiers
for those ages. Thus, in our approach, we take the
age estimation as a regression problem. Similar rea-
son has been used by (Guo et al., 2009) for choosing
the regression strategy for age estimation on the FG-
net dataset, where the images from old subjects are
also rare. As summarized by (Criminisi and Shotton,
2013), the regression task is, given a labeled set of
training data, learning a general mapping which asso-
ciates previously unseen, independent test data points
with their dependent continuous output prediction. In
the work of (Montillo and Ling, 2009), Random For-
est regression has demonstrated nice age estimation
performance (3.43 MAE) in LOPO experiments for
the young age subset of the FG-net dataset. As far
as we concern, no studies have investigated the age
estimation performance of Random Forest with the
overall age distribution. Thus, we adopt the Ran-
dom Forest in our regression experiments to demon-
strate its capability in age estimation. Technically,
Random Forest is an ensemble learning method that
grows many classification trees t ∈{t
1
,..,t
T
}. To esti-
mate age from a new face from an input vector (DSF-
based feature vector v = V
k
α
), each tree gives a re-
gression result and the forest takes the average of es-
timated ages as the final result. In the growing of
each tree, two types of randomness are introduced
consecutively. Firstly, a number of N instances are
sampled randomly with replacement from the original
data, to make the training set. Then, if each instance
comprises of M input variables, a constant number m
(m<<M) is specified. At each node of the tree, m
variables are randomly selected out of the M and the
best split on these m variables is used to split the node.
The process goes on until the tree grows to the largest
possible extent without pruning, where the resulted
subsets of the node are totally purified in label.
5 EXPERIMENTS
Our experiments are carried out with Random For-
est Regression on FRGCv2 dataset. The FRGCv2
dataset was collected by researchers from the Uni-
versity of Notre Dame and contains 4007 3D near-
frontal face scans of 466 subjects, where 203 are fe-
male and 263 are male (Phillips et al., 2005). The
age of subjects ranges from 18 to 70, with 92.5%
Can3DShapeoftheFaceRevealyourAge?
9

in the 18-30 age group. Our experiments are per-
formed with the 466 earliest scans of each subject
in FRGCv2. With the 466 earliest scans, we design
two experiment protocols. The first protocol, named
Gender-General-Protocol (GGP), experiments on the
466 scans directly with Random Forest Regression.
While the second protocol, named Gender-Specific-
Protocol (GSP), separates the 466 scans into male
group and female group first, and then performs ex-
periments on each group separately with Random
Forest Regression. For all the two protocols, exper-
imental results are generated using the Leave-One-
Person-Out (LOPO) cross-validation strategy, where
each time one scan of the concerning data (all 466
scans or scans of each gender) is used as testing face
once, with the rest the scans used in training. Thus,
there are altogether 466 experiments in the cross-
validation in each protocol, and each scan is tested
equally only once.
5.1 Gender-general Experiment
As described above, with the Gender-General-
Protocol (GGP), we perform Leave-One-Person-Out
cross-validation experiments directly with the 466
earliest scans of FRGCv2 dataset for each descriptor.
Each time one scan is picked out for testing and the
rest 465 scans are used for training. Table 1 shows
the experimental results as the mean of the absolute
error between the truth and the estimated age for each
tested scan in corresponding age group. By taking
the minimum value of the estimated ages given by the
four descriptors as the age estimation result, we have
also obtained the fusion results, as shown also in Ta-
ble 1. From this table, we observe that we achieve a
minimum overall mean absolute error (MAE) about
3.7 years by the Averageness and Spatial DSFs. For
the other three descriptors, the overall mean absolute
errors are a little higher, while all of them are under 4
years. Thus, from the perception of the overall mean
absolute errors, we find that our approaches with all
of the four descriptors are effective in age estimation.
Moreover, when we go inside of the details of these
results for each age group, we find that the age es-
timation performance declines significantly with ag-
ing. We assume that the big decrease of the number of
scans in aged groups (from about 200 to about 20) ac-
counts largely for this performance decline. From the
same table, we also observe that the fusion method,
which takes the minimum of the estimated ages con-
cerning each of the four descriptors, yields a better
overall mean absolute error of 3.29 years. It means
that the age related cues in these descriptors are dif-
ferent and complimentary in age estimation. When
going inside of the detail of the fusion result for each
age group, we find the enhancement of overall perfor-
mance is mainly coming from young age groups. It
is probably due to the fact that for young age groups,
more scans are available in training for each descrip-
tor. Thus the estimation results from each descriptor
for young age groups are less biased for making the
fusion decision.
Table 1: Age estimation results for different age groups with
the Gender-General-Protocol. (MAE:Mean Absolute Error;
AVR: Averageness; SYM: symmetry; GRA: gradient; SPA:
spatial; MIN: minimum rule for fusion).
Age
group
MAE
AVR
MAE
SYM
MAE
GRA
MAE
SPA
Fuse
MIN
] of
scans
≤ 20 3.48 3.43 3.77 3.30 2.20 185
(20,30] 2.18 2.58 2.32 2.38 1.98 246
(30,40] 9.99 7.60 10.05 8.92 9.18 20
> 40 24.82 23.66 24.56 25.36 25.75 15
Overall 3.76 3.79 3.94 3.76 3.29 466
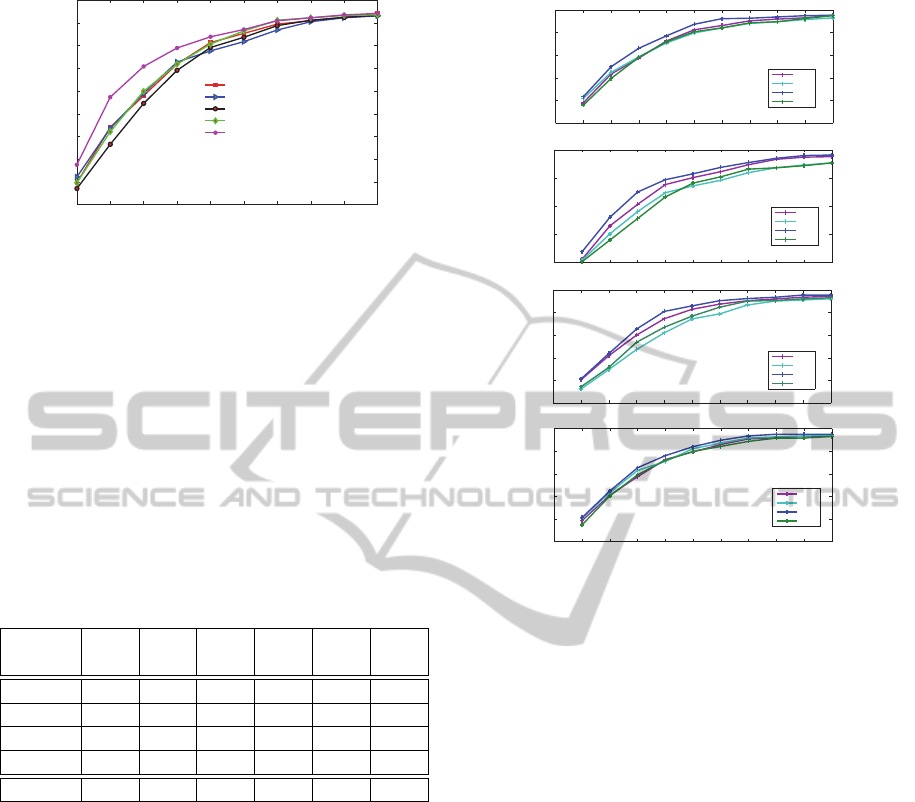
Figure 2 shows the experimental results of
Gender-General-Protocol by cumulative scores for
the four descriptors. The x-axis is the level of Mean
Absolute Error, which represents the mean of the ab-
solute age error (between the truth and estimated age
of scan) over the 466 scans. The y-axis show the cu-
mulative score of accuracy by percentage of accep-
tance. Thus, a point (a,b) on the curve shows, with a
Mean Absolute Error tolerance of a years, it achieves
an acceptance of b percent. We have also captured the
fusion result in the same figure by cumulative scores.
From Figure 2, we observe that with a Error Level
of 5 years, we achieve an acceptance of more than
75% over the 466 scans; when the Error Level is 10
years, the cumulative score of acceptance increases to
more than 90%. We also observe that the fusion re-
sult is significantly higher compared with the result of
each individual descriptor. From these observations,
we claim again that our approach concerning all these
descriptors are comparably effective in age estima-
tion, and the result-level fusion of these descriptors
enhances the age estimation performance.
5.2 Gender-specific Experiment
Gender and age are natural co-variates in human face.
In (Samal et al., 2007), Ashok Samal et al. statisti-
cally confirm that sexual dimorphism is strong and
widespread among face features, and find out the de-
gree of dimorphism changes as a function age (e.g.,
the average age at which the sexual dimorphism be-
comes more significant is around 13). Thus, the face
aging effect is considerably different with different
VISAPP2014-InternationalConferenceonComputerVisionTheoryandApplications
10
1 2 3 4 5 6 7 8 9 10
10
20
30
40
50
60
70
80
90
100
Error Level (years)
Cumulative Score−ACCURACY (%)
Averageness + RF regression
Symmetry + RF regression
Gradient + RF regression
Spatial + RF regression
Fusion−Min
Figure 2: Age regression results in Leave-One-Person-Out
experiment with the Gender-General-Protocol.
gender. In the experiments considering the Gender-
Specific-Protocol (GSP), we first separate the 466
earliest scans of FRGCv2 into male group and fe-
male group, then we perform Leave-One-Person-Out
cross-validation experiments on male scans and fe-
male scans separately for each descriptor. As in the
GGP experiments, each time we take one scan in test-
ing and the rest scans in training. The final results for
each descriptor are generated by statistically merging
the results from each gender.
Table 2: Results for different age groups with the Gender-
Specific-Protocol. (MAE:Mean Absolute Error; AVR: Av-
erageness; SYM: symmetry; GRA: gradient; SPA: spatial).
Age
group
MAE
AVR
MAE
SYM
MAE
GRA
MAE
SPA
Fuse
MIN
] of
scans
≤ 20 3.25 3.38 3.46 3.19 2.14 185
(20,30] 2.03 2.16 2.14 2.18 2.04 246
(30,40] 8.97 8.52 9.18 8.81 10.43 20
> 40 20.81 22.59 21.32 22.22 24.05 15
Overall 3.42 3.57 3.58 3.51 3.15 466
Table 2 shows the experimental results as the
mean of the absolute error between the truth and the
estimated age for each tested scan in corresponding
age group. From Table 2, we observe that for all
the four descriptors, we always achieve better over-
all performance with GSP. We also achieve better re-
sults in each age group with all these descriptors,
except for the symmetry descriptor in the (30,40]
age group. With these observations, which indicate
that the Gender-Specific-Protocol outperforms the
Gender-General-Protocol in age estimation, we con-
firm the claims in (Samal et al., 2007), that faces of
different gender convey considerably different mor-
phology of aging. Moreover, the overall fusion result
outperforms again the result of each descriptor in the
GSP experiments, and also the overall fusion result in
the GGP experiments. It shows again that the result-
level fusion of these descriptors can enhance the age
0 1 2 3 4 5 6 7 8 9 10
0
20
40
60
80
100
Error Level with Average Description (year)
Cumulative Score−ACCURACY (%)
0 1 2 3 4 5 6 7 8 9 10
20
40
60
80
100
Error Level with Symmetry Description (year)
Cumulative Score−ACCURACY (%)
0 1 2 3 4 5 6 7 8 9 10
0
20
40
60
80
100
Error Level with Gradient Description (year)
Cumulative Score−ACCURACY (%)
0 1 2 3 4 5 6 7 8 9 10
0
20
40
60
80
100
Error Level with Spatial Description (year)
Cumulative Score−ACCURACY (%)
M466
F466
M263
F203
M466
F466
M263
F203
M466
F466
M263
F203
M466
F466
M263
F203
Figure 3: Comparison of results from the Gender-General-
Protocol (GGP) and the Gender-Specific-Protocol (GSP)
for each gender. (M-gender-general: male group in GGP
experiments; F-gender-general: female group in GGP ex-
periments; M-gender-specific: male group in GSP exper-
iments; F-gender-specific: female group in GSP experi-
ments.)
estimation performance.
Figure 3 makes a further comparison between
the GGP and GSP experiments, with the cumulative
scores for each gender and for each descriptor in these
two type of experiments. From Figure 3, we observe
that, only except for the beginning part of result with
the female group and symmetry descriptor, the experi-
mental results are always significantly higher for both
male and female groups in the GSP experiments for
all the descriptors. That is to say, although trained
with less data, the GSP experiments have the advan-
tage of giving better age regression results. One prob-
able explanation for this observation is that, in the
GSP experiments, the regression results do not suf-
fer the influence from the scans in the other gender,
which conveys a significantly different aging mor-
phology. With Figure 3, we further confirm that the
aging effect differs with gender.
Can3DShapeoftheFaceRevealyourAge?
11

6 CONCLUSIONS
In this paper, we presented the first work in age es-
timation based on 3D facial scans. Our approach
uses the DSF features extracted from 3D face from
four different perspectives of face perception. Fol-
lowing the Leave-One-Person-Out experimental set-
ting when using the Random Forest Regression strat-
egy, we have achieved comparable age estimation re-
sults with all the four descriptions. And with the age
estimation results improved in their fusion, we have
confirmed that the four perspectives produce compli-
mentary information for age estimation. By investi-
gating the age estimation separately on Female and
Male subsets, we have achieved better age estimation
results, which justifies that the general aging effect of
face differs considerably with gender.
ACKNOWLEDGMENTS
This work was supported by the ANR through the 3D
Face Analyzer project under the contract ANR 2010
INTB 0301 01 and by the Chinese Scholarship Coun-
cil (CSC) to Baiqiang Xia.
REFERENCES
Bruce, V., Burton, M., Doyle, T., and Dench, N. (1989).
Further experiments on the perception of growth in
three dimensions. 46(6):528–536.
Clinton S. Morrison, Benjamin Z. Phillips, J. T. C.
S. R. S. H. O. T. (2011). The relation-
ship between age and facial asymmetry. In
http://meeting.nesps.org/2011/80.cgi.
Cootes, T. F., Edwards, G. J., and Taylor, C. J. (1998). Ac-
tive appearance models. In Computer Vision ECCV98,
pages 484–498.
Criminisi, A. and Shotton, J. (2013). Regression forests.
In Decision Forests for Computer Vision and Medical
Image Analysis, pages 49–58.
Drira, H., Ben Amor, B., Daoudi, M., Srivastava, A., and
Berretti, S. (2012). 3D dynamic expression recog-
nition based on a novel deformation vector field and
random forest. In ICPR, pages 1104–1107.
Drira, H., Ben Amor, B., Srivastava, A., Daoudi, M., and
Slama, R. (2013). 3d face recognition under expres-
sions, occlusions, and pose variations. IEEE Trans.
Pattern Anal. Mach. Intell., 35(9):2270–2283.
Fu, Y., Guo, G., and Huang, T. S. (2010). Age synthesis
and estimation via faces: A survey. In IEEE Trans-
actions on Pattern Analysis and Machine Intelligence,
volume 32, pages 1955–1976.
Geng, X., Zhou, Z.-H., and Smith-Miles, K. (2007). Au-
tomatic age estimation based on facial aging patterns.
29(12):2234–2240.
Geng, X., Zhou, Z.-H., Zhang, Y., Li, G., and Dai, H.
(2006). Learning from facial aging patterns for au-
tomatic age estimation. In Proceedings of the 14th
annual ACM international conference on Multimedia,
pages 307–316. ACM.
Guo, G., Fu, Y., Dyer, C. R., and Huang, T. S.
(2008a). Image-based human age estimation by man-
ifold learning and locally adjusted robust regression.
17(7):1178–1188.
Guo, G., Fu, Y., Huang, T. S., and Dyer, C. R. (2008b).
Locally adjusted robust regression for human age es-
timation. In Applications of Computer Vision, 2008.
WACV 2008. IEEE Workshop on, pages 1–6. IEEE.
Guo, G., Mu, G., Fu, Y., and Huang, T. S. (2009). Human
age estimation using bio-inspired features. In Com-
puter Vision and Pattern Recognition, 2009. CVPR
2009. IEEE Conference on, pages 112–119.
Han, H., Otto, C., and Jain, A. K. (2013). Age estimation
from face images: Human vs. machine performance.
In The 6th IAPR International Conference on Biomet-
rics (ICB).
Lakshmiprabha, N., Bhattacharya, J., and Majumder, S.
(2011). Age estimation using gender information. In
Computer Networks and Intelligent Computing, pages
211–216.
Lanitis, A. (2010). Facial age estimation. In Scholarpedia,
volume 5, page 9701.
Lanitis, A., Draganova, C., and Christodoulou, C. (2004).
Comparing different classifiers for automatic age es-
timation. In Systems, Man, and Cybernetics, Part B:
Cybernetics, IEEE Transactions on, volume 34, pages
621–628. IEEE.
Lanitis, A., Taylor, C. J., and Cootes, T. F. (2002). Toward
automatic simulation of aging effects on face images.
In Pattern Analysis and Machine Intelligence, IEEE
Transactions on, volume 24, pages 442–455. IEEE.
Li, C., Liu, Q., Liu, J., and Lu, H. (2012). Learning ordinal
discriminative features for age estimation. In Com-
puter Vision and Pattern Recognition (CVPR), 2012
IEEE Conference on, pages 2570–2577.
Mark, L. S. and Todd, J. T. (1983). The perception of
growth in three dimensions. 33(2):193–196.
Montillo, A. and Ling, H. (2009). Age regression from
faces using random forests. In Image Processing
(ICIP), 2009 16th IEEE International Conference on,
pages 2465–2468. IEEE.
Park, U., Tong, Y., and Jain, A. K. (2010). Age-invariant
face recognition. 32(5):947–954.
Phillips, P. J., Flynn, P. J., Scruggs, T., Bowyer, K. W.,
Chang, J., Hoffman, K., Marques, J., Min, J., and
Worek, W. (2005). Overview of the face recogni-
tion grand challenge. In Computer vision and pattern
recognition, CVPR 2005, volume 1, pages 947–954.
Ramanathan, N., Chellappa, R., and Biswas, S. (2009).
Computational methods for modeling facial aging: A
survey. 20(3):131–144.
Rhodes, M. G. (2009). Age estimation of faces: a review.
In Appl. Cognit. Psychol, volume 23, pages 1–12.
Samal, A., Subramani, V., and Marx, D. (2007). Analysis
of sexual dimorphism in the human face. In Journal
VISAPP2014-InternationalConferenceonComputerVisionTheoryandApplications
12

of Visual Communication and Image Representation,
pages 453–463.
Srivastava, A., Klassen, E., Joshi, S. H., and Jermyn, I. H.
(2011). Shape analysis of elastic curves in euclidean
spaces. In Pattern Analysis and Machine Intelligence,
volume 33, pages 1415–1428. IEEE.
Suo, J., Zhu, S.-C., Shan, S., and Chen, X. (2010). A com-
positional and dynamic model for face aging. vol-
ume 32, pages 385–401.
Ueki, K., Sugiyama, M., and Ihara, Y. (2010). Perceived age
estimation under lighting condition change by covari-
ate shift adaptation. In Pattern Recognition (ICPR),
2010 20th International Conference on, pages 3400–
3403. IEEE.
Wu, T., Turaga, P., and Chellappa, R. (2012). Age esti-
mation and face verification across aging using land-
marks. volume 7, pages 1780–1788.
Can3DShapeoftheFaceRevealyourAge?
13
