
Template-based Treemaps to Preserve Spatial Constraints
Natallia Kokash
1
, Bernard de Bono
2
and Joost Kok
1
1
Leiden Institute of Advanced Computer Science (LIACS), Leiden, The Netherlands
2
Imperial College London, London, U.K.
Keywords:
Information Visualization, Treemaps, Constraints, Templates.
Abstract:
Treemapping is a method for displaying hierarchical data using nested rectangles. Each branch of the tree
is given its rectangle, which then is tiled with smaller rectangles representing sub-branches. A node’s shape
has an area proportional to a specified dimension of the data. To create a treemap, one must define a tiling
algorithm, i.e., a way to divide a rectangle into sub-rectangles of specified areas. There are several problems
with existing tiling algorithms: (i) they allow tiles to shift when the main window or some of the tiles are
resized affecting the user perception of the information; (ii) they do not allow users to place selected elements
into desired positions w.r.t. each other. In this paper, we present a method for creating treemaps with cus-
tomized layouts. The method is based on reusable templates and supports zooming into specific areas of the
treemap without affecting its initial layout. We illustrate the use of template-based treemaps to the visualiza-
tion of biomedical data. Furthermore, we present an algorithm for automated generation of layouts satisfying
positional constraints for a particular class of constraints.
1 INTRODUCTION
Treemaps (Johnson and Shneiderman, 1991) are an
effective technique to visualize two-dimensional hier-
archical data by using nested shapes in a space-filling
layout. The standard shape is the rectangle, but other
shapes and variations, e.g., circular treemaps (Fischer
et al., 2012; Wetzel, 2006) and Voronoy diagram-
based subdivisions (Balzer and Deussen, 2005), have
been used. Each shape represents a geometric region,
which can be subdivided recursively into smaller re-
gions. At each level of recursion, some attribute of
interest is displayed, e.g., with the help of shape color.
Nodes in a treemap, also called tiles, represent
individual data items in a dataset. Node size, color
and text label can be used to represent attributes of
the data item. One-layered treemaps can display data
attributes but are not very good at emphasizing the
place of an item in the overall hierarchical structure.
To compensate for that, a small fixed margin with
structural labels are typically used. In treemaps dis-
playing hierarchical structures, it is possible to nav-
igate among different layers and zoom into selected
tiles (Blanch and Lecolinet, 2007). A more complete
overview of treemap development history and appli-
cations can be found in (Shneiderman, 2009).
To create a treemap, one must define a tiling algo-
rithm - a way to divide a rectangle into sub-rectangles
of specified areas. In most tiling algorithms, the node
position does not precisely represent any character-
istic of the data. This can reduce the clarity of the
representation by violating user expectations to locate
certain item in a certain place. The same data can be
represented in arbitrarily different looking treemaps
depending on the treemap dimensions and ordering
of nodes. Even if the same tiling algorithm is used
for the identical datasets, their visual representations
may vary drastically. The ability of the tiling algo-
rithm to preserve locations of individual data items
upon changes of visualization and dataset parameters
is referred to as stability. Most of the tiling algorithms
target at optimizing metrics other than stability. An
average aspect ratio (the longest side of a rectangle
divided by its shortest side), and whether the natural
order of the dataset is preserved in its visualization
are two important characteristics (Wattenberg, 2005).
Among the most commonly used tiling algorithms
are slice and dice (Johnson and Shneiderman, 1991),
squarify (Bruls et al., 2000), strip (Bederson et al.,
2002), and their numerous variations. These al-
gorithms do not guarantee the complete adherence
to two-dimensional spatial constraints. For exam-
ples, Figure 1 shows how the representation of the
same hierarchical structure using the squarify algo-
39
Kokash N., de Bono B. and Kok J..
Template-based Treemaps to Preserve Spatial Constraints.
DOI: 10.5220/0004684900390049
In Proceedings of the 5th International Conference on Information Visualization Theory and Applications (IVAPP-2014), pages 39-49
ISBN: 978-989-758-005-5
Copyright
c
2014 SCITEPRESS (Science and Technology Publications, Lda.)

Figure 1: Unstable treemap layouts.
rithm (Bruls et al., 2000) changes when the propor-
tions of the display area are changed.
The need for a tiling algorithm that allows users
to control treemap layouts has been pointed out
in (de Bono et al., 2012). This work applies treemaps
to automatically generate biomedical maps from pub-
licly available data sources by overlaying the informa-
tion about blood vessels, proteins, gene expressions,
cells, drug and disease mechanisms, etc. over graph-
ical schematics of human body anatomy. In these
treemaps,
• it is expected that spatial relations and constraints
on relative node positioning among body parts are
always preserved,
• there should be a possibility to filter the dataset by
showing only selected tiles of interest to a certain
user without affecting the visual stability of the
corresponding treemap.
The concepts of a constrained treemap layout and
custom user templates have emerged, but no generic
methods to build such templates have been developed.
In this paper, we address the problem of build-
ing customized and controlled treemap layouts. First,
we describe our effort to control tile positions using
a constraint solver (Section 2). Then we introduce
a concept of a template: a hierarchical structure that
allows users to pose constraints on relative tile posi-
tioning (Section 3). We present a graphical tool to cre-
ate such templates and a tool to draw treemaps with
customized layouts by binding such templates with
treemap datasets using an example from the biomed-
ical domain (Section 4). Furthermore, we introduce
a problem of automated generation of templates to
satisfy spatial constraints and provide an algorithm to
generate such templates for a particular class of con-
straints (Section 5). Finally, we provide an overview
of the state of the art on data visualization using
treemaps (Section 6), conclude the paper and discuss
future work (Section 7).
2 CONSTRAINING TREEMAP
LAYOUTS
The work on treemap generalization (de Bono et al.,
2012; Tsiaras et al., 2009) inspired us to apply a
(a) Basic layout (b) Width > height
Figure 2: Layouts found by the constraint solver.
constraint solver to build layouts for a general set
of geometric constraints. We encoded the conditions
for a desired treemap layout and employed Z3 SMT
solver (de Moura and Bjrner, 2008) to find solutions
for data with constraints on the aspect ratio of treemap
tiles. As a tiling algorithm is typically a recursive
procedure, it is sufficient to show how tiles are allo-
cated on one level. Our general approach is outlined
in Figure 1. This listing shows a pseudocode for a
constraint satisfaction problem (CSP) that for a given
display area defined by its left top corner coordinates
and dimensions and a list of n elements that should
be placed in this area returns positions and dimen-
sions of treemap rectangles. The constraints define
bounds on element positions and dimensions, and re-
quire that any two rectangles should not intersect. The
sum of areas of all rectangles should be equal to the
main area. Finally, any custom constraints on element
positions, dimensions, adjacency etc. can be defined.
We applied the presented algorithm to find a
treemap layout for a simple tree consisting of a root
node with three children elements. A custom con-
straint here is a requirement that the width of rectan-
gles should be larger than their height. The solution
for the CSP with no custom constraints is shown in
2(a). It is found in less than a second, while to find
a solution for the layout with the additional constraint
(Figure 2(b)) the solver needed several minutes. Thus,
while it is feasible to build treemap layouts with any
desired properties using a constraint solver, the ap-
proach is too slow for ad-hoc visualization. Even
in trivial cases, the SMT solver may fail to satisfy
the constraints due to their non-linear nature or large
search space. The stability of the layouts is not guar-
anteed either.
From this we conclude that the search space for
possible layouts should be restricted to some geomet-
rical pattern. For example, the strip (Bederson et al.,
2002) algorithm allows only layouts composed of hor-
izontal or vertical stripes at each level. Although this
algorithm produces ordered treemaps, it is not suffi-
cient for our goals due to its instability (elements may
jump from one line to another when element sizes are
changed) and inability to impose two-dimensional po-
sitioning constraints.
IVAPP2014-InternationalConferenceonInformationVisualizationTheoryandApplications
40

/*Define terms representing the position and dimensions of the main tile */
x
0
← 0; y
0
← 0; w
0
← area.width; h
0
← area.height;
/*Define arrays x,y, h,w of terms representing the positions and dimensions of its children, 0 < i ≤ n */
/*The dimensions of each child should not exceed the dimensions of the main rectangle */
for 0 < i ≤ n do
assertCnstr ((x
i
≥ 0) ∧ (y
i
≥ 0) ∧ (w
i
> 0) ∧ (h
i
> 0));
assertCnstr (((x
i
+ w
i
) ≤ (x
0
+ w
0
)) ∧ ((y
i
+ h
i
) ≤ (y
0
+ h
0
)));
end
/*Rectangles should not intersect */
for 0 < i ≤ n do
for 0 < j ≤ n do
assertCnstr (((x
j
+ w
j
≤ x
i
) ∨ (x
i
+ w
i
≤ x
j
)) ∧ ((y
j
+ h
j
≤ y
i
) ∨ (y
i
+ h
i
≤ y
j
)));
end
end
/*Define area constraints for each child rectangle */
for 0 < i ≤ n do assertCnstr ((h
i
∗ w
i
) = w
0
∗ h
0
∗ s
i
.size/ totalSize);
/*The sum of areas of all rectangles should be equal to the main area */
totalArea ← 0;
for 0 < i ≤ n do totalArea ← totalArea + h
i
* w
i
;
assertCnstr (totalArea = w
0
∗ h
0
);
/*Add custom constraints here, solve the CSP */
Algorithm 1: Generic constraint-based tiling algorithm.
The template-based treemapping algorithm we
propose uses the multi-level splitting of a given area
into columns and rows. Two-dimensional constraints
on positions of treemap elements are satisfied by plac-
ing such elements into areas corresponding to differ-
ent branches of a template.
3 DEFINING TEMPLATES
In this section, we describe our method to create tem-
plates for treemap tile allocation.
A template is defined in the form of a tree where
each node has an assigned attribute to represent a ver-
tical split or a horizontal split operation. Leaf nodes
of the tree correspond to the treemap tiles and define
their relative positions. Internal nodes of the tree de-
fine the way the available area is subdivided. Color
or image can be assigned to each node of the tem-
plate (typically, only appearance of leaf nodes mat-
ters). Additionally, one may want to use only part
of the area allocated to the parent rectangle to place
children elements. This can be accomplished with the
help of vertical ratio and horizontal ratio parameters
of a template node. If not the entire area of the tile
is occupied, we can use vertical alignment and hor-
izontal alignment properties with values top, middle,
down and left, center, right, respectively, to position
nested elements within the tile.
A layout defined by a template is build by splitting
the available area at each level using the operation de-
fined in template nodes. All the leaf tiles of the tem-
plate that appear on the top level of such a treemap
will always remain at the same relative positions to
(a) Template
(b) Defined layout
Figure 3: Template builder.
each other. Figure 3 shows our template builder fea-
turing a sample template with 6 tiles. At the first level,
the entire area is split into 2 columns. At the second
level, the second column is split into 2 rows. At the
third level, the bottom row is split into 2 columns and,
finally, its first column is split into 3 rows. Figure 3(b)
shows the rendering of the template.
The graphical editor prototype we used
to create this template is available at
Template-basedTreemapstoPreserveSpatialConstraints
41

http://nkokash.com/apinatomy. The defined tem-
plates can be exported to files and reconstructed from
such files when bound to treemap items. The number
of leaf items in the template should coincide with the
number of the children of the tile it is assigned to.
The customized treemap can be stored and further
reused without the need to reassign templates.
Algorithm 2 computes positions and dimensions
of tiles representing children of each treemap item.
Each slice is allocated the area proportional to the to-
tal area of all its items w.r.t. to the total area of all
items in the parent rectangle. The allocation of the
corresponding area is controlled either by the width
or by the height of the strip while its other dimension
remains unchanged at this level. The leaf nodes of
the template tree define the layout for a single level
of a treemap. In order to keep the algorithm simple,
we omit the processing of scaling and alignment at-
tributes.
4 TEMPLATE-BASED
TREEMAPS
In this section, we illustrate the application of tem-
plates to control the positions of tiles in a treemap
representing human anatomy.
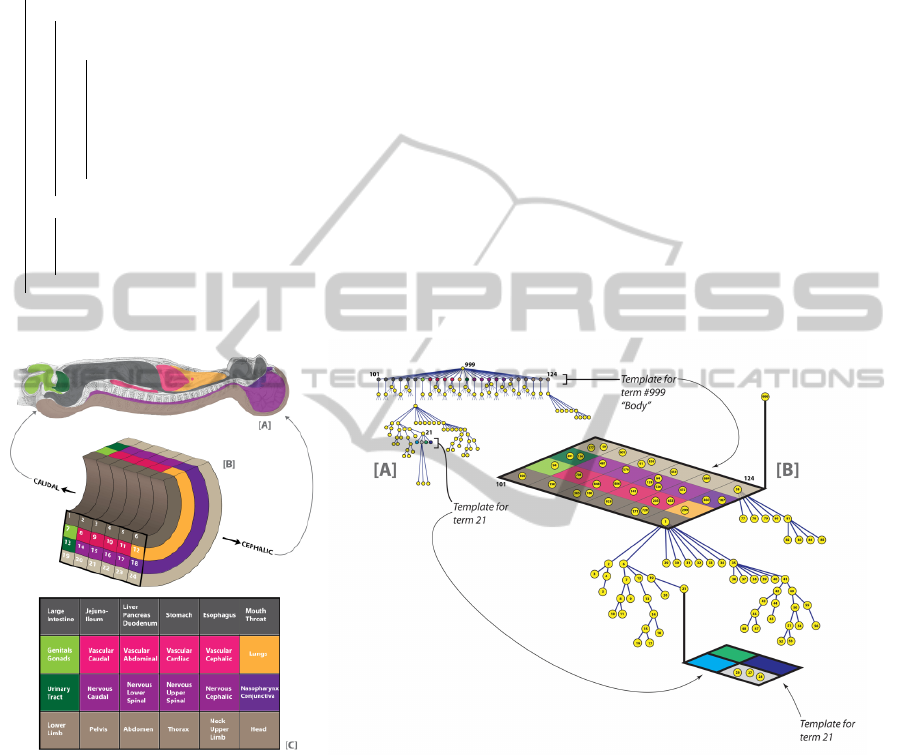
Our example is explained in Figure 4 which de-
picts a longitudinal section through the middle of the
male human body showing the external and internal
surfaces, and organs. From this view, we obtain an
idealized radially symmetric body plan, apportioned
over cylindrical regions. Each of the organs in the
plan is composed of multiple tissues and sub-organs,
the structural information about them is obtained from
the Foundational Model of Anatomy (FMA) ontol-
ogy
1
. As the visualization of the full ontology may
obscure the details a user is interested to see, it is es-
sential for the visualization tool to support data fil-
tering across multiple levels and contextual zooming
into selected areas. The user should be able to create a
custom view with the internal structure of the selected
body parts placed in a way that simplifies the analysis
of these data.
We reproduce this view on human anatomy in our
prototype. The first level of the “Body” treemap con-
sists of 24 equal-size tiles. The template that controls
this layout consists of 4 rows, each in its turn contains
6 columns. We illustrate how the template-based al-
gorithm works by assigning the template created in
the previous section to the item “6000002: Liver Pan-
1
Foundational Model of Anatomy -
http://sig.biostr.washington.edu/projects/fm/.
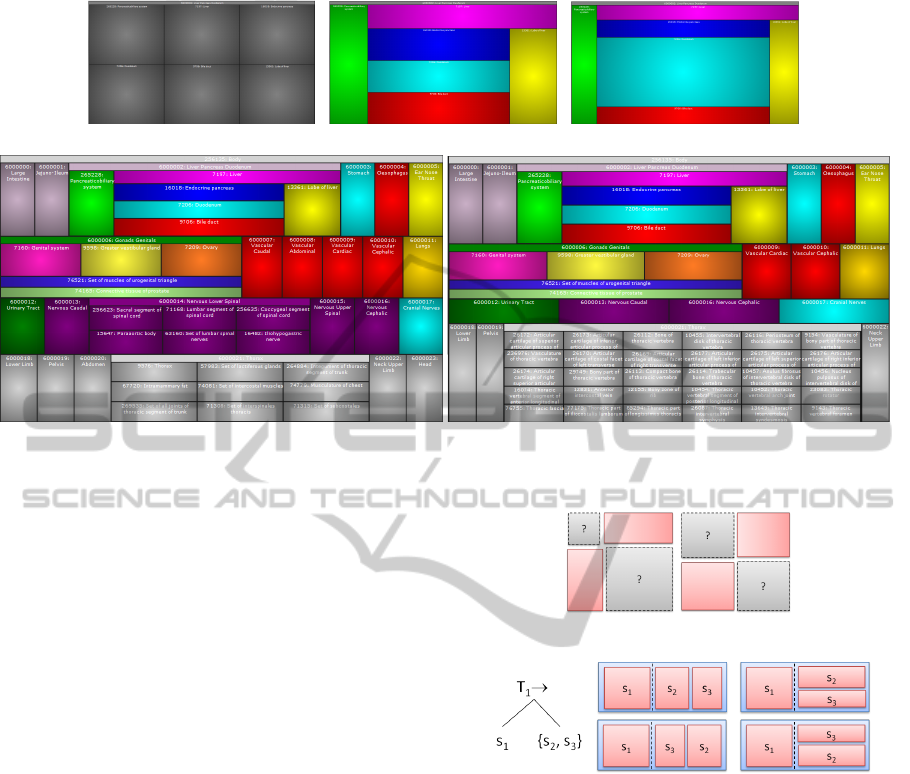
creas Duodenum”. Its initial layout (tiles are placed in
a grid) is shown in Figure 5(a). Figure 5(b) shows the
allocation of the tile children according to the prede-
fined template. Note that in contrast to the Figure 3(b)
where we emphasized the splitting defined in the tem-
plate, the treemap layout is formed to preserve the ra-
tio among item sizes (all equal in this case). To en-
large a certain area of a template-based treemap, it is
sufficient to update the size dimension of the item.
Figure 5(c) demonstrates that the tile relative posi-
tions are preserved after tile resizing. Moreover, if
one decides to filter the treemap to remove items that
are not of interest for data analysis, the remaining tiles
will occupy the available area and their relative posi-
tions will be preserved as well.
The “Body” treemap prototype can be seen at
http://nkokash.com/apinatomy. Several views are
available to illustrate the difference of our approach to
the existing treemapping algorithms, which become
apparent once one modifies the treemap by removing
or including new items or resizing selected tiles. For
example, Figure 5(d) shows two versions of the cus-
tom treemaps for the body anatomy. The left treemap
includes 24 upper level tiles with some details about
the structure of selected parts, including “6000002:
Liver Pancreas Duodenum”. The right image shows a
modification of this treemap where some tiles are re-
moved and the sub-parts of others are shown in more
detail. The overall layout remains stable.
Publicly available ontologies and other resources
maintained by biomedical communities provide a rich
source of information about human body which how-
ever is hard to perceive and process in the existing
form. Treemapping templates we introduced in this
paper provide a quick way to extend these data with
the information about spacial representation of related
concepts in a schematic way. Thus, our approach may
find multiple applications in the area of biomedical
data analysis, e.g., for the generation of teaching ma-
terials or reasoning about large amounts of intercon-
nected data.
5 TEMPLATE GENERATION
We illustrated how a user can control treemap layout
using manually defined templates. In this section, we
consider the problem of generating such templates au-
tomatically.
Multiple variations in the nature and description of
tile positioning constraints are possible. We introduce
here a CSP which consists in finding a treemap layout
satisfying requirements in the form “item x should be
placed left (right) and/or above (below) item y”. More
IVAPP2014-InternationalConferenceonInformationVisualizationTheoryandApplications
42
Input: TreemapItem template - reference to the template associated with a treemap item;
Rect currRect - a rectangle defining the available area for this item;
Output: List hRect i finalRects - a list of tile dimensions for item children;
List hTreemapItem i finalTiles - a list of tiles;
void TemplateBased (TreemapItem template, Rect currRect, List hRect i finalRects, List hTreemapItem i finalTiles)
begin
if template.Children.Count > 1 then
float prevX = currRect.X, prevY = currRect.Y;
foreach TreemapItem subTemplate in template.Children do
float fraction = subTemplate.FinalSize / template.TotalChildrenSize;
float dWidth = currRect.Width, dHeight = currRect.Height;
if template.Split == ”horizontal” then dHeight *= fraction else dWidth *= fraction;
Rect rect = new Rect (prevX, prevY, dWidth, dHeight);
TemplateBased (subTemplate, rect, finalRects, finalTiles);
if template.Split == ”horizontal” then prevY += dHeight else prevX += dWidth;
end
else
/*Leaf tile occupies all available area */
finalRects.add(currRect);
finalTiles.add(template);
end
end
Algorithm 2: Template-based tiling algorithm.
(a) Schematic body plan (b) Visualizing medical ontologies using treemaps
Figure 4: Longitudinal section through the middle of the male human body.
formally, let S be a list of elements with a given di-
mension s.size,s ∈ S. Assume also that for each s ∈ S,
we generate rectangles identified by their top left cor-
ner coordinates, width and height. Thus, we can refer
to s.x, s.y, s.w and s.h as to the x and y coordinates
of the rectangle top left corner, its width and height,
respectively. We write
s
j
→ s
i
, i 6= j iff s
j
.x + s
j
.w ≤ s
i
.x
and
s
j
↑ s
i
, i 6= j iff s
j
.y + s
j
.h ≤ s
i
.y;
Our goal is to generate a treemap layout that satisfies
a system of constraints
C = {s
i
Rs
j
, s
i
,s
j
∈ S,R ∈ {→, ↑}}.
Easy to notice that a set of one-dimensional con-
straints, either {s
i
→ s
j
, s
i
,s
j
∈ S} or {s
i
↑ s
j
, s
i
,s
j
∈
S}, can be satisfied by separating elements s
i
and s
j
into subsets and placing elements of each subset into
a treemap region separated from the regions for other
subsets by vertical or horizontal lines, respectively.
To refer to the transitive constraint satisfaction, we
can write s
j
⇒ s
i
iff there exists s
k
∈ S such that s
j
→
s
k
and s
k
→ s
i
; Analogously, s
j
s
i
iff there exists
s
k
∈ S such that s
j
↑ s
k
and s
k
↑ s
i
. Clearly, the system
Template-basedTreemapstoPreserveSpatialConstraints
43
(a) Default layout (b) With assigned template (c) Zooming
(d) Examples of customized treemaps
Figure 5: Body treemap: customizing tile “6000002: Liver Pancreas Duodenum”.
of constraints is not satisfiable if there exist s
i
,s
j
such
that s
i
⇒ s
j
∧ s
j
⇒ s
i
or s
i
s
j
∧ s
j
s
i
.
We say that a system of constraints
C = C
H
∧C
V
,
where
C
H
= {s
i
⇒ s
j
, s
i
,s
j
∈ S}
and
C
V
= {s
i
s
j
, s
i
,s
j
∈ S}
is orthogonal iff for any s
i
,s
j
such that
(s
i
⇒ s
j
) ∈ C
H
it follows that
(s
i
s
j
) /∈ C
V
.
The orthogonality of vertical and horizontal con-
straints suggest that they can be satisfied in a tem-
plate obtained by dividing the area into subregions
using vertical and horizontal splits. The satisfaction
of non-orthogonal systems of constraints is problem-
atic since we are not able to guarantee the existence
of the solution in the form of the rectangular treemap
without gaps. Figure 6 shows two possible layouts
for a dataset with two elements with non-orthogonal
constraints. Such constraints require elements to be
placed diagonally and remaining empty areas to be
filled with other tiles. It is easy to see that there may
be no items of suitable areas in the dataset to fill these
areas without gaps. An appropriate layout, if it exists,
can be searched for in the form of a CSP as described
in Section 2.
For a dataset with orthogonal constraints, we look
for a suitable layout by constructing and evaluating
Figure 6: Satisfying non-orthogonal constraints.
Figure 7: Building and rendering slicing trees.
all possible slicing trees (Chen et al., 2002; Lai and
Wong, 2001). A slicing tree can be represented us-
ing an infix expression with operands referring to free
tile sets or sub-trees and an operator defining the type
of the split operation. The definition of a slicing tree
essentially coincides with the definition of our tem-
plate: a template can be seen as a slicing tree for the
complete dataset with additional visual attributes. Ev-
ery internal node of a slicing tree represents a vertical
slice satisfying → constraint or a horizontal slice sat-
isfying ↑ constraint. Leaf elements (or atoms in cor-
responding expressions) represent dataset items dis-
played as treemap tiles.
To construct a template for a given set of orthogo-
nal constraints, we dynamically build a set of trees
that satisfy constraints one by one (Algorithm 3).
Thus, given a constraint c = s
i
Rs
j
, we check whether
items s
i
and s
j
are already in the set of slicing trees
IVAPP2014-InternationalConferenceonInformationVisualizationTheoryandApplications
44

obtained at the previous step. If both items are found,
we check whether the constraint c is satisfied. As-
sume that function search(Tree tree, Item s) returns a
path from the item s to the tree root. Using this func-
tion, we find paths path1 and path2 from items s
i
and
s
j
to the tree root. The constraint c is satisfied if the
operator of the node where both paths deviate coin-
cides with the operator in the constraint and the left
handed item s
i
is located to the left from the deviation
point, that is, the next node of the path1 is the left
child of the node at the deviation point.
If only one of the items is in the partial tree (say,
s
i
), we can insert the second item s
j
in such a way that
the constraint c is satisfied. This can be achieved ei-
ther by inserting the missing item in any branch of the
tree that is already separated from the existing item
using the splitting operator in c, or by creating a new
split at the root of the tree or right to the existing item.
If none of the items in the constraint are in the tree, we
create all the permutations containing one of the items
and then add the second item to each of these trees as
in the previous case.
Let us consider an example. Assume we have a
dataset
S = {s
i
,1 ≤ i ≤ 6}
with the following sets of orthogonal constraints
C
H
= {s
1
→ s
2
,s
1
→ s
3
,s
5
→ s
6
}
and
C
V
= {s
2
↑ s
4
,s
3
↑ s
5
,s
6
↑ s
1
}.
For brevity, we use figure brackets {...} to refer to all
possible two-dimensional permutations of elements
we do not need to unfold at a particular step. Figure 7
shows a slicing tree with the first constraint satisfied
and the corresponding treemap layouts. Infix expres-
sions can be used to describe both initial constraints
and the slicing trees at any intermediate step:
c
1
= s
1
→ {s
2
,s
3
}, c
3
= s
6
↑ s
1
,
c
2
= s
5
→ s
6
, c
4
= s
3
↑ s
5
,
c
5
= s
2
↑ s
4
.
The first set of slicing trees T
1
is equivalent to c
1
.
Next, we join a constraint c
2
. Since none of its items
is in T
1
, this case folds into case 4 of the algorithm,
i.e., all permutations are generated:
T
2
= T
1
c
2
:
T
1
2
= (s
1
→ {s
2
,s
3
}) → (s
5
→ s
6
)
T
2
2
= (s
5
→ s
6
) → (s
1
→ {s
2
,s
3
}),
T
3
2
= (s
1
→ {s
2
,s
3
}) ↑ (s
5
→ s
6
),
T
4
2
= (s
5
→ s
6
) ↑ (s
1
→ {s
2
,s
3
}),
T
5
2
= s
1
→ {s
2
,s
3
,(s
5
→ s
6
)},
T
6
2
= {s
1
,(s
5
→ s
6
)} → {s
2
,s
3
}.
Note that the positions of both items from c
3
are pre-
defined in the generated trees. Thus, at this step the
Figure 8: Automatically generated constraint-satisfying
layouts
case 1 of the algorithm is applied and we eliminate
trees that do not satisfy c
3
, leaving options T
4
2
and
T
6
2
, where T
6
2
is further unfolded and filtered to leave
only trees satisfying c
3
:
T
3
= T
2
c
3
:
T
1
3
= (s
5
→ s
6
) ↑ (s
1
→ {s
2
,s
3
}),
T
2
3
= ((s
5
→ s
6
) ↑ s
1
) → {s
2
,s
3
},
T
3
3
= (s
5
→ (s
6
↑ s
1
)) → {s
2
,s
3
}.
The items of constraint c
4
are already positioned,
so we again filter the set T
3
according to the option 1
of the algorithm, leaving T
1
3
as the only valid alterna-
tive:
T
4
= T
3
c
4
= (s
5
→ s
6
) ↑ (s
1
→ {s
2
,s
3
}).
After joining the remaining constraint c
5
= s
2
↑ s
4
according to the case 3 (s
2
is in the tree T
4
while s
4
is a new item), we obtain the following set of slicing
trees:
T
5
= T
4
c
5
:
T
1
5
= (s
5
→ s
6
) ↑ ((s
1
→ {s
2
,s
3
}) ↑ s
4
),
T
2
5
= (s
5
→ s
6
) ↑ (s
1
→ ({s
2
,s
3
} ↑ s
4
)),
T
3
5
= (s
5
→ s
6
) ↑ (s
1
→ {(s
2
↑ s
4
),s
3
}).
If there are items in the data set without positional
constraints, they can be inserted to any place in the fi-
nal slicing trees. Together with two-dimensional per-
mutations of elements {s
2
,s
3
} in the generated solu-
tions, 12 layouts shown in Figure 8 satisfy our ini-
tial constraints. In total we get 11 unique layouts as
layouts 2(d) and 3(a) in Figure 8 represent identical
treemaps because permutations of elements we did
not unfold in slicing trees T
2
5
and T
3
5
yield the same
layouts.
Assuming that we target at finding all accept-
able layouts, in the worst case we need to generate
all two-dimensional permutations of the given set of
tiles. Having in mind that to generate such permuta-
tions each of the items is placed to the left and right
Template-basedTreemapstoPreserveSpatialConstraints
45

Input: List hConstraint i constraints - a list of constraints;
Output: List hTree i slicingTrees - a list of slicing trees satisfying constraints;
List hTree i defineLayout (List hConstraint i constraints)
begin
List hTree i slicingTrees = new List hTree i (new Tree (constraints[0]));
constraints.remove(0);
foreach c in constraints do
List hTree i newSlicingTrees = new List hTree i ();
foreach tree in slicingTrees do newSlicingTrees.addAll(generateTrees (tree, c));
slicingTrees = newSlicingTrees;
end
end
List hTree i generateTrees (Tree tree, Constraint c)
begin
List hConstraint i path1 = search (tree, c.left); List hConstraint i path2 = search (tree, c.right);
/*1. Both items are already in the tree */
if (path1 != null) and (path2 != null) then
/*Find the last common node in the paths */
int i = 0; while path1[path1.length - 1 - i] == path2[path2.length - 1 - i] do i++;
Constraint node = path1[path1.length - i];
/*If the operator in this node coincides with the operator in the constraint and the rest of path1
is in its left branch, the constraint is satisfied. Otherwise, the constraint is violated and the
slicing tree is eliminated. */
if (node == c.operator) and (node.left == path1[path1.length - 1 - i]) then return tree; else return null;
end
List hTree i slicingTrees = new List hTree i;
/*2. Left item is in the tree */
if (path1 != null) and (path2 == null) then
if path1[0] == c.left then
foreach node in path1 do
/*for all ancestors with the same split type located on the same side with the existing item
*/
if (node.operator == c.operator) and (node.parent.left == node) then slicingTrees.addAll(insert (node.right,
c.right));
end
else
/*...analogously, but insert the missing element into the left branch of each ancestor with the
same operator that has the existing item on the right */
end
slicingTrees.add(new Tree (tree, c.constraint, c.right)); slicingTrees.add(new Tree (insert (path1[0], c.right));
end
/*3. Right item is in the tree */
if (path1 == null) and (path2 != null) then
/*...Analogously to the case 2 */
/*4. None of the items is in the tree */
if (path1 == null) and (path2 == null) then
List hTree i newSlicingTrees = insert (tree, c.left);
foreach tree in newSlicingTrees do
/*...Analogously to the case 2 */
end
return slicingTrees;
end
List hTree i insert (Tree tree, Constraint c)
begin
List hTree i slicingTrees = new List hTree i;
slicingTrees.add(new Tree (tree, Operator.uparrow, c)); slicingTrees.add(new Tree (tree, Operator.rightarrow, c));
slicingTrees.add(new Tree (c, Operator.uparrow, tree)); slicingTrees.add(new Tree (c, Operator.rightarrow, tree));
if tree.right != null then
slicingTrees.addAll(c, tree.right); slicingTrees.addAll(tree.right, c);
end
if tree.left != null then
slicingTrees.addAll(c, tree.left); slicingTrees.addAll(tree.left, c);
end
return slicingTrees;
end
Algorithm 3: Template generation algorithm.
IVAPP2014-InternationalConferenceonInformationVisualizationTheoryandApplications
46

branches of the slicing tree for both vertical and hori-
zontal split operators, the following dynamic formula
applies F(n) = 4 ∗ n ∗ F(n − 1) and the algorithm’s
performance can be estimated as Θ(4
n
∗n!). However,
in practice we need only one suitable layout, and if no
specific constraints on the tile positions are given, it
is defined in Θ(n). In the case of constrained layouts,
each new constrained item needs to be added to the
slicing trees generated at the previous step and this
may lead to the generation of two-dimensional per-
mutations of the current element with all previously
inserted items. Thus, the complexity can be estimated
as Θ(4
m
∗ m!), where m is the number of unique data
items with constrained positions. A more detailed
analysis of the algorithm’s performance as well as its
possible optimizations will be studied in future work.
6 RELATED WORK
In this section, we overview related work and com-
pare our method to existing approaches.
Various extensions and modifications of classic al-
gorithms exist that target at improving treemap per-
formance metrics. Spatially ordered squarified lay-
out (Wood and Dykes, 2008) provides a more consis-
tent arrangement of nodes w.r.t. the simple unordered
squarified layout while maintaining low aspect ratios.
Buchin et al. (Buchin et al., 2011) describe algorithms
for transforming a rectangular layout without hierar-
chical structure, together with a clustering of the rect-
angles of the layout, into a spatial treemap that re-
spects the clustering and, to the extent possible, the
adjacency of the input layout. Berg et al. (de Berg
et al., 2011) study tiling algorithms with bounded as-
pect ratios. They show that one cannot bound the as-
pect ratio if the regions are restricted to be rectangles.
Tak and Cockburn (Tak and Cockburn, 2013) intro-
duce a new metric to capture more efficiently the no-
tion of spatial stability and introduce tiling algorithms
designed to perform well according to this metric. We
find our method complimentary to such algorithms as
we target a different problem. Template-based lay-
outs can be used in combination with other tiling algo-
rithms which arrange free items from a dataset to opti-
mize a certain metric while our approach is employed
to create custom layouts where relative tile positions
carry meaningful information, such as in the case of
our body anatomy scenario. If multiple suitable lay-
outs are found by the template generation algorithm
as in our example in Section 5, any of the available
treemapping metrics (e.g., average aspect ratio, lay-
out distance change function) can be used to select
the optimal layout. Constraints on item adjacency
as in (Shneiderman and Wattenberg, 2001) will re-
quire only a minor modification of the proposed tem-
plate generation algorithm and are likely to reduce its
search space.
Treemaps are commonly used in combination
with nodelinks such as overlaying trees or graphs.
Linsen and Behrendt (Linsen and Behrendt, 2011)
present a joint 3D map nodelink and treemap interac-
tive visualization tool. While it is not an issue to sup-
port 3D layouts (one of our early prototypes featured
a 3D view where a treemap was used as a “chess-
board” to place 3D objects), zooming facilities in our
approach are more naturally supported. We can en-
large multiple selected areas of a treemap while re-
taining contextual information around enlarged tiles.
As pointed out in (Tu and Shen, 2008), such context-
retaining multi-focus zooming is not supported by ex-
isting tools. The authors tackle this problem by con-
structing a dependency graph that reflects relative po-
sitions of tiles and provide an algorithm to enlarge se-
lected areas while retaining initial relative positions
of selected tiles. Non-focused items are evenly dis-
tributed in remaining area. The algorithm is non-
trivial, requires solving systems of linear equations
and introduces a significant computational overhead.
An extension of treemapping algorithms has been
studied in the attempt to generalize them for directed
acyclic graphs (DAG) (Tsiaras et al., 2009). It has
been shown that such layouts are not always possible,
and when they are possible, the tiling algorithm is NP
complete. Heuristics have been proposed for several
special cases. The DAGs can be modified by replicat-
ing nodes with two or more parents. If all such nodes
are replicated, the DAG is converted to a rooted tree.
What is the minimal number of replications needed
to be able to build a DAG map is an open question.
While the objective of this work is different from ours,
the idea to encode desired characteristics of a treemap
layout as constraints was inspired by this paper.
de Bono et al. (de Bono et al., 2012) describes lim-
itations of existing treemapping tools for biomedical
data visualization. This work focuses on the concep-
tual templates tailored for the representation of body
anatomy. In our work, we introduce a generic method
to build custom templates and apply them to control
treemap layouts in any application domain.
Vliegen et al. (Vliegen et al., 2006) apply
treemaps with various tiling algorithms for visual-
izing business data. The best results are obtained
using the hybrid approaches. In our approach, we
allow users to customize the appearance of each
tile independently by assigning a template. The
design guidelines for creating effective rectangular
treemaps (Kong et al., 2010) can help users to define
Template-basedTreemapstoPreserveSpatialConstraints
47

templates in our framework for the best visual per-
ception of data depending on their quantitative char-
acteristics. The tree-like templates introduced in our
work can be targeted not at satisfying relative posi-
tioning constraints but at optimizing the layout dis-
tance change function or some other metric, including
custom ones.
The complete coverage of all available area may
not be required for biomedical data visualization or
other application domains. In relation to this, many
other variations of CSPs can be defined and solved to
generate visually appealing treemap layouts. More-
over, such CSPs may require only approximate or
fuzzy solution as the visualization does not always
need to strictly correspond to the data attributes it dis-
plays. For example, a treemap-based tool for the vi-
sualization of mutual fund portfolios (Csallner et al.,
2003) introduces a so called distorted treemap, which
trades proportionality of a mapped attribute to a more
inclusive visualization. The distorted treemap is a
compromise between showing all the data elements
and a classic treemap that preserves value propor-
tions. Consequently, such treemap can show one
more attribute than a classic treemap, though the node
area is no longer proportional to the visualized at-
tribute. This direction of work was not covered in our
approach and requires further investigation.
7 CONCLUSIONS AND FUTURE
WORK
In this paper, we introduced a method and tools to
build custom templates and apply them to customize
treemaps layouts. We illustrated the application of our
approach to control the positions of tiles in a sample
treemap. We also presented a method for automatic
generation of treemap templates for a class of prob-
lems with positional constraints. Our method gener-
ates stable layouts with an easy way to zoom in se-
lected areas, including multi-foci case.
Our future work includes analysis of the problems
of automated template generation for other classes
of constraints as well as application of the presented
method to the visualization of various data sets. Scal-
ability and usability of the proposed methods will be
studied more extensively. Since building custom tem-
plates for large data sets (e.g., human brain ontology)
is time-consuming and requires specialized knowl-
edge, a shared platform for template storage and reuse
will be useful. We are also planning to extend our
method to define templates for generating 3D images
from biomedical ontologies.
REFERENCES
Balzer, M. and Deussen, O. (2005). Voronoi treemaps. In
Proc of InfoVis’05, pages 49–56. IEEE.
Bederson, B. B., Shneiderman, B., and Wattenberg, M.
(2002). Ordered and quantum treemaps: Making ef-
fective use of 2d space to display hierarchies. ACM
Trans. Graph., 21(4):833–854.
Blanch, R. and Lecolinet, E. (2007). Browsing zoomable
treemaps: Structure-aware multi-scale navigation
techniques. TVCG, 13:1248–1253.
Bruls, M., Huizing, K., and van Wijk, J. (2000). Squari-
fied treemaps. In Proc. of the Joint Eurographics and
IEEE TCVG Symposium on Visualization, pages 33–
42. IEEE.
Buchin, K., Eppstein, D., L
¨
offler, M., N
¨
ollenburg, M., and
Silveira, R. I. (2011). Adjacency-preserving spatial
treemaps. In Proc. of WADS, pages 159–170.
Chen, L.-Q., Xie, X., Ma, W.-Y., Zhang, H., Zhou, H.-Q.,
and Feng, H. (2002). Dress: A slicing tree based web
page representation for various display sizes. Tech-
nical report MSR-TR-2002-126, Microsoft Research
Asia.
Csallner, C., Handte, M., Lehmann, O., and Stasko, J. T.
(2003). FundExplorer: Supporting the diversification
of mutual fund portfolios using context treemaps. In
Proc. of InfoVis’03, pages 203–208. IEEE.
de Berg, M., Speckmann, B., and van der Weele, V. (2011).
Treemaps with bounded aspect ratio. Proc. of the 22nd
Int. Conf. on Algorithms and Computation, pages
260–270.
de Bono, B., Grenon, P., and Sammut, S. (2012). Ap-
inatomy: A novel toolkit for visualizing multiscale
anatomy schematics with phenotype-related informa-
tion. Hum Mutat, 33(5):837–848.
de Moura, L. M. and Bjrner, N. (2008). Z3: An efficient
SMT solver. In Proc. of the 14th Int. Conf. on Tools
and Algorithms for the Construction and Analysis of
Systems (TACAS 2008), volume 4963 of LNCS, pages
337–340. Springer.
Fischer, F., Fuchs, J., and Mansmann, F. (2012). Clockmap:
Enhancing circular treemaps with temporal glyphs for
time-series data. In EuroVis 2012 Short Papers), pages
97–101.
Johnson, B. and Shneiderman, B. (1991). Tree-maps: a
space-filling approach to the visualization of hierar-
chical information structures. In Proc. of the 2nd Con-
ference on Visualization ’91, pages 284–291. IEEE.
Kong, N., Heer, J., and Agrawala, M. (2010). Perceptual
guidelines for creating rectangular treemaps. TVCG,
16:990–998.
Lai, M. and Wong, D. (2001). Slicing tree is a complete
floorplan representation. In Proc. of the Conf. on
Design, Automation and Test in Europe (DATE’01),
pages 228–232. IEEE.
Linsen, L. and Behrendt, S. (2011). Linked treemap: a 3d
treemap-nodelink layout for visualizing hierarchical
structures. Computational Statistics, 26(4):679–697.
Shneiderman, B. (2009). Treemaps for space-constrained
visualization of hierarchies. Web document.
IVAPP2014-InternationalConferenceonInformationVisualizationTheoryandApplications
48

Shneiderman, B. and Wattenberg, M. (2001). Ordered
treemap layouts. In Proc of InfoVis’01, pages 73–78.
IEEE.
Tak and Cockburn (2013). Enhanced spatial stability with
hilbert and moore treemaps. TVCG, 19:141–148.
Tsiaras, V., Triantafilou, S., and Tollis, I. G. (2009).
Dagmaps: Space filling visualization of directed
acyclic graphs. J. Graph Algorithms Appl., 13(3):319–
347.
Tu, Y. and Shen, H.-W. (2008). Balloon focus: a seam-
less multi-focus+context method for treemaps. TVCG,
14(6):1157–1164.
Vliegen, R., van Wijk, J. J., and van der Linden, E.-J.
(2006). Visualizing business data with generalized
treemaps. TVCG, 12:789–796.
Wattenberg, M. (2005). A note on space-filling visualiza-
tions and space-filling curves. In Proc. of InfoVis’05,
pages 181–186. IEEE.
Wetzel, K. (2006). Pebbles - using circular treemaps to vi-
sualize disk usage. Web document.
Wood, J. and Dykes, J. (2008). Spatially ordered treemaps.
TVCG, 14:1348–1355.
Template-basedTreemapstoPreserveSpatialConstraints
49
