
Enabling Quality Control of Sensor Web Observations
Anusuriya Devaraju, Ralf Kunkel, Juergen Sorg, Heye Bogena and Harry Vereecken
IBG-3: Agrosphere, Forschungszentrum Juelich, 52425 Juelich, Germany
Keywords:
Quality Control, Observations, Sensor Web, TERENO, Environmental Sensing.
Abstract:
The rapid development of sensing technologies had led to the creation of large volumes of environmental
observation data. Data quality control information informs users how it was gathered, processed, examined.
Sensor Web is a web-centric framework that involves observations from various providers. It is essential to
capture quality control information within the framework to ensure that observation data are of known and
documented quality. In this paper, we present a quality control framework covering different environmental
observation data, and show how it is implemented in the TERENO data infrastructure. The infrastructure is
modeled after the OGC’s Sensor Web Enablement (SWE) standards.
1 INTRODUCTION
The Global Hydrological Monitoring Industry Trends
Survey reveals that data consumers have a high de-
mand for quality-controlled observation data (Aquatic
Informatics, 2012). Quality Control (QC) is defined
as “a part of quality management focused on fulfilling
quality requirements” (ISO9000, 2005, cl. 3.2.10).
We regard quality control of observation data as a pro-
cess of identifying problems within the data, fixing
or eliminating them, and documenting the processes
involved. Raw data usually go through several qual-
ity control procedures before they are made available
to end users. They are usually examined in terms of
range, rates of change, and consistency checks be-
tween related quantities
1
observed at the same site.
For example, in situ soil temperature measurements
are used to detect spurious soil moisture observations
due to frost (Dorigo et al., 2011). Similarly, empiri-
cal relationships between pan evaporation or lysime-
ter data and other physical quantities give indications
of suspect data (WMO, 1994).
The term “Sensor Web” refers to web accessi-
ble sensors and their observations that can be discov-
ered and accessed using standard protocols and ap-
plication program interfaces (Botts et al., 2008). An
open technical environment like the Sensor Web of-
ten involves observation data from various sources.
Each provider may follow different data processing
and validation mechanisms before publishing the data
online. Quality control information conveys to users
1
Quantities refer to observable properties.
of the data how it was gathered and processed, as-
sessed, what quality tests have been applied, what er-
rors were found, and how the errors have been cor-
rected or flagged (CEC and IODE, 1993). Integrat-
ing these kinds of information into the Sensor Web
is valuable for later understanding of the observation
data (DataONE, 2013). Data providers, for example,
can use this information to validate how well their
datasets meet the criteria set out in a product speci-
fication, and resolve current and future questions re-
garding alterations made to data (WMO, 1994, ch.9).
Data consumers can select datasets best suited to their
needs and avoid potential errors that might occur due
to use of poor quality data (DataONE, 2013; IOC of
UNESCO, 2013).
According to the Global Earth Observation Sys-
tem of Systems (GEOSS) 10-Year Implementation
Plan, quality control is one of “components required
to exchange and disseminate observational data and
information” (Mitsos et al., 2005, pp.127). The plan
also advocates that data providers should provide
quality control information at the product level. A
standardization of quality control procedures should
also be developed and implemented in the context of
environmental sensing (Mitsos et al., 2005).
The goal of this paper is to incorporate quality
control information of observation data into the Sen-
sor Web (Devaraju et al., 2013). This raises several
questions:
a. How are raw data of a property gathered and pro-
cessed into quality-controlled observation data?
For this question, we present a common quality
17
Devaraju A., Kunkel R., Sorg J., Bogena H. and Vereecken H..
Enabling Quality Control of Sensor Web Observations.
DOI: 10.5220/0004707200170027
In Proceedings of the 3rd International Conference on Sensor Networks (SENSORNETS-2014), pages 17-27
ISBN: 978-989-758-001-7
Copyright
c
2014 SCITEPRESS (Science and Technology Publications, Lda.)
Local Data Infrastructure
Data storage
Map, Observation and
Catalogue Services
Local Data Infrastructure
Data storage
Map, Observation and
Catalogue Services
Local Data Infrastructure
Data storage
Map, Observation and
Catalogue Services
Local Data Infrastructure
Data storage
Map, Observation and
Catalogue Services
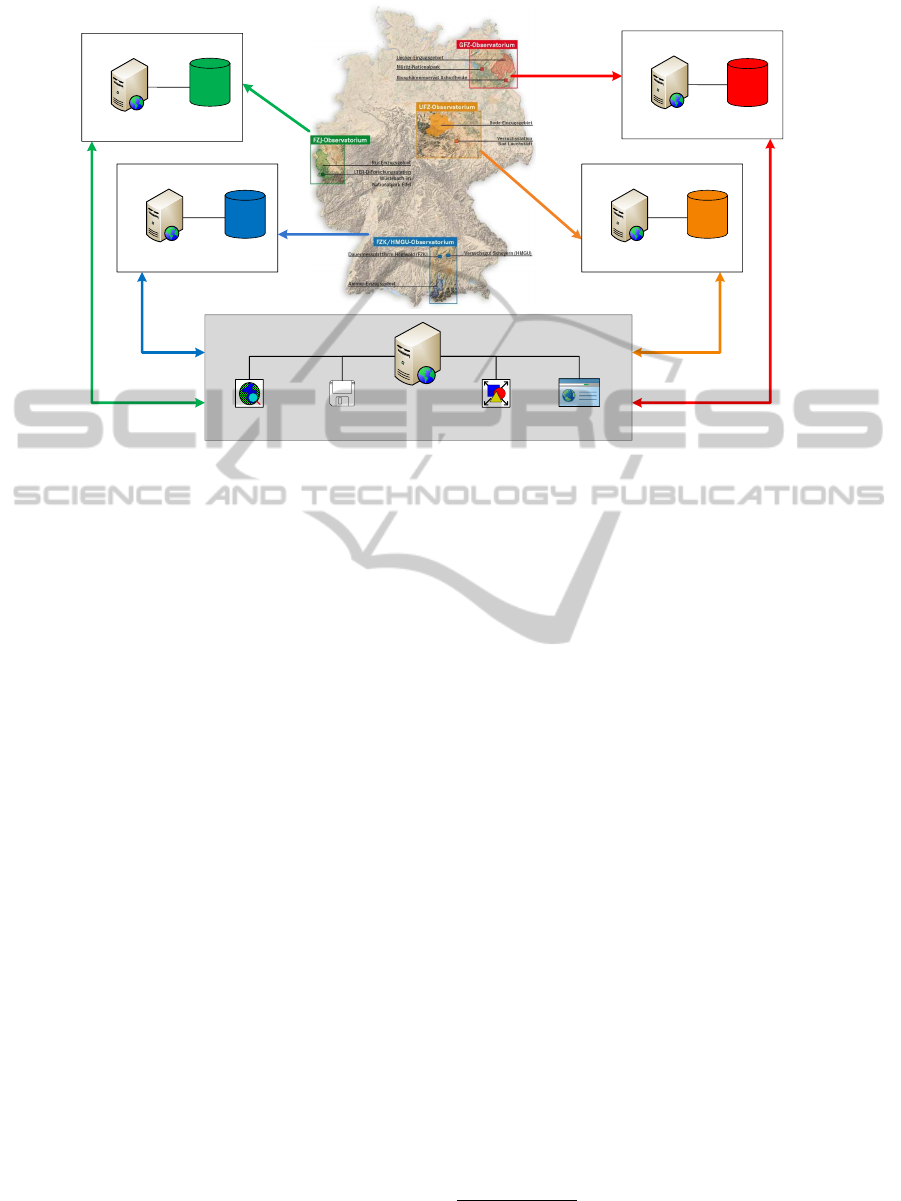
Portal Web Server
Data and Metadata
Search Engine
Data Downloading Tools
Web Page
Data Visualization
Tool
TEODOOR Web Application
Figure 1: TEODOOR is developed to describe, manage and publish observation data within a distributed, scientific and
non-scientific multi-user environment (Kunkel et al., 2013).
control workflow covering different environmen-
tal data within the TERENO observatory (Bogena
et al., 2012) (see Figure 1), and an extensible qual-
ity flag scheme.
b. What are the key aspects of data quality control
and how can these be represented in an observa-
tional data model? How can this information be
delivered to users via the Sensor Observation Ser-
vice (SOS)?
The observational data model of TERENO is de-
signed after the CUAHSI Observation Data Model
(ODM) (Tarboton et al., 2008). We specify
changes made to the ODM to capture QC infor-
mation. We modify an open source Sensor Obser-
vation Service (SOS) implementation, such that it
delivers quality controlled observations with QC
metadata to users.
The paper is organized in the following way: Sec-
tion 2 presents related work and Section 3 delivers the
quality control framework of TERENO observations.
Section 4 describes the implementation of the frame-
work. Section 5 provides a summary and recommen-
dations for future work.
2 RELATED WORK
This section introduces existing work on represent-
ing quality control of Sensor Web observations. Sev-
eral quality flag schemes for exchanging environmen-
tal data are also discussed.
2.1 Quality Control of Sensor Web
Observations
Several Sensor Web infrastructures have been de-
ployed in environmental contexts. The OGC’s Sen-
sor Web Enablement (SWE) offers standard specifica-
tions that support the integration of sensors and sensor
networks into the Sensor Web (Botts et al., 2008). An
overview of existing SWE-based projects is included
in (Broering et al., 2011; Conover et al., 2010).
The Sensors Anywhere (SANY) project develops
a sensor service architecture applying SWE services
for air quality, coastal water management and geo-
hazards monitoring (Stuart et al., 2009; Bartha et al.,
2009). The architecture supports uncertainties infor-
mation in terms of UncertML (Williams et al., 2009),
which is included in a Sensor Model Language (Sen-
sorML) if it applies to the whole measurement pro-
cess or in an Observation and Measurement (O&M)
document if it refers to specific measurement values.
(Bartha et al., 2009) defined generic quality flags, e.g.,
Null, NaN, Out of Engineering Range in the latter
document. SANY’s observation service uses proce-
dure
2
to represent data processing, e.g., raw data,
automatically assessed data, and manually assessed
2
A procedure refers to a method, an algorithm or an in-
strument used to obtain measurement results (Botts et al.,
SENSORNETS2014-InternationalConferenceonSensorNetworks
18
data. While a data processing activity can be concep-
tualized as a ‘post’ sensing procedure, it is unclear
how this is linked to actual sensing procedures and
offerings
3
within the implementation.
The Earth Observation and Environmental
Modelling for the Mitigation of Health Risks
(EO2HEAVEN) applies several observation services
to study the links between environmental pollutions
and their impacts on human health (Brauner et al.,
2013b). The study adapts SANY’s approach to ex-
press uncertainties of observations, however quality
control information is not supported (Brauner et al.,
2013a).
The NOAA Integrated Ocean Observing System
(IOOS) established an observation service
4
to pro-
vide access to ocean and coastal measurements (Gar-
cia, 2010). Among the seven quantities supported by
the service, only ocean current measurements are ac-
companied with a set of quality flags (Garcia, 2010).
The quality flags represent the results of certain qual-
ity tests applied to observation data. The metadata
of flags can be obtained using the SOS DescribeSen-
sor operation. However, differing quality flags for the
same property measured by different models of sensor
are not supported (Garcia, 2010).
The Quality Assurance of Real Time Ocean Data
(QARTOD) is a multi-organization effort to address
the quality control procedures for IOOS properties,
including detailed information about sensors and pro-
cedures used to observe the properties. Q2O imple-
ments the QARTOD recommendations into the OGC
Sensor Web Enablement framework providing Sen-
sorML profiles for data quality tests. The focus is
on delivering quality control information at the level
of the sensing process, where each quality test is de-
fined as a process that is described with inputs and
outputs (Fredericks et al., 2009). Unlike QARTOD,
our focus is to capture QC information at the level of
the individual observations. We incorporate metadata
of quality flags and also data processing levels in an
O&M document. References expressing these are at-
tached to each observation value.
2.2 Data Processing Levels
Transforming raw data into data products includes
data processing at several levels. Each data level may
involve different quality control requirements. For
example, the first level includes raw data, the sec-
ond level refers to flagged data, whereas the next
2008).
3
An observation offering is a logical grouping of observa-
tions offered by a service (Na and Priest, 2007).
4
http://sdf.ndbc.noaa.gov/sos/
level suggests corrected data. There are several clas-
sifications of data levels of environmental data as
proposed by Earth Observing System (EOS) Stan-
dard Data Product (SDP)
5
, Consortium of Univer-
sities for the Advancement of Hydrologic Science
(CUAHSI)
6
, Atmospheric Thematic Center
7
, Earth-
scope
8
, and Committee on Earth Observation Satel-
lites (CEOS)
9
. These classifications usually comprise
several levels. Some of these classifications lack a de-
tailed description on how derivation and quality con-
trol are managed and implemented from one to an-
other level. While data providers may have their own
data levels, our data processing levels are kept sim-
ple, but remain consistent with the practice of other
data systems. The data levels are part of the proposed
quality control framework (see Section 3.2).
2.3 Data Quality Flags
Flagging is a procedure that adds a quality indica-
tor to the original observation. Data quality flags
(also known as qualifiers) imply the outcome of a QC
process, which may either be computer- (i.e., auto-
matic quality control procedures) or human-generated
(i.e., visual inspections). Quality flag schemes are
usually application-specific. For example, the WMO
data qualification codes are available for qualifying
hydro-meteorological data (WMO, 1994). The World
Ocean Circulation Experiment (WOCE) defines pa-
rameter quality codes for water sampling (WOCE,
1994). The International Oceanographic Data and In-
formation Exchange (IODE) Quality Flag Standard is
defined to facilitate the exchange of oceanographic
and marine meteorological data (IOC of UNESCO,
2013).
Some flag schemes are single-level lists and in-
dicates the overall data quality, e.g., OceanSITES,
COS Data Quality Flags, and SeaDataNet. Other flag
schemes consist of two-levels. The primary level in-
cludes generic flags intended for any type of data, e.g.,
good, not evaluated, and bad. The secondary level
is application-specific and complements the primary
level flags by indicating, (i) the results of individ-
ual quality tests applied, e.g., excessive spike check
and failed gradient check, or (ii) data processing his-
tory, e.g., interpolated values and corrected value, or
(iii) some background conditions that affect data val-
ues, e.g., icing event, faulty sensor calibration. Con-
cerning the secondary level, some flagging conven-
5
http://nsidc.org/data/icebridge/eos level definitions.html
6
http://his.cuahsi.org/
7
https://icos-atc-demo.lsce.ipsl.fr/node/34
8
http://www.earthscope.org/science/data/access/
9
http://www.ceos.org/
EnablingQualityControlofSensorWebObservations
19
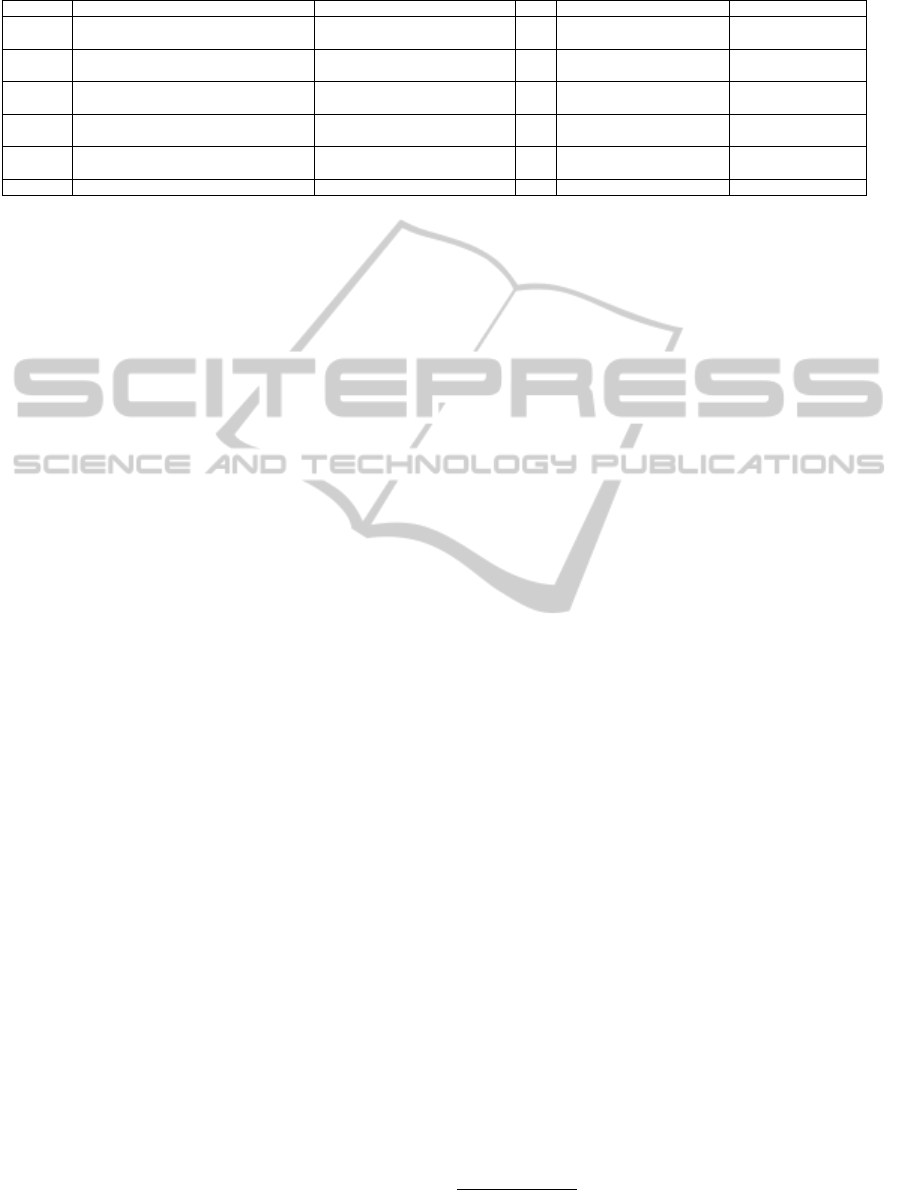
Table 1: Data processing levels.
Level Descriptions Data Source QC Data Editing Availability
Level 1 Raw data Automatic importing or manual
upload
No Not allowed Internal (on request)
Level 2a Externally quality controlled data; an
expert approval is pending
Level 1 data (manual upload) Yes Not allowed, flagging only Internal (on request)
Level 2b Quality controlled data with automatic
QC procedures
Level 1 data (automatic upload) Yes Not allowed, flagging only Public
Level 2c Externally quality controlled data with
an expert approval
Level 2a data Yes Not allowed, flagging only Public
Level 2d Quality controlled data with automatic
QC procedures and visual inspections
Level 2b data Yes Not allowed, flagging only Public
Level 3 Derived data One or more Level 2 data Yes Allowed Public
tions include references to quality test and data pro-
cessing (i and ii). However, they provide no infor-
mation on the causes (iii) for variability of the mea-
surement, e.g., IODE quality flag standard. Other
flag schemes provide the latter but exclude the for-
mer, e.g., WMO data qualification code. It is impor-
tant to capture these aspects of flagging. They would
help users to combine data with different flag schemes
while preserving existing quality control information,
and make informed decisions with regard to data ac-
ceptance (Konovalov et al., 2012). A recent work in
this direction is (Schlitzer, 2013) who specifies qual-
ity flag mappings between 15 widely-used flag stan-
dards in the oceanographic domain.
Our approach adopts a two-level flag scheme and
separate flags associated with data quality from back-
ground conditions. Details about the flag scheme are
included in Section 3.3.
3 QUALITY CONTROL
FRAMEWORK
This section introduces TERENO and presents a QC
framework comprising data levels, data quality con-
trol workflows and a two-tiered flag scheme.
3.1 TERrestrial ENvironmental
Observatories (TERENO)
TERENO is an initiative funded by the research in-
frastructure program of the Helmholtz Association.
The goal of TERENO is to create observation plat-
forms to facilitate the investigation of consequences
of global change for terrestrial ecosystems and the so-
cioeconomic implications of these (Zacharias et al.,
2011). Four observatories have been set up within the
TERENO initiative: Northeastern German Lowland,
Harz/Central Lowland, Eifel/Lower Rhine Valley, and
Bavarian Apls/Pre-Alps. Each institution hosting an
individual observatory maintains its local data in-
frastructure (Figure 1). The observatories are con-
nected via OGC-compliant web-services, while the
TERENO Online Data RepOsitORry (TEODOOR)
10
central portal application enables data searching, vi-
sualization and download (Kunkel et al., 2013). This
paper focuses on time series data of soil, stream,
climate, energy, water and gas fluxes from the
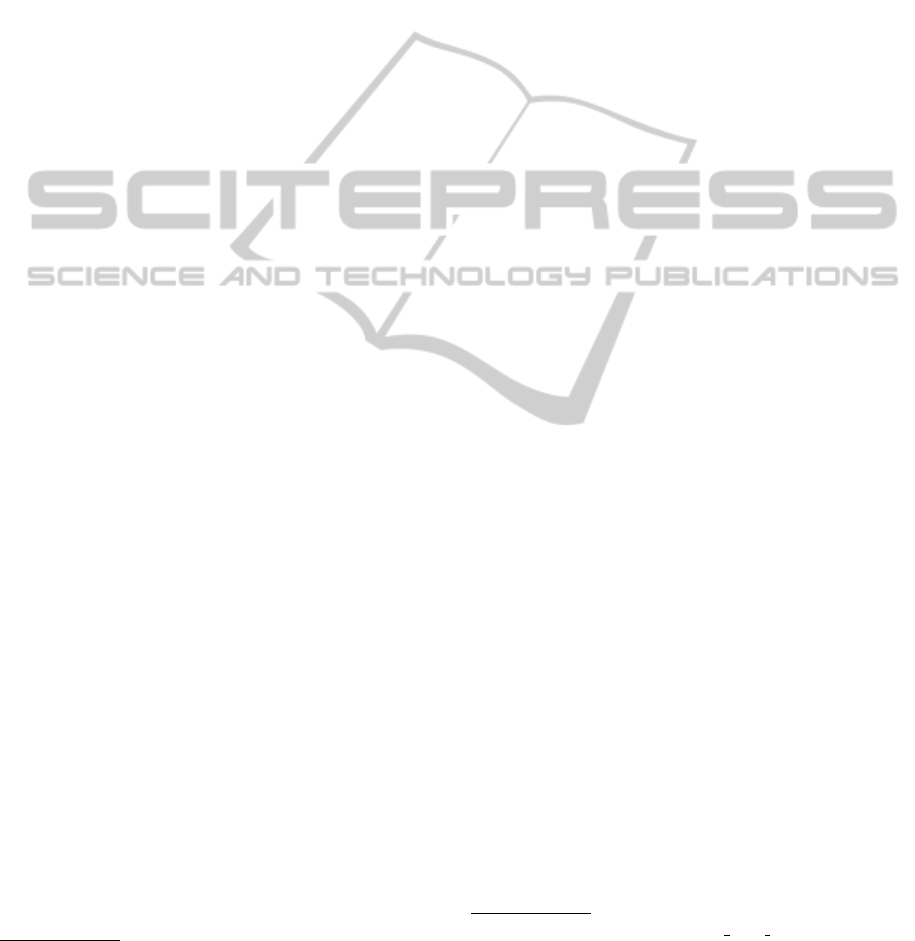
Eifel/Lower Rhine observatory. Currently, this obser-
vatory provides free access to data from more than
500 monitoring stations. Figure 2 illustrates the basic
components of the local data infrastructure.
3.2 Data Types and Processing Levels
There are two ways in which observation data
from the Lower Rhine observatory is gathered into
TEODOOR. Some data are automatically imported
from sensing systems into the data infrastructure (e.g.,
timeseries of weather stations and soil monitoring net-
works), and other types are uploaded manually (e.g.,
eddy covariances and laboratory results). The first
type of data initially undergoes automatic quality as-
surance procedures during the importing process and
then manual inspections by domain experts. The sec-
ond type of data is externally processed and quality-
controlled using proprietary tools. They are gathered
into the data infrastructure using a custom importing
process. Expert approval from the responsible per-
sonnel is required before this type of data is released
to the public. Further information on expert approval
is included in Section 3.4.
Data providers may have a different concept of
data level depending on their data types and process-
ing workflow. Our data processing levels are kept
simple, but representative of the data levels that are
generally available (Table 1). Specifically, they are
suitable for time series data from different sensing ap-
plications. The reason for this is that data series are
grouped into a particular level mainly based on the
way they are processed and assessed within the data
infrastructure. Table 1 clarifies the relationships be-
tween processing levels and other aspects, e.g., data
10
http://teodoor.icg.kfa-juelich.de/
SENSORNETS2014-InternationalConferenceonSensorNetworks
20
FZJ local data
infrastructure
WFS SOS WMS SES WPS
OGC Web-services
Metadata
services
Geodata
services
Data and data quality
processing services
File repository
Automatic data validation
Parameter transformation/
aggregation
Postgres
Raster data processing
Input data parser
E-Mail parser
File system
parser
Raster data
parser
http
Scientists / Engineers
Sensor metadata
registry
Data storage
Notification and alerting
Data processor
ftp
smtp
scp
Re
Remote
sensors
In-situ
sensors
CSWWCS
Data manager
Sample manager
Internal ODM editor
Reference table
manager
http
Task manager
Quality control
manager
TEODOOR Web Portal
Quality flagging tool
Web-based and
standalone clients
Figure 2: Components of the FZJ local data infrastructure.
source, assessment and accessibility. Level 1 refers to
raw data that have not been quality assessed and re-
main intact for archive purposes. Level 2 includes raw
data that have been quality controlled, either inter-
nally or externally. Here, the data values are flagged,
but they cannot be edited. Level 3 contains derived
data that are gathered from quality controlled data. In
other words, Level 3 data can only be created from
one or more data types of Level 2. This allows for
increased ease in data organization and maintenance.
Any updates to Level 3 data will be saved to that data
level (Tarboton et al., 2008).
3.3 Flagging Convention
Due to the diverse nature of TERENO observations,
we need a common set of quality flags that can be
used by different sensing applications. Following
(IOC of UNESCO, 2013), we adopt a two-level flag
scheme. Flags are usually varied across observational
values as they depend on the results of quality checks.
Therefore, we assign flags with individual data val-
ues, not a data series. The first level defines the
generic data quality flags, while the second level com-
plements the first level by providing the justification
for the quality flags based on validation tests and data
processing history. In TERENO, the second-level
flags are specified by the domain experts. The char-
acterization of these flags can be sensor-specific or
property-specific, depending on the application. For
example, all data from eddy covariance stations are
flagged with a standardized group of flags, whereas
the water discharge measurements have their own
data flags, which differ from the water temperature
measurements. With the two-level flag scheme, exist-
ing applications are not required to change their flag
systems as they extend the generic flags with their
specific flags. Table 2 presents examples of quality
flags. The first column of the table contains standard-
ized generic flags of TERENO. The second column
includes examples of specific flags that are applicable
to time series from weather stations. The background
conditions that cause abnormal measurements are not
represented as flags, but rather as additional informa-
tion supporting the flagging process.
11
3.4 Quality Control Workflow
Figures 3 and 4 illustrate the data workflow of au-
tomatically and manually uploaded data. Both types
of data undergo certain procedures. Accordingly, the
data level and flags are updated. These descriptions
are made available to users along with observation
data via the sensor observation service (Figure 7).
11
Representing background conditions as standardized
flags is not investigated in this paper, but subject to a fu-
ture investigation.
EnablingQualityControlofSensorWebObservations
21
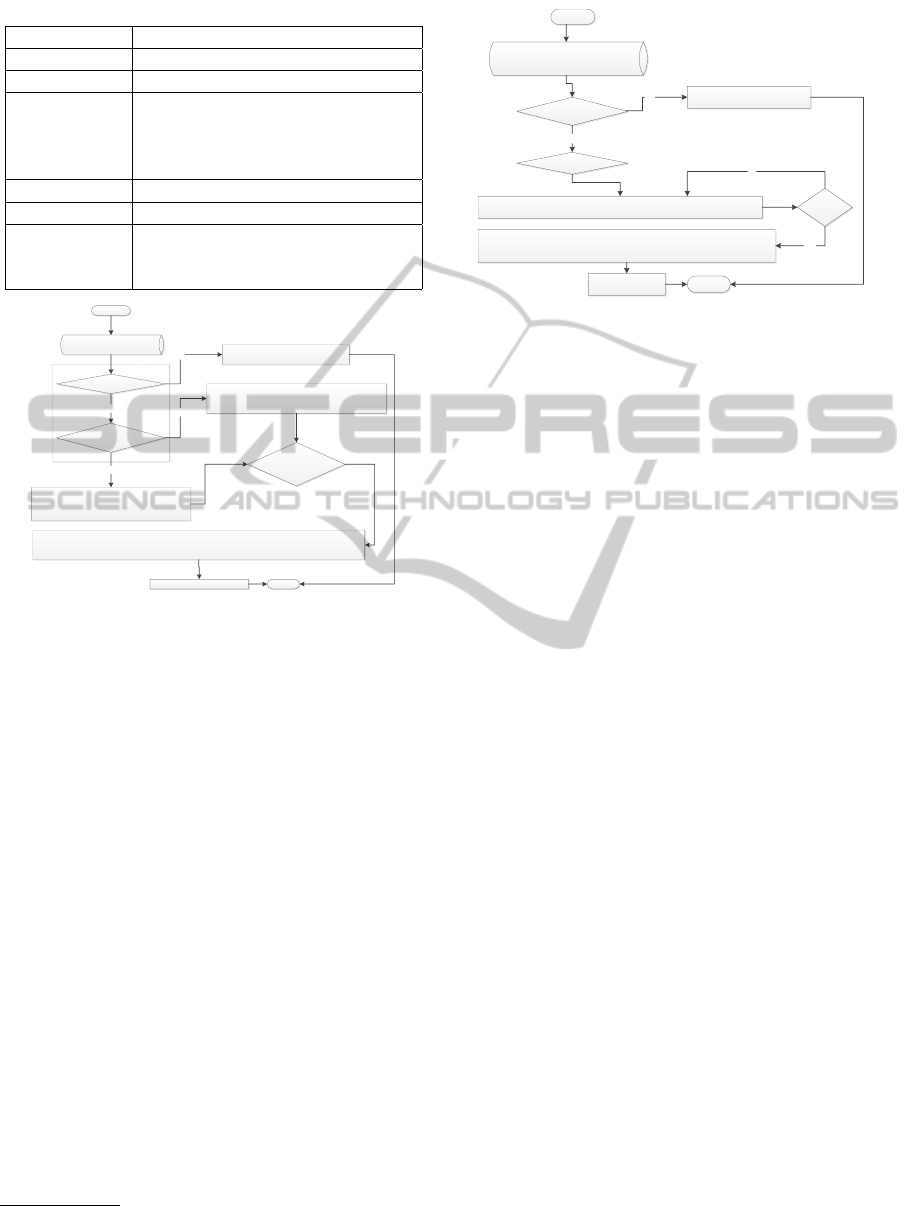
Table 2: Generic and specific data quality flags.
Generic Flag Specific Flag
unevaluated -
ok passedautocheck
bad outofrange, isolatedspike, min-
error,maxerror, replicateval,
unknownqcsource, excessivediffer-
ence, irregular
suspicious same as ‘bad’ flags
gapfilled interpolated, extrapolated
missing (This generic flag is used as a place
holder when data values are miss-
ing)
Start
Automatically-uploaded data
e.g., air temperature series
Raw data processing
Set processing level: Level 2b
Set generic flag: ok
Set specific flag: passedautochecks
pass
Visual Inspection
Set processing level : Level 2d (quality controlled data with automated procedures and visual inspections)
Update specific flags and evaluator information
Publish data via TEODOOR End
Set processing level: Level 2b
Set generic flag: e.g., suspicious
Set specific flag: e.g., minerror (value below detection)
fail
Send an email alert to the responsible
scientist / field technician
Automatic quality checks
pass
fail
DATA IMPORT
Figure 3: The workflow of automatically uploaded time se-
ries data.
Both types of data are easily imported into the ob-
servational database with our time series management
system (TSM 2.0) (Kunkel et al., 2013). The system
includes a highly configurable file parser and a data
processor. The configuration details are captured in
the database (Figure 5). Here, a controlled vocabulary
(i.e., a prescribed list of terms describing observed
properties, units, data types, and sensor types) is used
to support the provision of heterogeneous data into
the database. The system also includes an email no-
tification component that alerts the data owner about
the importing process and the problems occurred.
Checking of automatically uploaded data involves
automated and manual (i.e., visual inspections) pro-
cedures (Figure 3). During the importing process,
automated data validation such as transmission and
threshold checks are performed, and measurements
are flagged accordingly. This is followed by a visual
examination by the respective scientist or field techni-
cian using an online data flagging tool (Figure 2). The
tool is developed based on the 52
◦
North Sensor Web
Client v3.1
12
. We extend the client with a data in-
spection module that allows users to identify and flag
12
http://52north.org/communities/sensorweb/clients/Sensor
WebClient/
Manually-uploaded, externally quality
controlled data
e.g., eddy-covariance series
Data importing
Processing level: Level 2a (quality controlled data without internal approval)
Expert
approval
Set processing level: Level 2c (externally quality controlled data with approval)
Update approver information
Publish data via
TEODOOR
End
yes
Send an email alert of
resubmission of data
fail
no
Start
Perform flags mapping
pass
Figure 4: The workflow of manually uploaded and exter-
nally quality-controlled time series data.
measurements.
Manually uploaded data are imported into the
system without automated quality checks, as they
have been assessed externally with standardized
procedures (Figure 4). For example, a strategy
has been applied for assessing quality of eddy-
covariance measurements within TERENO (Mauder
et al., 2013). The workflow also involves mapping be-
tween application-specific flags and the generic flags.
Data series will be made available online when they
are approved by the principal investigator. The data
levels (Level 2a and Level 2c) distinguish data re-
tained in the system from publicly available data. For
some cases, an approval is embedded within the im-
porting process. For other cases, due to data distribu-
tion issues, manually uploaded data are not released
online until the data originator or the principal in-
vestigator approves them. For example, data associ-
ated with externally funded research and laboratory
specimens are gathered into the data infrastructure to
enable data sharing within the TERENO community.
These data are released to the public until the investi-
gations are completed.
3.5 Discussions
A data quality control framework enables a data
provider systematically to assess observations com-
ing from various sources. TERENO involves observa-
tions of various sensing applications; we distinguish
them based on the way they are imported into the data
infrastructure. Quality control is an embedded step
in the data processing workflow. Automatically up-
loaded data undergo automated checks and visual in-
spections, whereas manually uploaded data are pro-
cessed and assessed externally, and then imported into
the infrastructure. An essential feature of this process
is that whether it is imported manually or automati-
SENSORNETS2014-InternationalConferenceonSensorNetworks
22
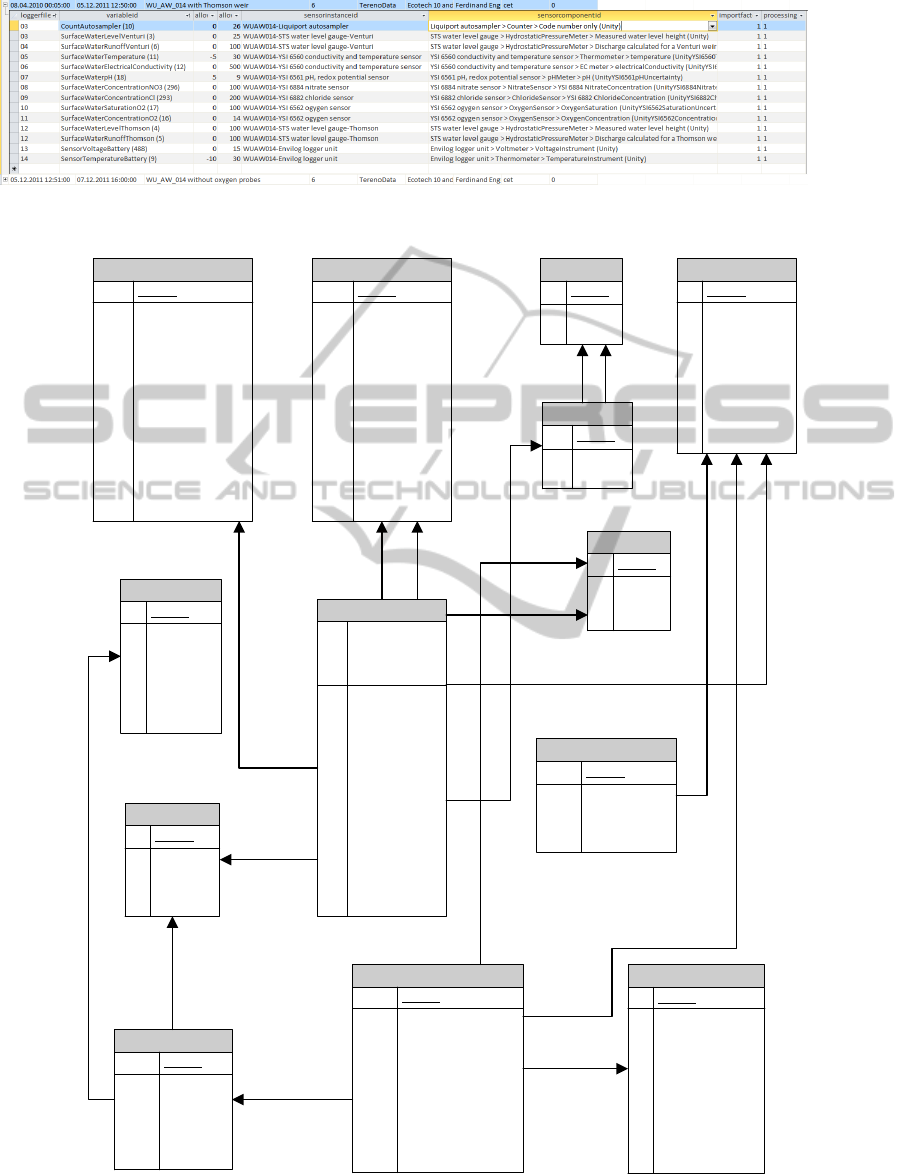
Figure 5: A screenshot of configuration details of an importing process.
sensorcomponents
PK objectid
U1 code
definition
functionid
FK1,U1 methodid
FK2,U1 sensorid
U1 sensortypeid
logger
PK objectid
U1 code
definition
technicalwarningdays
U1 timestampfrom
timestampto
datatableclassid
filetypeid
sourceid
timezone
siteid
notify
sensors
PK objectid
U1 code
definition
link
manufacturer
model
type
version
methods
PK objectid
U1 code
definition
link
organization
variables
PK objectid
U1 abbreviation
U2 code
definition
datatypeid
offeringid
samplemediumid
timeunitid
unitid
valuetypeid
propertyid
processingstati
PK objectid
U1 code
definition
U2 shortdesc
usersitevariablepermissions
PK objectid
groupsetid
U1 siteid
U1 sourceid
FK1,U1 variableid
loggervariables
PK objectid
allowedmaxvalue
allowedminvalue
importfactor
loggerfilecolumnname
loggerfilecolumnnumber
FK1,U1 loggerid
FK3 processingstatusid
sampletypeid
FK4,U1 sensorcomponentid
FK2,U1 variableid
U1 sensorinstanceid
qualifiergroups
PK objectid
FK1 groupid
FK2 qualifierid
sources
PK objectid
address
administrativearea
citation
city
U2,U1 code
country
definition
email
firstname
link
organization
phone
surname
zipcode
metadataid
qualifiers
PK objectid
U1 code
definition
terenodata
timestampto
FK1 processingstatusid
FK7 siteid
FK3 variableid
objectid
datavalue
datavalueaccuracy
offsetvalue
timestampfrom
censorcodeid
I1 importid
FK4 methodid
offsettypeid
FK6 qualifierid
I2 sampleid
FK5 sourceid
FK2 validationsourceid
derivedfrom
binobject
binobjecttypeid
sites
PK objectid
U2,U1 code
definition
elevation_m
foi
geom
latitude
localx
localy
longitude
name
posaccuracy_m
remarks
latlondatumid
localprojectiondatumid
verticaldatumid
Figure 6: A partial view of the TERENO observational data model.
EnablingQualityControlofSensorWebObservations
23

cally, all data are suitably flagged.
Similar to other classification schemas of data
level, they imply the underlying data processing.
However, in our approach the relationships between
the data levels and other aspects such as assessment
and accessibility are also clarified. At higher levels,
data are quality checked and made available to the
public. A two-level flag scheme is adapted to consider
flag systems of different types of data. The data level
and flag information is included at the level of the in-
dividual observations so that it is more convenient for
applications to locate their data of interest, for exam-
ple, a request for data that are quality assessed and
that exclude bad and suspicious values.
4 IMPLEMENTATION
This section presents the implementation of the qual-
ity control framework. We modify the existing obser-
vation data model and observation service to support
the delivery of quality control information in the Sen-
sor Web.
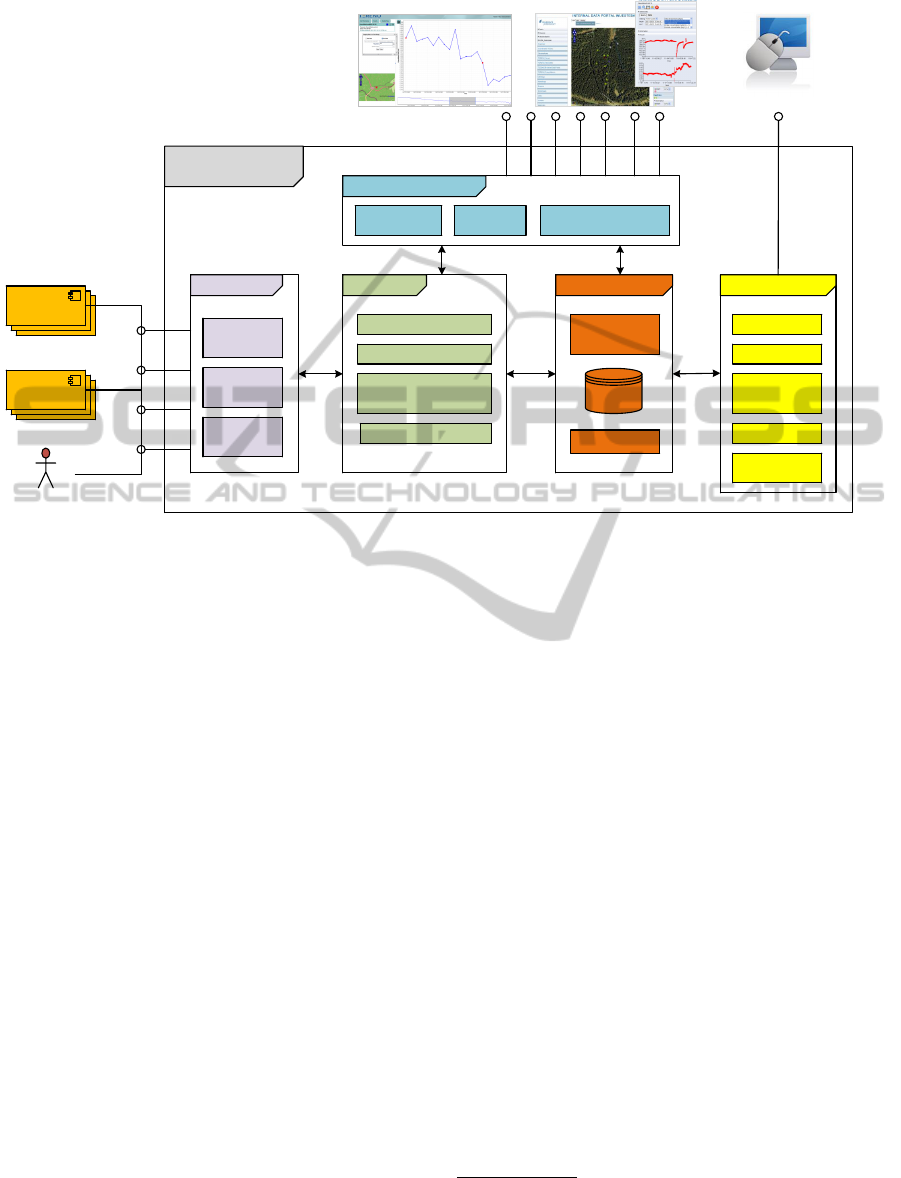
4.1 Observational Data Model
The original data schema of CUAHSI ODM has been
modified to represent sensor specifications, data im-
porting and transformation procedures, loggers con-
figurations, data access control and quality control in-
formation. Figure 6 illustrates a partial view of the
data schema representing quality control of observa-
tions. Flags and a data level are associated with indi-
vidual observation values. Generic and specific flags
are listed in the qualifiers table; their mappings are
specified in the qualifiergroups table. Similarly, tables
specifying data assessment methods are represented.
Data levels are described in the processingstati ta-
ble. The source table includes information about data
evaluators, e.g., field technicians and scientists.
In TERENO observatories, often two or more sen-
sors are installed at the same location measuring the
same type of physical quantity. For example, a pair
of soil moisture sensors is installed at three differ-
ent depths (within a vertical soil profile) at a partic-
ular location to improve detection quality and faults
tolerance. The observed properties are distinguished
with a unique naming scheme combining property
type, sensor instance and several other parameters,
e.g, SoilWaterContent0.2mSensor1, SoilWaterCon-
tent0.5mSensor1 and AirTemperature2m. As the data
model supports the characterization of specific flags
at a property level, differing quality flags applicable
for the same quantity measured by different models
of sensor can be represented.
4.2 Sensor Observation Service (SOS)
The Sensor Observation Service (SOS) defines a ser-
vice’s model interface and encoding for the provi-
sion of sensor information and observation data (Na
and Priest, 2007). For example, the SOS operation
DescribeSensor requests detailed meta-information
about a sensor and delivers a SensorML document
accordingly. The GetObservation operation handles
a data request and returns the observation data by
means of an Observation and Measurement (O&M)
document. We modify the open source implemen-
tation of the 52
◦
North (52N) SOS
13
to deliver qual-
ity control meta-information along with observation
data. To improve query performance on the server,
metadata of flags and data processing levels are in-
cluded in the gml:metaDataProperty section of an
O&M document, whereas references expressing these
are attached to each observation value encoded in the
om:result section (see Figure 7). Here, the suggested
scheme is to form a label combining a data process-
ing level id and a flag mapping id for each individual
data value. Our observational data model is different
from the standard data model of SOS. Thus, views,
i.e., virtual tables are used to relate our data model to
the sensor observation service.
5 CONCLUSIONS
TERENO is an interdisciplinary observatory that in-
volves observation data from various sensing appli-
cations, e.g., climate, water, and soil. Unlike opera-
tional systems run by weather or water agencies that
follow a specific data processing procedures, we need
an extensible approach to cater various sensing appli-
cations. In this paper, we have described a quality
control framework for processing and assessing envi-
ronmental time series within our data infrastructure.
Starting with the way data are imported into the in-
frastructure, custom data workflows are defined. The
data processing levels are kept simple and fulfill ap-
plication needs. They imply underlying data process-
ing, assessment and accessibility. A two-tiered flag
scheme is adapted to represent flag systems of dif-
ferent sensing applications. The existing observation
data model and the SOS are modified, so that obser-
vation data with metadata of quality control are ac-
cessible in the Sensor Web. Another application uti-
13
http://52north.org
SENSORNETS2014-InternationalConferenceonSensorNetworks
24
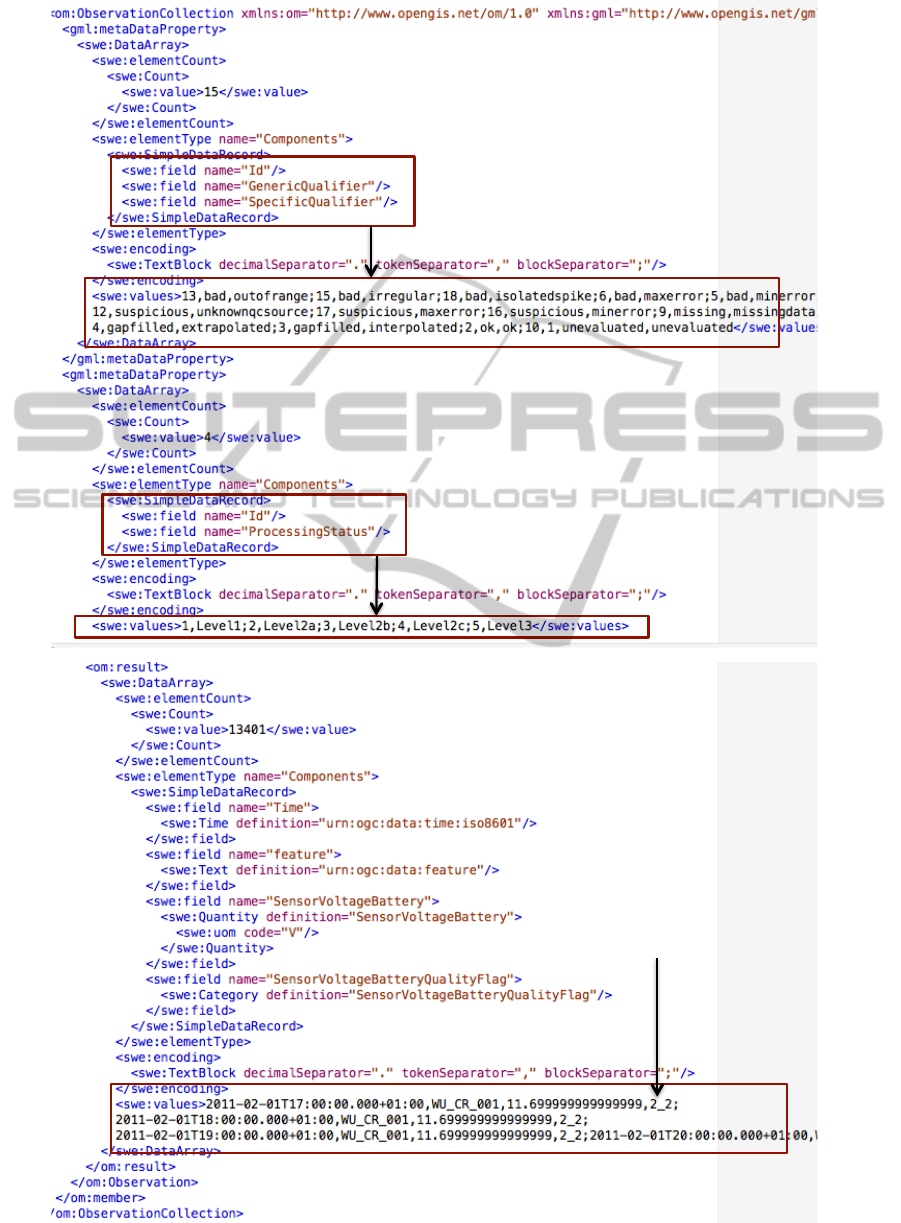
. . . . . . . .
Quality Flags are represented in the order of
flag id, generic flag and specific flag
Data processing levels
Each observed value is
accompanied with a
reference combining a data
level id and a flag id.
Figure 7: GetObservation O&M response. Some parts of the XML are omitted for clarity purposes.
EnablingQualityControlofSensorWebObservations
25

lizing these is the customized Sensor Web Client that
enables visual inspection and flagging of data series.
We plan to extend the GetObservation request of
the SOS with a custom filter to enable data requests
based on flag concepts. (Bastin et al., 2013) imple-
mented a similar aspect focusing on uncertainty con-
cepts. An end-to-end aspect of the quality control of
observation data ranges from the selection and main-
tenance of instrumentations to the final assessment of
data at the product level. Concerning this, planned
future work is to incorporate descriptions about oper-
ation and maintenance sensing systems in the Sensor
Web as they provides additional information about the
causes of variability of measurements. Another in-
teresting line of work to pursue is coupling the qual-
ity control metadata to relevant ontology concepts to
support information discovery across disciplines. A
related study in this direction is that of (Fredericks
et al., 2009) who propose an ontology to form associ-
ations of quality tests of marine data between different
authorities.
ACKNOWLEDGEMENTS
The TERENO (Terrestrial Environmental Observato-
ries) funded by the Helmholtz Association. We would
also like to thank Simon Jirka for his insightful com-
ments.
REFERENCES
Aquatic Informatics (2012). Global hydrological monitor-
ing industry trends. Industry report, Aquatic In for-
matics Inc.
Bartha, M., Bleier, T., Dih, P., Havlik, D., Hilbring, D.,
Hugentobler, M., Iosifescu Enescu, I., Kunz, S., Puhl,
S., Scholl, M., Jacques, P., Schlobinski, S., Simonis,
I., Stumpp, J., Uslnder, T., and Watson, K. (2009).
Specification of the sensor service architecture ver-
sion 3 (document version 3.1). OGC Discussion Paper
(Project Deliverable D2.3.4) OGC 09-132r1, SANY
Consortium.
Bastin, L., Cornford, D., Jones, R., Heuvelink, G. B.,
Pebesma, E., Stasch, C., Nativi, S., Mazzetti, P.,
and Williams, M. (2013). Managing uncertainty in
integrated environmental modelling: The uncertweb
framework. Environmental Modelling & Software,
39(0):116 – 134. Thematic Issue on the Future of In-
tegrated Modeling Science and Technology.
Bogena, H., Kunkel, R., Ptz, T., Vereecken, H., Krueger, E.,
Zacharias, S., Dietrich, P., Wollschlaeger, U., Kunst-
mann, H., Papen, H., Schmid, H., Munch, J., Priesack,
E., Schwank, M., Bens, O., Brauer, A., Borg, E., and
Hajnsek, I. (2012). Tereno - long-term monitoring net-
work for terrestrial environmental research. Hydrolo-
gie und Wasserbewirtschaftung: HyWa, 56:138 – 143.
Record converted from VDB: 12.11.2012.
Botts, M. E., Percivall, G., Reed, C., and Davidson, J.
(2008). OGC Sensor Web Enablement: Overview
and High Level Architecture. In Second International
Conference on GeoSensor Networks (GSN 2006), Re-
vised Selected and Invited Papers, Boston, MA, USA.
Springer.
Brauner, J., Brring, A., Bgel, U., Favre, S., Hohls, D., Holl-
mann, C., Hutka, L., Jirka, S., Jrrens, E. H., Kadner,
D., Kunz, S., Lemmens, R., McFerren, G., Mendt, J.,
Merigot, P., Robin, A., Osmanov, A., Pech, K., Schn-
rer, R., Simonis, I., Stelling, N., Uslnder, T., Watson,
K., and Wiemann, S. (2013a). D4.14 specification
of the advanced swe concepts (issue 4) - eo2heaven
sii architecture specification part v. Technical report,
EO2HEAVEN Consortium. Ed.: Jirka, Simon.
Brauner, J., Hutka, L., Jirka, S., Jrrens, E. H., Kadner, D.,
Mendt, J., Angel, P., Pech, K., Wiemann, S., Schulte,
J., Tellez-Arenas, A., Perrier, P., and Lpez, J. (2013b).
Eo2heaven d5.16final generic components documen-
tation. Technical report, EO2HEAVEN Consortium.
Broering, A., Echterhoff, J., Jirka, S., Simonis, I., Everding,
T., Stasch, C., Liang, S., and Lemmens, R. (2011).
New generation sensor web enablement. Sensors,
11(3):2652—2699.
CEC and IODE (1993). Manual of Quality Control Pro-
cedures for Validation of Oceangraphic Data. UN-
ESCO, ioc manuals and guides no. 26 edition.
Conover, H., Berthiau, G., Botts, M., Goodman, H. M., Li,
X., Lu, Y., Maskey, M., Regner, K., and Zavodsky,
B. (2010). Using sensor web protocols for environ-
mental data acquisition and management. Ecological
Informatics, 5(1):32 – 41. Special Issue: Advances in
environmental information management.
DataONE (2013). Develop a quality assurance and quality
control plan. Online. This material is based upon work
supported by the National Science Foundation under
Grant Number 083094.
Devaraju, A., Kunkel, R., and Bogena, H. (2013). Incorpo-
rating quality control information in the sensor web. In
Geophysical Research Abstracts - EGU General As-
sembly 2013, volume 15, page 13766. EGU General
Assembly.
Dorigo, W. A., Wagner, W., Hohensinn, R., Hahn, S.,
Paulik, C., Drusch, M., Mecklenburg, S., van Oevelen,
P., Robock, A., and Jackson, T. (2011). The interna-
tional soil moisture network: a data hosting facility for
global in situ soil moisture measurements. Hydrology
and Earth System Sciences Discussions, 8(1):1609–
1663.
Fredericks, J., Botts, M., Bermudez, L., Bosch, J., Bog-
den, P., Bridger, E., Cook, T., Delory, E., Graybeal,
J., Haines, S., Holford, A., Rueda, C., Sorribas Cer-
vantes, J., Tao, F., and Waldmann, C. (2009). Inte-
grating quality assurance and quality control into open
geospatial consortium sensor web enablement. In
Hall, J., Harrison, D., and Stammer, D., editors, Pro-
ceedings of OceanObs 2009: Sustained Ocean Ob-
SENSORNETS2014-InternationalConferenceonSensorNetworks
26

servations and Information for Society, volume 2 of
Community White Paper. ESA Publication WPP-306.
Garcia, M. (2010). NOAA IOOS Data Integration Frame-
work (DIF) - IOOS Sensor Observation Service Install
Instructions. Technical report, Integrated Ocean Ob-
serving System (IOOS) Program Office. Version 1.2.
IOC of UNESCO (2013). Ocean Data Standards, Vol.3:
Recommendation for a Quality Flag Scheme for the
Exchange of Oceanographic and Marine Meteorolog-
ical Data. Online.
ISO9000 (2005). Quality management systems - fundamen-
tals and vocabulary.
Konovalov, S., Garcia, H. G., Schlitzer, R., Devine, L.,
Chandler, C., Moncoiff, G., Suzuki, T., and Kozyr, A.
(2012). Proposal to adopt a quality flag scheme stan-
dard for data exchange in oceanography and marine
meteorology. IODE GEBICH, 1.2 edition.
Kunkel, R., Sorg, J., Eckardt, R., Kolditz, O., Rink, K., and
Vereecken, H. (2013). TEODOOR: a distributed geo-
data infrastructure for terrestrial observation data. En-
vironmental Earth Sciences, 69(2):507–521.
Mauder, M., Cuntz, M., Dre, C., Graf, A., Rebmann, C.,
Schmid, H. P., Schmidt, M., and Steinbrecher, R.
(2013). A strategy for quality and uncertainty assess-
ment of long-term eddy-covariance measurements.
Agricultural and Forest Meteorology, 169(0):122 –
135.
Mitsos, A., Shirakawa, T., Adam, R., and C. Lautenbacher,
C. (2005). Global Earth Observation System of Sys-
tems (GEOSS) 10-Year Implementation Plan. Number
ESA BR-240 in GEO 1000. ESA Publications Divi-
sion, Netherlands. ISBN 92-9092-495-0.
Na, A. and Priest, M. (2007). Sensor Observation Service.
Online. Version: 1.0.
Schlitzer, R. (2013). Oceanographic quality flag schemes
and mappings between them (version: 1.4). Technical
report, Alfred Wegener Institute for Polar and Marine
Research, Germany.
Stuart, E. M., Veres, G., Zlatev, Z., Watson, K., Bommers-
bach, R., Kunz, S., Hilbring, D., Lidstone, M., Shu,
T., and Jacques, P. (2009). SANY Fusion and Mod-
elling Architecture. OGC Discussion Paper OGC 10-
001, SANY Consortium. Deliverable D3.3.2.3, Ver-
sion 1.2.
Tarboton, D. G., Horsburgh, J. S., and Maidment, D. R.
(2008). CUAHSI Community Observations Data
Model (ODM) Version 1.1 Design Specifications.
Technical report, The Consortium of Universities for
the Advancement of Hydrologic Science (CUAHSI).
Williams, M., Cornford, D., Bastin, L., and Pebesma, E.
(2009). Uncertainty Markup Language (UnCertML).
Open Geospatial Consortium (OGC).
WMO (1994). Guide to Hydrological Practice - Data
acquisition and processing analysis, forecasting and
other applications (WMO-No. 168). Technical report,
World Meteorological Organization (WMO).
WOCE (1994). WHP 91-1 : WOCE Operations Man-
ual. World Ocean Circulation Experiment (WOCE),
WOCE Report No. 68/91 edition.
Zacharias, S., Bogena, H., Samaniego, L., Mauder, M., Fu,
R., Ptz, T., Frenzel, M., Schwank, M., Baessler, C.,
Butterbach-Bahl, K., Bens, O., Borg, E., Brauer, A.,
Dietrich, P., Hajnsek, I., Helle, G., Kiese, R., Kun-
stmann, H., Klotz, S., Munch, J., Papen, H., Prie-
sack, E., Schmid, H., Steinbrecher, R., Rosenbaum,
U., Teutsch, G., and Vereecken, H. (2011). A network
of terrestrial environmental observatories in germany.
Vadose zone journal, 10:955 – 973.
EnablingQualityControlofSensorWebObservations
27
