A Bottom-up Approach to Class-dependent Feature Selection for
Material Classification
Pascal Mettes, Robby Tan and Remco Veltkamp
Department of Information and Computing Sciences, Utrecht University, Utrecht, The Netherlands
Keywords:
Material Classification, Class-dependent Selection, Feature Selection, Polar Grids, Feature-space Weighting.
Abstract:
In this work, the merits of class-dependent image feature selection for real-world material classification is
investigated. Current state-of-the-art approaches to material classification attempt to discriminate materials
based on their surface properties by using a rich set of heterogeneous local features. The primary foundation
of these approaches is the hypothesis that materials can be optimally discriminated using a single combination
of features. Here, a method for determining the optimal subset of features for each material category separately
is introduced. Furthermore, translation and scale-invariant polar grids have been designed in this work to show
that, although materials are not restricted to a specific shape, there is a clear structure in the spatial allocation
of local features. Experimental evaluation on a database of real-world materials indicates that indeed each
material category has its own preference. The use of both the class-dependent feature selection and polar grids
results in recognition rates which exceed the current state-of-the-art results.
1 INTRODUCTION
The ability to recognize materials is of vital impor-
tance to the human visual system, since it enhances
our understanding of the world and enables us to bet-
ter interact with the objects around us. This ability
determines e.g. whether a road is dry or slippery,
whether an object is light or heavy, or whether a piece
of fruit is rotten or fresh. Given the ubiquitous nature
of materials, a robust material recognition system has
a wide variety of applications, including exploration,
robot movement, robot grappling, and food control.
Traditionally, recognition tasks in computer vision
focus on other related tasks such as object recogni-
tion and texture recognition. Given these recognition
tasks, it is arguable whether tackling materials in a
separate recognition task holds any validity. The in-
tuition behind tackling materials in a separate recog-
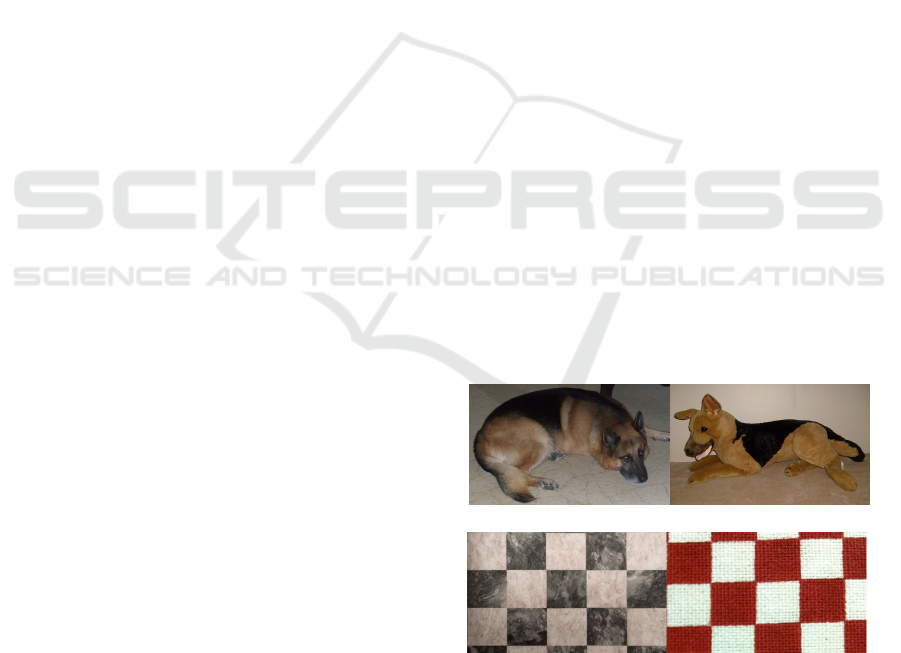
nition task is exemplified in Fig. 1(a) and 1(b). Al-
though there is a correlation between object category
and material category, Fig. 1(a) shows that objects
with a similar shape can consist of different surface
materials. Fig. 1(b) shows a similar argument in the
context of materials and textures; surfaces with simi-
lar texture patterns can be made of different materials.
In order to gain empirical knowledge on mate-
rial recognition, current state-of-the-art approaches to
material recognition exploit a set of heterogeneous
(a) Objects vs. materials
(b) Textures vs. materials
Figure 1: Visual examples showing that, although materi-
als are correlated to objects and textures, there is no direct
correspondence.
features on a dataset of real-world materials, to test
which types of features have a positive influence on
the overall recognition rate (Hu et al., 2011; Liu et al.,
2010; Sharan et al., 2013). De facto standard for
evaluating these algorithms is the Flickr Materials
Database, a database containing 1000 snapshot im-
ages of 10 materials, taken from the real-world (Sha-
ran et al., 2009). The 10 materials used in the database
are fabric, foliage, glass, leather, metal, paper, plas-
tic, stone, water, and wood.
By creating a single feature combination based on
494
Mettes P., Tan R. and Veltkamp R..
A Bottom-up Approach to Class-dependent Feature Selection for Material Classification.
DOI: 10.5220/0004721204940501
In Proceedings of the 9th International Conference on Computer Vision Theory and Applications (VISAPP-2014), pages 494-501
ISBN: 978-989-758-004-8
Copyright
c
2014 SCITEPRESS (Science and Technology Publications, Lda.)

(a) (b)
Figure 2: Visual examples of resp. the CUReT database and the Flickr Materials Database.
a (sub)set of image features to discriminate all ma-
terials, current state-of-the-art approaches follow the
main hypothesis that materials can be optimally dis-
criminated by means of a set of shared visual prop-
erties. In this work, it is shown that this hypothesis
is suboptimal. By introducing a method for creating
class-dependent feature subsets, it is shown that judg-
ing each material separately provides a surge in the
overall recognition rate. In this method, a rich col-
lection of local features is extracted from the images,
and the bag-of-words model is used to represent each
image as a relative distribution of clusters, for each
feature separately. Rather than combining features
which yield a high overall recognition rate, features
are combined for each material separately. The no-
tion of finding a subset of features for each material
category separately is based on the intuition that only
a small subset of features is useful for a single ma-
terial. E.g. water can be optimally recognized by its
ripples, while wood can be optimally recognized by
its colour and grains.
Besides creating feature subsets per material, it
is furthermore shown in this work that the addition
of spatial information has a positive influence on the
overall material recognition framework. The model
is extended here by introducing translation and scale-
invariant polar grids to describe spatial information of
the clusters in the image-space. Experimental results
show that class-dependent feature subsets and spatial
information yield an overall recognition rate which
outperform current approaches.
The rest of the paper is organized as follows.
In Section 2, previous and related work on mate-
rial recognition is discussed. Section 3 elaborates
on the local features used in the method, while Sec-
tion 4 explains the invariant polar grids. In section
5, the method for finding the optimal feature subset
per material and for classifying unknown images is
explained. The experimental results of using spatial
information and class-dependent feature subsets are
shown in Section 6, after which the work is concluded
in Section 7.
2 RELATED WORK
Traditionally, material recognition has been re-
searched as part of texture recognition, although it has
been pointed out in the previous section that there is
a discrepancy between materials and textures. In re-
cent years, the CUReT database (Dana et al., 1999)
and the KTH-TIPS2 database (Caputo et al., 2010)
have become a standard for texture/material recogni-
tion. As indicated in (Liu et al., 2010), near-optimal
results have been reported on both databases, or can
be achieved with a global image feature selection
process, as discussed below. Although the achieved
recognition rates seem optimistic, it has been argued
that this is partly due to the limited variations in the
CUReT database (Liu et al., 2010; Varma and Zisser-
man, 2009). Most notably, the database shows little
significant changes in scale and rotation, and there is
furthermore little intra-class variance and little noise
from the environment. Even though the KTH-TIPS2
database provides variations in scale, pose, and illu-
mination, the samples are still photographed in a lab-
oratory setting.
Rather than using texture samples photographed
under restricted conditions, the newly introduced
Flickr Materials Database (Sharan et al., 2009) con-
tains images of materials taken from real-world ob-
jects under unknown lighting conditions and cam-
era positions. Fig. 2 shows examples of both the
CUReT database and the Flickr Materials Database.
The work by Liu et al. shows that the state-of-the-
art approaches on the CUReT database are far from
optimal on the new database, yielding a recognition
rate of 23.8% (Liu et al., 2010). In contrast, their
own greedy algorithm to select a single concatena-
tion of feature distributions yields a recognition rate
of 44.6%. This performance has later been improved
to 54 %(Hu et al., 2011), 57.1%, (Sharan et al., 2013),
and 57.4%, (Qi et al., 2012).
The method presented here hypothesizes that
global feature concatenation is suboptimal for mate-
rial recognition. The idea of class-dependent feature
selection to discriminate materials was first coined in
ABottom-upApproachtoClass-dependentFeatureSelectionforMaterialClassification
495
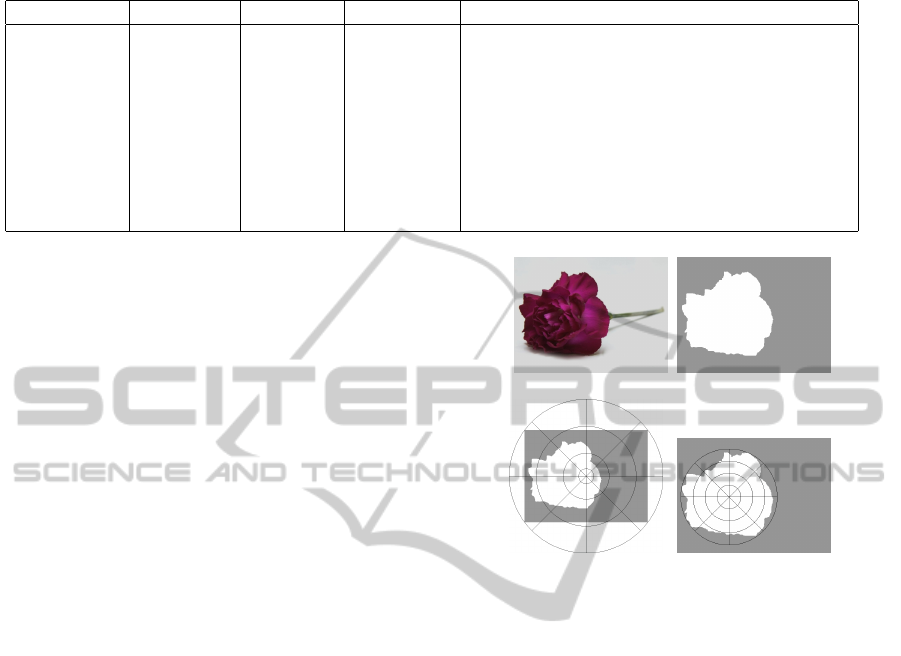
Table 1: Overview of the local image features.
Name Dimension Patch size Nr. clusters Short description
Colour 27 3 ×3 150 Concatenation of RGB values.
SIFT 128 16 × 16 250 SIFT descriptor (Lowe, 2004).
Jet 8 49 × 49 200 MR8 filter bank (Varma and Zisserman, 2005).
Micro-SIFT 128 16 × 16 250 SIFT on residual images.
Micro-Jet 8 49 × 49 200 Jet on residual images.
HOG 9 8 × 8 150 HOG descriptor (Dalal and Triggs, 2005).
Curvature 3 - 150 Curvature at scales 2-5-8 for edge pixel.
Edge-slice 54 42 × 8 200 Concatenation of 6 HOGs along edge normal.
Edge-ribbon 54 42 × 8 200 Concatenation of 6 HOGs along edge tangent.
(Caputo et al., 2005), using Class-Specific SVM. The
CS-SVM does however not provide the level of free-
dom desired here to fully examine what types of im-
age features are discriminative for individual material
classes. Therefore, a bottom-up approach is presented
to give target classes full freedom of feature selection.
3 FEATURE EXTRACTION
In order to state the effectiveness of bottom-up class-
dependent feature selection and spatial enhancement
for material classification, a rich set of heterogeneous
local features is used to describe the images in the
database. In total, 9 image features are used. These
features constitute the 8 features of Liu et al. (Liu
et al., 2010) and Sharan et al. (Sharan et al., 2013),
as well as a local HOG descriptor (Dalal and Triggs,
2005). An overview of the features and their settings
is provided in Table 1.
The 9 features yield a large set of instances for
each image. In order to define an image by a single
vector for a single feature, the bag-of-words model is
used. For a single feature, this is done by collecting
all vectors of all training images. These instances are
then clustered using the k-means algorithm to form K
clusters. Given these K clusters, each image is then
defined by a single vector of length K as the rela-
tive distribution of the K clusters in the image. Since
multiple, heterogeneous features are used for material
recognition, this process is done for each feature sep-
arately. As a result, each image is defined by a vector
for each feature.
4 INVARIANT POLAR GRIDS
As is well-known, the standard bag-of-word model
used for the image features disregards the spatial lay-
out of the individual descriptors. In fields such as ob-
ject and scene recognition, incorporating a rough di-
(a) (b)
(c) (d)
Figure 3: The effect of adding translation and scale invari-
ance to the polar grids.
vision of the image plane has a long history of empir-
ical success, e.g. using SPM (Lazebnik et al., 2006).
In material recognition however, a similar approach
has hardly been attempted for material recognition,
mostly because materials are not bound to a specific
shape (Biederman, 1987).
Although materials are not bound to a specific
shape, there can be a specific structure in the spatial
allocation of clusters in image space. Furthermore,
the bottom-up classification approach discussed in the
next section is designed such that inferior results ac-
quired with a form of spatial enhancement results in
materials not using the enhancement. In order to ex-
perimentally verify the structure hypothesis, invariant
polar grids are used, which are based on the log-polar-
based image subdivision and representation of (Zhang
and Mayo, 2010).
In the log-polar-based image representation, each
local feature is not only described by the feature-
values itself, but also by its orientation and log-
distance with respect to a central point. An exam-
ple of a single log-polar shape is shown in Fig. 3(c),
where a distribution is created for each of the 32 bins.
Since this work is focused on classification, not detec-
tion, the provided foreground information is not only
VISAPP2014-InternationalConferenceonComputerVisionTheoryandApplications
496
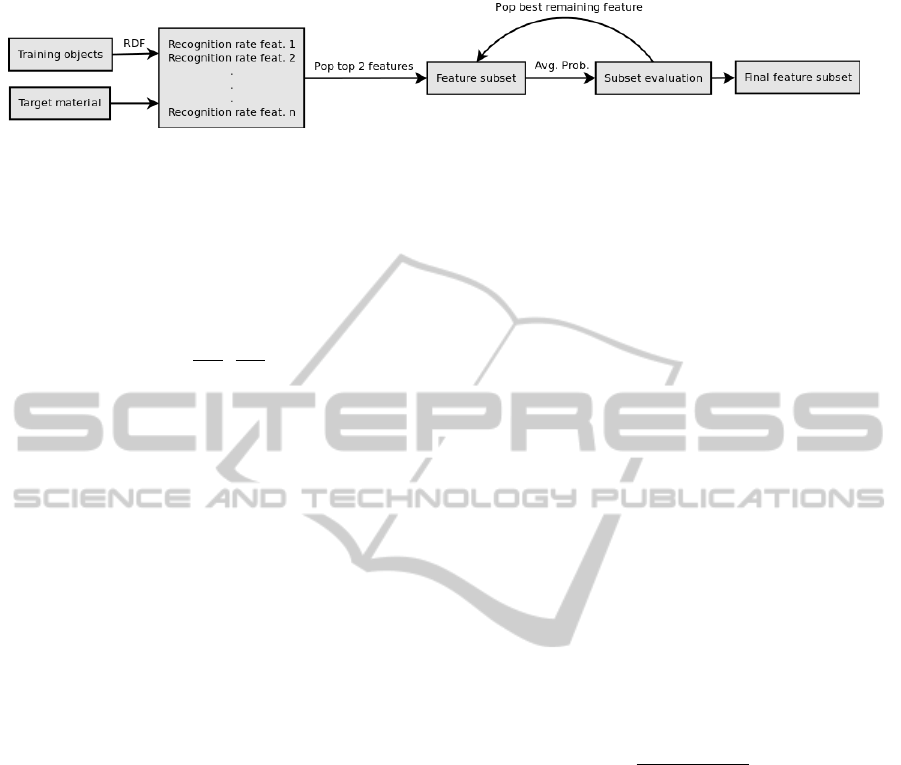
Figure 4: Overview of the feature subset selection for a single material category (which is provided as input).
exploited for extracting the descriptors, but also for
the polar grids. This is achieved by making the polar
grids translation- and scale-invariant. Given a mate-
rial present in an image, the central point c
xy
is defined
as the first-order moment of the foreground pixels in
the binary image:
c
xy
= (
µ
1,0
µ
0,0
,
µ
0,1
µ
0,0
), (1)
µ
m,n
=
w
∑
x=0
h
∑
y=0
x
m
y
n
f (x, y), (2)
where w and h denote the width and height of the im-
age, and f (x, y) is 1 for foreground pixels and 0 oth-
erwise. The maximum scale is defined as the mini-
mum bounding circle of the foreground pixels given
the first-order moment. The result is visualized in Fig.
3(d). In the work by Zhang and Mayo, the logarithm
of the distance was used to create more emphasis on
points closer to the central point. However, since no
empirical evidence was found that the log-distance is
preferable over the distance for material recognition,
regular polar grids have been used here.
Ideally, all 9 features are enhanced using the polar
grids, but not all features are equally well represented
throughout the surface of the material, since they ei-
ther rely on stable keypoints or on edges. For that
reason, the 4 features taken from a uniform grid are
enhanced: Colour, Jet, Micro-Jet, and HOG. As a re-
sult, a total of 13 features are used in the classification
method.
5 CLASSIFYING MATERIALS
Given the local features, an image is defined by up
to 13 distributions. However, it is unknown how well
each feature works both in general and for each mate-
rial separately. For that reason a method is designed
in this work to fully utilize the performance of the
features. The method can roughly be divided into two
stages. In the first stage, the optimal feature subset for
each material category is determined, while the sec-
ond stage utilizes the class-dependent feature subsets
for classification.
5.1 Class-dependent Selection
The method for determining the optimal subset of fea-
tures for a single material is visualized in Figure 4.
The input of the algorithm are a training set, where
each training image is defined by a dictionary of vec-
tors {D
i
}
F
i=1
, with F the total number of features,
and a material m for which the optimal feature sub-
set needs to be determined.
First, the training set is divided into a training sub-
set and a validation set. For each feature f ∈ F, a
Decision Forest (Criminisi et al., 2012) is trained on
the training subset using the respective dictionary en-
tries. In other words, for each feature f , a forest is
trained using the dictionary entry D
f
of each exam-
ple of the training subset. Given a Decision Forest for
each feature, the quality of each feature can be deter-
mined based on the recognition rate achieved by the
forest on the validation set. The output of a Deci-
sion Forest is a probability distribution over the space
of material classes Ω = {c
1
, .., c
m
}. As a result, the
recognition rate r of an image feature f for a specific
material m can be computed as follows:
r
m f
=
∑
V
m
i=1
q(m, f , i)
V
m
, (3)
where V denotes the set of images in the validation
set, V
m
⊂ V denotes the set of images for material m,
and q(m, f , i) is:
q(m, f , i) =
1 if m = argmax
c∈M
p
(i)
(c| f )
0 otherwise.
(4)
Intuitively, the above equations define the recogni-
tion rate of a material for a single feature by the true
positive rate. The feature combination for one mate-
rial is used in the method as follows. First the top
2 performing features are combined and the recogni-
tion rate of the combination is evaluated on the av-
eraged probability distributions. After that, the best
working remaining features are added one-by-one to
the combination and re-evaluated until the recognition
rate drops. This results in the optimal feature subset
of material m. This whole process is repeated for each
material, resulting in class-dependent feature subsets
for the whole range of material categories.
ABottom-upApproachtoClass-dependentFeatureSelectionforMaterialClassification
497

The above defined algorithm is related to the
methods of (Liu et al., 2010) and (Sharan et al., 2013),
but contains multiple key differences. First, the selec-
tion procedure is performed for each material, rather
than for all materials combined. Also, the features are
combined here using late fusion (i.e. by averaging the
probability distributions), while (Liu et al., 2010) et
al. and (Sharan et al., 2013) combine features by con-
catenating the feature distributions and retraining the
whole training set on the concatenated vector. With
late fusion, new combinations do not need to be re-
trained, which greatly reduces the amount of training
effort (Snoek et al., 2005). Lastly, a discriminative
classification method is used, as is also done in (Sha-
ran et al., 2013).
5.2 Classifying a Test Image
Classification based on class-dependent feature sub-
sets is considerably different from classification based
on a single subset. For a single subset, classification
can be done by placing the training objects in the re-
spective feature space and making predictions based
on inferred decision boundaries. For class-dependent
feature subsets, this is not directly applicable.
More conceptually, the difference can be viewed
in the context of material recognition as follows.
Classification based on a single subset can be inter-
preted as discriminating materials based on a set of
shared properties. Class-dependent feature subsets
however, perform classification from the other end of
the spectrum. Classification is done by modeling test
images as if they were a specific material, after which
the quality of the modeling process is determined. In
this context, quality is understood as the probability
of an unknown image being a specific material, if it is
modeled as such.
In other words, an unknown test image is placed
in the feature space of the feature subset of each pos-
sible material category. Because of the use of De-
cision Forests, the quality of the test image can be
stated for each feature space S
m
by the probability
P
m
of being material m. For M material categories,
this results in M probability outputs, P
1
, P
2
, .., P
M
. Al-
though it is possible to make a prediction based on
the outputs by choosing the material category which
yields the highest probability, the result can be bi-
ased, since the probabilities are yielded from different
feature spaces. To compensate for this, weights are
added to each probability value, based on the heuris-
tic weight method by Wang et al. (Wang et al., 2008).
The weight for each material m is determined as
the probability of the test image of being material m
in the union set of the feature subsets. More formally,
given the feature subsets of the material categories
X
1
, X
2
, .., X
M
, the union set is defined as ∪
M
m=1
X
m
.
The weight for material m is stated as the proba-
bility of the test image of being material m in the
union set, denotes here as W
m
. Given the probabilities
and weights, the material category for a test image is
stated as the maximum weighted category probability,
i.e.:
m
∗
= argmax
m
P
m
W
m
. (5)
6 EXPERIMENTATION
Similar to (Liu et al., 2010), (Hu et al., 2011), and
(Sharan et al., 2013), the experimental evaluation is
focused on the Flickr Materials Database, where the
100 images for each material category are divided into
50 images for training and 50 images for testing. The
experimental results are presented in three-fold. First,
the choice of Decision Forests in this method is justi-
fied by showing the effectiveness of the Decision For-
est over the Latent Dirichlet Allocation approach by
(Liu et al., 2010) for material classification. Second,
the effects of adding spatial information to the 4 uni-
formly sampled local features are shown. Third, the
results of the method as a whole are shown.
6.1 Decision Forests and αLDA
In order to experimentally verify the effect of the
method and the spatial feature enhancement, the La-
tent Dirichlet Allocation approach for material recog-
nition of (Liu et al., 2010) could have been used, since
LDA also yields probabilistic results. The main rea-
son to prefer Decision Forests over LDA is due to the
ability of Decision Forests to yield higher recognition
rates, as is indicated in Table 2.
Table 2: The performance of the local features in isolation
and the performance of the single subset.
Feature (Liu et al., 2010) Decision Forest
SIFT 35.2% 44.2%
Jet 29.6% 37.8%
HOG 37.6%
Micro-Jet 21.2% 37.4%
Colour 32% 37%
Micro-SIFT 28.2% 35%
Edge-Ribbon 30% 33.6%
Edge-Slice 33% 33.2%
Curvature 26.4% 30.2%
Single subset 44.6% 52.6%
The results in Table 2 show that both the performance
of the individual features and the performance us-
ing a single feature subset are improved when using
VISAPP2014-InternationalConferenceonComputerVisionTheoryandApplications
498
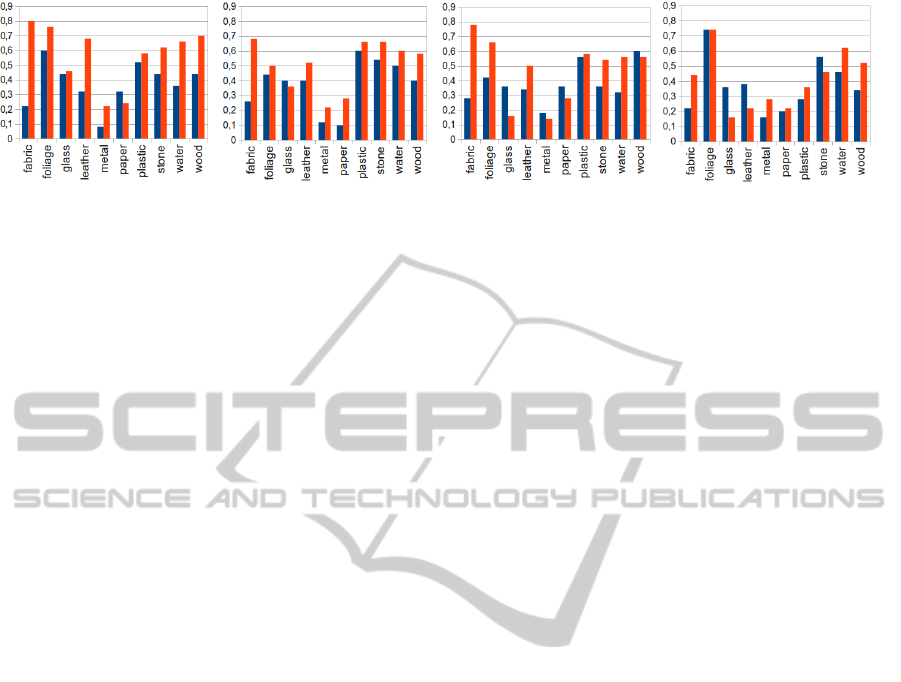
(a) Micro-Jet: 37.4% - 57.4% (b) HOG: 37.6% - 50.6% (c) Jet: 37.8% - 47.6% (d) Colour: 37% - 40.2%
Figure 5: Recognition rates per material for each enhanced feature, for resp. local (blue, left) and spatial (red, right).
Decision Forests over LDA, indicating that Decision
Forests are superior to LDA for the purpose of super-
vised material classification. This result is not incon-
sistent with current literature on LDA as a supervised
classifier. In the work by Chan and Tian, it was exper-
imentally shown that LDA is inferior to SVM for the
purpose of supervised scene classification (Chen and
Tian, 2011). Furthermore, Blei and McAuliffe stated
in their work on supervised topic models that topics
inferred in unsupervised topic models, such as LDA,
might not optimally represent each target class (Blei
and McAuliffe, 2010). Also, follow-up work by Sha-
ran et al. indicated the preference of a discriminative
classifier in the form of a SVM over LDS for material
classification (Sharan et al., 2013). Therefore, Deci-
sion Forests are opted here, rather than LDA.
6.2 Polar Grid Effect
In Figure 5, the recognition rates are shown for the
4 uniformly sampled local features. In all 4 situa-
tions, the use of spatial information provided a boost
in the overall recognition rate. For the Micro-Jet fea-
ture, the performance gain was the most obvious, with
a 53% improvement of recognition rate, from 37.4%
to 57.4%. It is interesting to note that the recogni-
tion rate yielded by the spatially enhanced Micro-Jet
feature is higher than the recognition rate yielded us-
ing an optimal single combination of local features,
as shown in Table 2.
The use of the invariant polar grids also has a pos-
itive influence on the overall recognition rate of the
other 3 local features, with a boost of 35%, 26%, and
9% for resp. the HOG, Jet, and Colour feature. Even
though the introduction of spatial allocation for mate-
rial recognition has a positive influence on the overall
recognition rate, it does not have a strictly positive
influence on each material category, which indicates
that features are not always more descriptive for each
material when spatial information is added. For that
reason, the 4 local features are not replaced by the
spatially enhanced features in the method, leaving it
up to the individual materials to decide whether the
spatially enhanced features are added as part of the
optimal feature subset.
6.3 Class-dependent Subsets
Given the Decision Forests as classifier and the 13
distributions per image, the effectiveness of class-
dependent image feature selection can be verified.
The justification of using a separate feature subset
for each material category is for the first part shown
in Table 3. Table 3 shows which of the 13 features
have been used in the method for each material cate-
gory of the Flickr Materials Database. Not only do
the class-dependent feature subsets show that differ-
ent features are valuable for different materials, they
also show that the number of features used for each
material differs greatly. These degrees of freedom
would not have been possible with a single feature
subset. Given the feature subsets of each material cat-
egory in Table 3, an overall recognition rate of 67.8%
is achieved. If the 13 features are used to create a
single feature subset, the subset consists of 5 features
(Spatial Micro-Jet, Spatial HOG, Spatial Jet, SIFT,
and Spatial Colour), yielding an overall recognition
rate of 63.6%. These two results, compared to the
results of Table 2 show that both elements have a pos-
itive influence on the recognition of materials. The
final result of 67.8% is not only a direct improvement
over current state-of-the-art approaches on material
recognition (Sharan et al., 2013; Liu et al., 2010; Hu
et al., 2011; Qi et al., 2012), it also provides informa-
tion regarding the general perception and cognition of
materials. An interesting observation in that respect is
e.g. the choice of features and corresponding recog-
nition rate for fabric, which indicates the importance
of the repeating pattern and spatial correlation of lo-
cal elements on these features. On the other hand, the
materials leather and wood receive a surge in recogni-
tion rate with the introduction of spatial enhancement
and the primary focus on textural elements.
The recognition rate is primarily held back by the
materials metal, paper, and glass. This is mostly due
to the fact that the best performing feature types - tex-
ABottom-upApproachtoClass-dependentFeatureSelectionforMaterialClassification
499
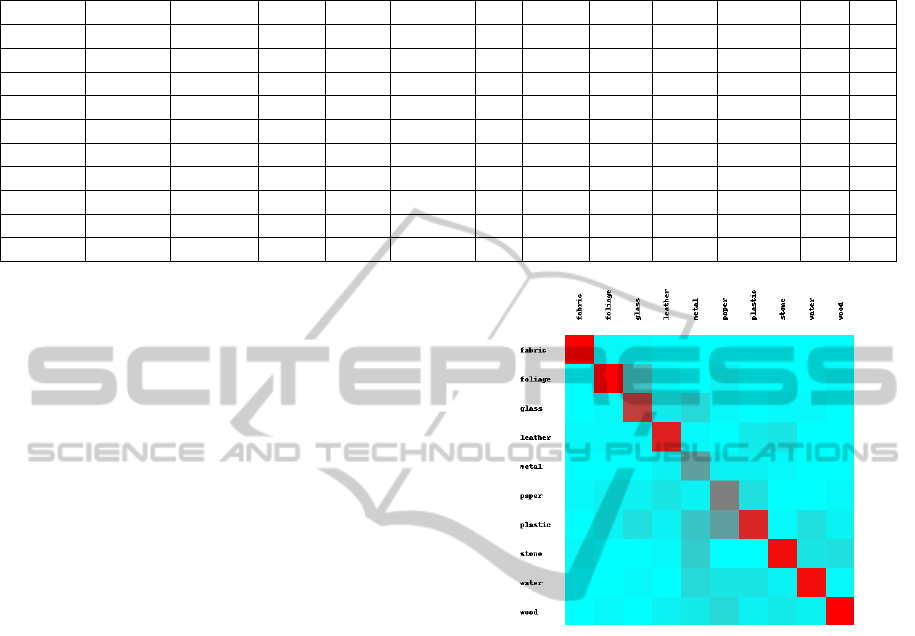
Table 3: The features used in the optimal feature subset for each material separately. The Curvature feature is not shown,
given that no material opted for that feature in their subset.
MJet(s) HOG(s) Jet(s) SIFT RGB(s) Jet HOG MJet RGB MSIFT ER ES
Fabric ◦ ◦
Foliage ◦ ◦ ◦ ◦ ◦ ◦ ◦ ◦
Glass ◦ ◦ ◦ ◦ ◦ ◦ ◦ ◦
Leather ◦ ◦ ◦
Metal ◦ ◦ ◦ ◦
Paper ◦
Plastic ◦ ◦ ◦ ◦ ◦ ◦ ◦
Stone ◦ ◦ ◦ ◦
Water ◦ ◦ ◦ ◦
Wood ◦ ◦ ◦
ture, shape, and colour - fail to capture the specifics
of those materials. The curvature and reflectance-
based features, features which could provide more
information regarding these materials, are systemat-
ically under-performing in this system, because the
edge map is based on changes in the intensity pattern,
rather than based on the contours of the materials. In
order to better capture all materials, the range of fea-
tures should therefore be broadened for elements such
as reflectance and transparency.
In Fig. 7, the recognition rates for each material
are shown for our method, as well as for (Liu et al.,
2010) and (Sharan et al., 2013). Note that since the
feature pool of this method is nearly identical to their
feature pool, the method of this work is merely more
expressive in using the information provided by the
features, rather than overfitting the problem. More in-
teresting, given the choice of late fusion over early
fusion for feature combination, the additional layer of
information comes with a lower computational cost
in the training stage. This can prove to be useful
when moving towards large-scale material classifica-
tion and detection.
From the Figure, it is clear that the higher over-
all recognition rates are primarily due to the signifi-
cant improvements by the materials fabric, wood, and
leather. All other materials report modest improve-
ments, with the exception of foliage, metal, and pa-
per; foliage already yields high recognition rates in
earlier methods, while the latter two are not effec-
tively captured by the features. Note that since the pri-
mary focus of this work is on stating the importance
of treating each material independently (i.e. creating
Table 3) instead of yielding optimal recognition rates,
the method can be further improved. For example,
the image features can be treated as weak classifiers
and can be used for boosting for each material sep-
arately, resulting in a more natural order and weight
of each image feature for each material. This could
help with clearing up confusions between e.g. glass-
Figure 6: Confusion matrix of the class-dependent feature
selection method.
metal, plastic-paper, glass-foliage, and leather-stone,
as indicated in Fig. 6.
7 CONCLUSIONS
In this work, a new method for class-dependent im-
age feature selection using Decision Forests has been
introduced for the purpose of material recognition.
The main hypothesis on which this method is built, is
that materials are not optimally recognized by means
of discriminating within a set of shared attributes,
but that each material is recognized by a set of per-
sonal attributes. Furthermore, translation and scale-
invariant polar grids have been introduced to capture
the spatial information of the local features. Exper-
imental results on the challenging Flickr Materials
Database show that both the class-dependent feature
subsets and the invariant polar grids create a surge in
the recognition rate to 67.8%, indicating that the hy-
potheses on which this work is built lead to a better
discrimination of materials. Given that image features
VISAPP2014-InternationalConferenceonComputerVisionTheoryandApplications
500
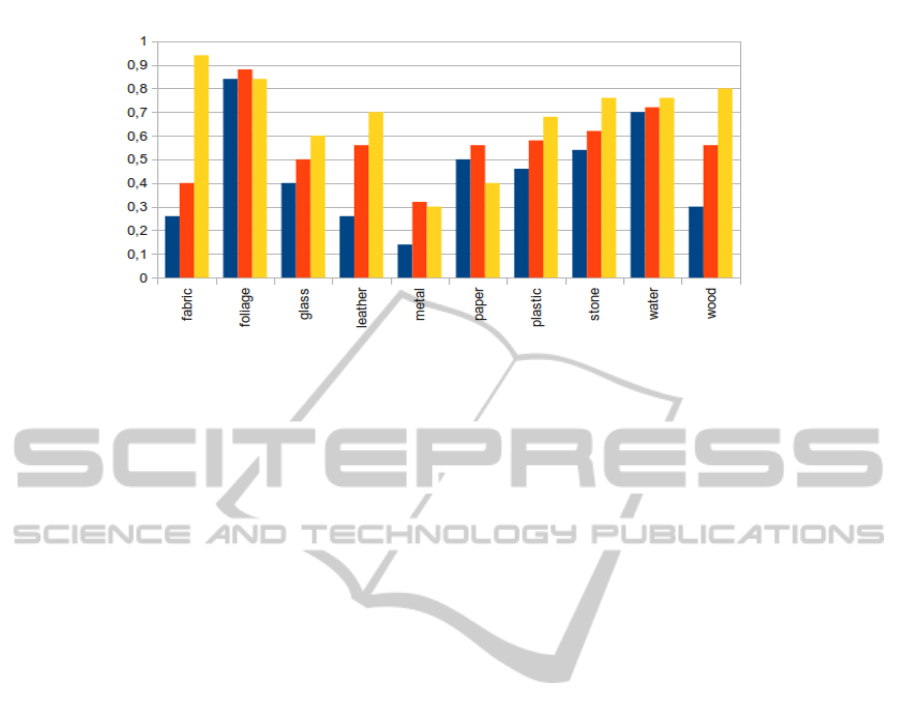
Figure 7: Recognition rate per material for our method (yellow) versus (Liu et al., 2010) (blue) and (Sharan et al., 2013) (red).
are combined in a process of late fusion, different fea-
tures do not have to be retrained, but can simply be
combined by averaging their probability distributions,
which greatly reduces the amount of required training
time.
ACKNOWLEDGEMENTS
This research is supported by the FES project COM-
MIT.
REFERENCES
Biederman, I. (1987). Recognition-by-components: A the-
ory of human image understanding. Psychological Re-
view, 94(2):115–147.
Blei, D. and McAuliffe, J. (2010). Supervised topic models.
Caputo, B., Hayman, E., Fritz, M., and Eklundh, J. (2010).
Classifying materials in the real world. Image and
Vision Computing, 28(2):150–163.
Caputo, B., Hayman, E., and Mallikarjuna, P. (2005). Class-
specific material categorisation. ICCV, 2:1597–1604.
Chen, S. and Tian, Y. (2011). Evaluating effectiveness of la-
tent dirichlet allocation model for scene classification.
WOCC, pages 1–6.
Criminisi, A., Shotton, J., and Konukoglu, E. (2012). De-
cision forests: A unified framework for classification,
regression, density estimation, manifold learning and
semi-supervised learning. Foundations and Trends in
Computer Graphics and Vision, 7(2):81–227.
Dalal, N. and Triggs, B. (2005). Histograms of oriented
gradients for human detection. CVPR, 1:886–893.
Dana, K., Ginneken, B. v., S.K., N., and Koenderink, J.
(1999). Reflectance and texture of real-world surfaces.
ACM Transactions on Graphics, 18(1):1–34.
Hu, D., Bo, L., and Ren, X. (2011). Toward robust material
recognition for everyday objects. BMVC, pages 48.1–
48.11.
Lazebnik, S., Schmid, C., and Ponce, J. (2006). Beyond
bags of features: Spatial pyramid matching for recog-
nizing natural scene categories. CVPR, 2:2169–2178.
Liu, C., Sharan, L., Adelson, E., and Rosenholtz, R. (2010).
Exploring features in a bayesian framework for mate-
rial recognition. CVPR, pages 239–246.
Lowe, D. (2004). Distinctive image features from scale-
invariant features. IJCV, 60(2):91–110.
Qi, X., Xiao, R., Guo, J., and Zhang, L. (2012). Pairwise
rotation invariant co-occurrence local binary pattern.
ECCV, 7577:158–171.
Sharan, L., Liu, C., Rosenholtz, R., and Adelson, E.
(2013). Recognizing materials using perceptually in-
spired features. IJCV, pages 1–24.
Sharan, L., Rosenholtz, R., and Adelson, E. (2009). Mate-
rial perception: What can you see in a brief glance?
[abstract]. Journal of Vision, 9(8):784.
Snoek, C., Worring, M., and Smeulders, A. (2005). Early
versus late fusion in semantic video analysis. In ACM
international conference on Multimedia, pages 399–
402. ACM.
Varma, M. and Zisserman, A. (2005). A statistical approach
to texture classification from single images. IJCV,
62(1):61–81.
Varma, M. and Zisserman, A. (2009). A statistical ap-
proach to material classification using image patch ex-
emplars. PAMI, 31(11):2032–2047.
Wang, L., Zhou, N., and Chu, F. (2008). A general wrap-
per approach to selection of class-dependent features.
IEEE Transactions on Neural Networks, 19(7):1267–
1278.
Zhang, E. and Mayo, M. (2010). Enhanced spatial pyra-
mid matching using log-polar-based image subdivi-
sion and representation. DICTA, pages 208–213.
ABottom-upApproachtoClass-dependentFeatureSelectionforMaterialClassification
501
