
Modelling Fluorescent Materials with a Spectral Overlap between
Excitation and Emission Spectrum
Sven Leyre
1,2,3
, Martijn Withouck
1,2
, Guy Durinck
1,2,3
, Geert Deconinck
2
and Peter Hanselaer
1,2,3
1
Light & Lighting Laboratory, KU Leuven, Gebroeders Desmetstraat 1, Leuven, Belgium
2
ESAT/ELECTA, KU Leuven, Kasteelpark Arenberg 10, bus 2445, Leuven, Belgium
3
SIM (Flemish Strategic Initiative on Materials), SOPPOM program, Technologiepark 935, Zwijnaarde, Belgium
Keywords: Modelling, Fluorescence, Adding-doubling.
Abstract: The adding-doubling method can be used to determine the reflection and transmission characteristics of
fluorescent materials. In this work, the method was adapted to allow the implementation of fluorescent
particles with a significant overlap between excitation and emission spectrum. The proposed method was
validated by comparing its results to the simulation results of traditional Monte Carlo ray tracing. The
average difference over the visible wavelength range between the two methods was found to be smaller than
0.5%. The proposed adding-doubling method was adapted for the simulation of a blue light-emitting diode
with a remote phosphor converter containing YAG:Ce phosphor. It was shown that it is important to take
the spectral overlap between excitation and emission spectrum into account to determine the colour
characteristics with sufficient accuracy.
1 INTRODUCTION
The adding-doubling (AD) method is a commonly
used evaluation method to quickly determine the
reflection and transmission characteristics of a stack
of homogeneous plane parallel layers (Wiscombe,
1969; Hansens, 1969; Prahl et al, 1993). The layers
may contain both surface and bulk scattering.
Recently, the method was extended for fluorescent
layers (Leyre et al, 2012). The method however does
not allow a spectral overlap between excitation and
emission spectrum of the fluorescent material. This
can be a problem for e.g. the prediction of colour
characteristics in lighting.
In white light-emitting diodes (LED) light
sources, blue LEDs are usually combined with a
yellow phosphor to obtain white light (Liu et al,
2010; Lee & Lee, 2006). The most commonly used
phosphor for LED applications is the Yttrium
Aluminium Garnet doped with Cerium (YAG:Ce).
This phosphor has a significant spectral overlap
between excitation and emission spectrum. At high
concentrations of the phosphor, this will cause a red
shift of the emitted spectrum, due to re-absorption
effects in the phosphor (Dhami et al, 1995). It is thus
important to take the spectral overlap between
excitation and emission spectrum into account when
predicting the colour properties of an LED light
source.
In this paper, an improved version of the adding-
doubling method for fluorescent layers is presented,
which allows the implementation of fluorescent
layers with a spectral overlap between excitation and
emission spectrum. First, the theoretical background
for the improved adding-doubling method is
presented, next the method is validated by
comparing the results with traditional Monte Carlo
ray tracing simulations. Finally, the significance of
the spectral overlap is shown by comparing the
predicted colour properties with and without the
overlap taken into account of a blue LED incident on
a remote phosphor converter containing YAG:Ce.
2 THEORETICAL
BACKGROUND
The AD method was first developed by Stokes
(Stokes, 1862) and allows the calculation of
reflection and transmission of a stack of layers. The
method has been adapted to allow the calculation of
reflection and transmission of a homogeneous plane
33
Leyre S., Withouck M., Durinck G., Deconinck G. and Hanselaer P..
Modelling Fluorescent Materials with a Spectral Overlap between Excitation and Emission Spectrum.
DOI: 10.5220/0004729700330038
In Proceedings of 2nd International Conference on Photonics, Optics and Laser Technology (PHOTOPTICS-2014), pages 33-38
ISBN: 978-989-758-008-6
Copyright
c
2014 SCITEPRESS (Science and Technology Publications, Lda.)

parallel slab containing bulk scattering (Wiscombe,
1969) and has found its way to the astronomy
(Hansen, 1969) and bio-medical field (Saeys et al,
1993). Recently, the method was adapted to allow
calculation of reflection and transmission of a
fluorescent layer (Leyre et al, 2012). The main
advantage of the AD method over e.g. Monte Carlo
ray tracing simulations is that the AD method is
much quicker. The Monte Carlo approach has the
advantage that it is not limited to plane parallel
geometries.
The AD method departs from the radiative
transfer equation (RTE), representing the light
propagation through a fluorescent layer, given by
Equation 1.
4.
1
4.
. ( , , ) ( ). ( , , ) . ( , '). ( , ', ). '
( ). ( ). ( ). ( , ', ). ' .
ii i i
M as M s M
N
MM eX X X X
i
L L pL d
w QE L d
π
π
λ µµ λ µ λ
λ µλ λ λ λ
=
∇ =−+ + Ω
+ Ω∆
∫
∑
∫
s rs rs ss rs
rs
(1)
In words, this equation represents the change in
spectral radiance L(r,s,λ
M
) at position r in direction
s. The first term on the right hand side represents the
spectral radiance lost due to absorption and
scattering, the second term is the contribution in the
selected direction s from all other directions s’
integrated over solid angle dΩ’, and the third term is
the contribution at wavelength λ
M
from all excitation
wavelengths, where the excitation wavelength
region is divided into N wavelength intervals with
central wavelength λ
Xi
.
In Equation 1, µ
a
and µ
s
are the absorption and
scattering coefficient and define the average distance
travelled by a photon before being absorbed and
scattered respectively. The phase function p(s,s’)
gives the probability a photon will be scattered in a
certain direction. If the scattering occurs
isotropically, p(s,s’) is a constant. A commonly used
phase function is the Henyey-Greenstein phase
function, which has one free parameter: the
anisotropy factor g, which is identical to the average
of the cosine of the scatter angle (Henyey &
Greenstein, 1941).
The factor w
M
(λ
M
) is the weight of the selected
wavelength within the emission spectrum, QE is the
quantum efficiency of the fluorescent material,
µ
e
(λ
Xi
) is the excitation coefficient. If the selected
wavelength λ
M
is not included in the spectral
emission band of the material, the third term on the
right hand side of Equation 1 disappears (w
M
(λ
M
) is
zero) and the RTE for non-fluorescent materials is
obtained (Leyre et al, 2012).
In the AD method, the incident radiance on a
material is divided into cones or channels, which can
be mathematically represented as a vector, where
each element in the vector represents the radiance
within a channel. The reflection and transmission
characteristics are represented in matrices, allowing
the radiance to be distributed over the different
channels.
Equation 2 gives the mathematical representation
of the transmission of the spectral radiance through a
slab (Wiscombe, 1969).
11 0111 011 01
1 01 1 01 0
() (, ) (, ) ()
.
() (,) (, ) ()
n
n n nn n
LT T L
LT T L
θ θθ θθ θ
θ θθ θθ θ
=
(2)
With L
0
being the incident spectral radiance and
L
1
the transmitted spectral radiance. The radiance is
divided into n channels (represented by the
corresponding polar angle θ). The matrix elements
T
xy
(θ
a
,θ
b
) represent the light propagation from
spectral radiance at position x, channel a to spectral
radiance at position y, channel b. Equation 2 can also
be written as L
1
=T
01
.L
0
, with L
0
and L
1
being the
spectral radiance vectors and T
01
the transmission
matrix.
When dealing with fluorescent layers, the
radiance is not only redistributed angularly, but also
spectrally. The spectral radiance at wavelengths
included in the spectral emission band, has
contributions from all spectral radiances included in
the spectral excitation band. Leyre et al (2012) used
‘conversion matrices’ to handle the spectral
redistribution of the spectral radiance
(mathematically represented in Equation 3).
01
1 01 0 0
1
( ) .( ) ( , ).( )
ii
N
c
M M XM X
i
λ λ λλ λ
=
= +
∑
L TL T L
(3)
In Equation 3, L
0
(λ
M
) and L
1
(λ
M
) are the
incident and transmitted spectral radiance at
emission wavelength λ
M
respectively, L
0
(λ
Xi
) is the
incident spectral radiance at excitation wavelength
λ
Xi
and T
c
01
(λ
Xi
, λ
M
)
is the conversion matrix,
representing the fluorescent contribution at
wavelength λ
M
from wavelength λ
Xi
in the forward
direction. Each wavelength within the excitation
wavelength region will contribute to the emission at
wavelength λ
M
, this is represented by the summation
in Equation 3, where the excitation wavelength
region is divided into N wavelength intervals with
central wavelength λ
Xi
.
To calculate the reflection and transmission
through a layer which contains bulk scattering or
fluorescence, the AD method starts from a thin
‘single scatter’ layer. The thickness of the layer is
chosen in such a way that a photon will only interact
a single time with the material. The reflection and
transmission characteristics of this ‘single scatter’
PHOTOPTICS2014-InternationalConferenceonPhotonics,OpticsandLaserTechnology
34

layer are determined with the RTE, given in
Equation 1. Next, the layer is doubled in size, by
adding two identical layers together and calculating
the reflection and transmission. This step is repeated
until the desired thickness is reached. A more
elaborate explanation of the AD method can be
found in (Leyre et al, 2012).
The AD method starts from Equations 4 and 5,
representing the relationship between the upward
and downward spectral radiance at each side of a
single layer.
1 10 1 01 0
10 1 01 0
1
() .() .()
( , ). ( ) ( , ). ( )
i ii i
M MM
N
cc
XM X XM X
i
λ λλ
λλ λ λλ λ
+ −+
−+
=
= +
++
∑
L R L TL
R LT L
(4
)
0 01 0 10 1
01 0 10 1
1
() .() .()
( , ). ( ) ( , ). ( )
i ii i
M MM
N
cc
XM X XM X
i
λ λλ
λλ λ λλ λ
− +−
+−
=
= +
++
∑
L R L TL
R LT L
(5)
Herein, the superscripts ‘+’ and ‘-’ represent the
spectral radiance going down- and upwards
respectively. The subscript ‘0’ and ‘1’ for the
radiances represent the spectral radiance on top and
at the bottom of the layer respectively. For the
reflection and transmission matrices, the first
number of the subscripts denotes the incoming
direction of the redistributed radiance (e.g. R
01
represents the reflection matrices for light incident
on the top of the layer). If the wavelength does not
fall within the emission wavelength region, the third
and fourth term on the right hand side of Equations 4
and 5 will disappear, since the conversion matrices
are null matrices.
The AD method combines Equations 4 and 5 to
obtain the reflection and transmission characteristics
of the doubled layer. It inherently assumes that all
radiances at wavelengths λ
Xi
are not included in the
emission wavelength region, i.e. the conversion
matrices in Equations 4 and 5 are null matrices for
all λ
Xi
(Leyre et al, 2012). The result of this
approach is that fluorescent materials with an
overlap between excitation and emission wavelength
region, where re-absorption (and re-emission) of
converted photons can occur, cannot be adequately
treated.
To solve this problem, we propose to write the
spectral radiance in vector form for the full spectrum
instead of one vector for each wavelength. As a
result, the reflection and transmission matrices will
allow the conversion of wavelength (both up- and
down-conversion) without the need for special
conversion matrices. Equation 6 now replaces the
equations for each individual wavelength given by
Equation 3.
Equation 6 allows both angular and spectral
redistribution of light with a single matrix. Using the
new vector-matrix notation, the third and fourth term
on the right hand side of Equations 4 and 5 become
obsolete (since the conversion matrices are no longer
required). It is now much easier to obtain the
reflection and transmission characteristics of a
double layer, by combining Equations 4 and 5. The
condition that the excitation wavelengths cannot be
emission wavelengths as well, is no longer relevant.
This allows to obtain the reflection and transmission
characteristics of two combined layers which have a
spectral overlap between excitation and emission
wavelength region. Equations 4 and 5 (without the
third and fourth term on the right hand side) can be
written for two separate second layers. Combining
the equations for the two layers leads to the
reflection and transmission matrices for the
combined layer, given by Equations 7 and 8.
1
20 21 12 10 12 10 21
()
−
=+−R R T E RR RT
(7)
1
02 12 10 12 01
()
−
= −T T E RR T
(8)
Herein, E is the unity matrix. To obtain the
transmittance and reflectance of a layer, the incident
radiance vector (L
0
) in Eq. 6 must be given the
value ‘1’ for the correct angles and wavelengths.
The transmitted radiance vector (L
1
) can be
calculated using Eq. 6. The transmittance at each
wavelength can be calculated by integration over the
different angles of the radiance represented in the
transmitted radiance vector. In a similar way the
reflectance can be obtained.
3 COMPARISON BETWEEN THE
AD METHOD AND MONTE
CARLO SIMULATIONS
To validate the method described in section 2, the
results of the AD method are compared with
traditional Monte Carlo ray tracing simulations. For
ModellingFluorescentMaterialswithaSpectralOverlapbetweenExcitationandEmissionSpectrum
35
111 011111 011 1 1 011 11 011 1
11 01111 0111 01 1 011
11
1
(, ) (, ,, ) (, , , ) (, ,, ) (, , , )
(,) (,,,) (,,,) (,,, ) (,, , )
(, )
(, )
n N nN
n n nn n N nnN
N
nN
LT T T T
LT T T T
L
L
θλ θλθλ θλθλ θλθλ θλθ λ
θλ θλθλ θλθλ θλθλ θλθλ
θλ
θλ
=
011
01
01 1 1 1 01 1 1 01 1 1 01 1 0 1
01 1 1 01 1 01 1 01 0
(, )
(,)
.
(, ,, ) (, , , ) (, ,, ) (, , , ) (, )
(, ,,) (, ,,) (, ,, ) (, , , ) (,
n
N Nn N N NnN N
nN nNn nN N nNnN n
L
L
T T T TL
T T T TL
θλ
θλ
θλ θλ θλ θ λ θλ θλ θλ θλ θλ
θλθλ θλθλ θλθλ θλθλ θ
)
N
λ
(6)
the calculations and simulations, a plastic remote
phosphor converter is modelled. The converter has
optical flat surfaces (only Fresnel reflections at the
air-converter interfaces), has refractive index of 1.5,
thickness of 1 mm, and contains YAG:Ce phosphor
particles. The phosphor particles cause scattering
and fluorescence, the optical properties are taken
from (Liu et al, 2010).
At a concentration of 0.2 g/cm³, the average
scattering coefficient µ
s
over the visible wavelength
range is 25.71 mm
-1
, and the average anisotropy
factor g is 0.863. For the modelling the Henyey-
Greenstein phase function is selected, since this
allows for easy implementation in the AD method
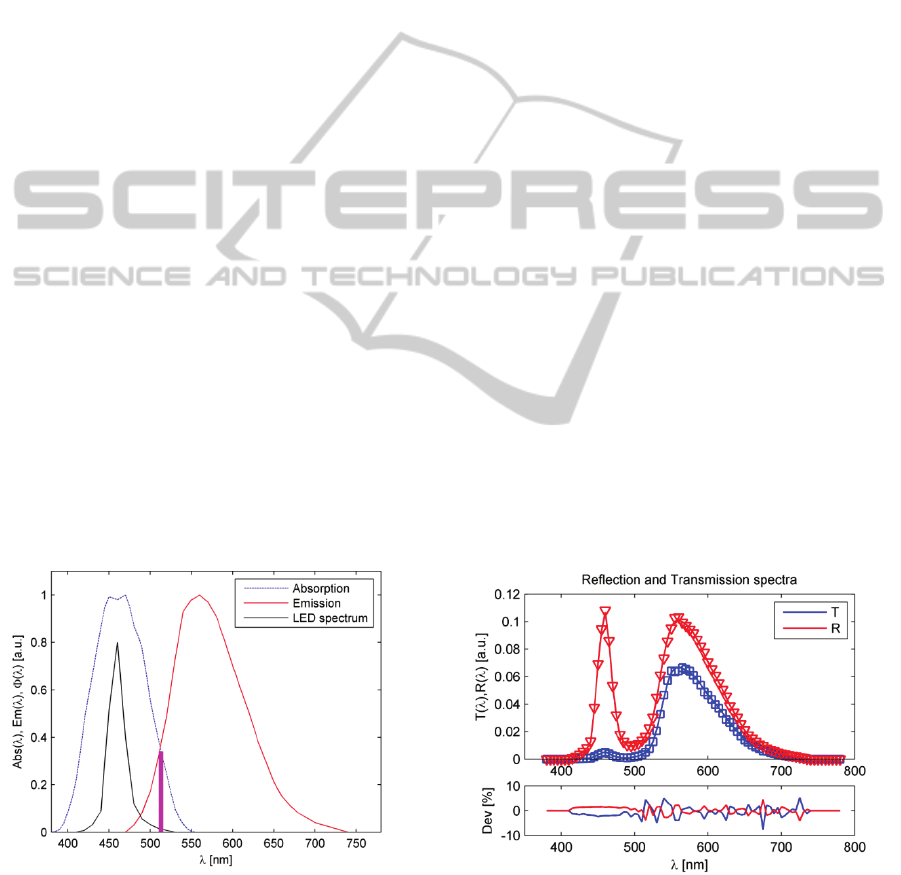
(Joseph & Wiscombe, 1976). The absorption and
emission spectrum of the phosphor are shown in
Figure 1. An obvious spectral overlap between
excitation and emission spectrum can be noticed,
which makes this phosphor an excellent candidate to
validate the proposed AD method.
The peak absorption at 470 nm at concentration
0.2 g/cm³ is 1.79 mm-1. The QE of the phosphor is
0.87. The phosphor converter is illuminated with a
blue LED, with peak wavelength 460 nm. The
spectral radiant flux of the LED is represented in
Figure 1.
Figure 1: Absorption (blue dashed line) and emission
spectrum (full red line) of the YAG:Ce phosphor, together
with the spectral radiant flux of the blue LED (full black
line). The thick vertical line represents the cut-off for
excitation and emission spectrum if the spectral overlap is
not taken into account.
The Monte Carlo simulations are performed with
the software package TracePro. In this software,
Fresnel reflections are handled by attributing a
probability to each ray to be reflected or transmitted
at an interface according to the Fresnel reflection
and transmission coefficients. The volume scattering
is handled by use of the scattering coefficient and
the anisotropy factor, which can be introduced in the
program for each wavelength. The fluorescence is
handled by tracing the source from short to long
wavelengths. The rays absorbed in the fluorescent
material are stored to the hard disk. When an
emission wavelength is reached, the absorbed rays
are converted to the emission wavelength and given
the appropriate radiant flux. This approach differs
from the standard ray tracing procedure for
fluorescence in the TracePro software and allows for
the simulation of fluorescent materials with a
spectral overlap.
The simulations and calculations are performed
between 380 and 780 nm and in steps of 5 nm, the
concentration of phosphor in the converter is
0.2 g/cm³. The Monte Carlo simulation is performed
with 100 000 rays per wavelength. In Figure 2, the
result of the Monte Carlo simulation and the AD
calculations is shown, together with the relative
deviation between the two methods.
Figure 2: Comparison between the AD method (lines) and
Monte Carlo simulations (marks) for the transmitted
spectrum T (triangles) and the reflected spectrum R
(squares), together with the relative deviation (dev)
between the two methods.
PHOTOPTICS2014-InternationalConferenceonPhotonics,OpticsandLaserTechnology
36
From Figure 2, it can be seen that there is only a
very small deviation between the AD calculations
and the Monte Carlo simulations. The average
relative deviation is smaller than 0.5%. Moreover,
given the random variation of the deviation over the
wavelengths, it can be attributed to noise in the
Monte Carlo simulations. It can be concluded that
the AD method can indeed be used to calculate
reflection and transmission of a fluorescent
component with a spectral overlap between
excitation and emission spectrum. The AD method
takes approximately 90 seconds for the full
calculations, the Monte Carlo simulations takes
approximately 15 hours. The AD method thus
decreases the computation time with a factor 600
(for Monte Carlo simulations with 100.000 rays per
wavelength).
4 SIMULATION OF A REMOTE
PHOSPHOR APPLICATION
In the previous section, it was shown that the AD
method can be used for the quick calculation of the
transmitted spectrum through a remote phosphor
converter. Now, the influence of the spectral overlap
of the excitation and emission spectrum on the
colour characteristics of the remote phosphor device
will be investigated by comparing the CIE 1931 x,y
chromaticity coordinates of the transmitted spectrum
with and without the spectral overlap taken into
account. When the spectral overlap is not taken into
account, the excitation and emission spectrum are
cut off at 510 nm (shown in Figure 1). The
concentration of phosphor in the remote phosphor
converter is varied, to show the influence of the
concentration on the difference with and without
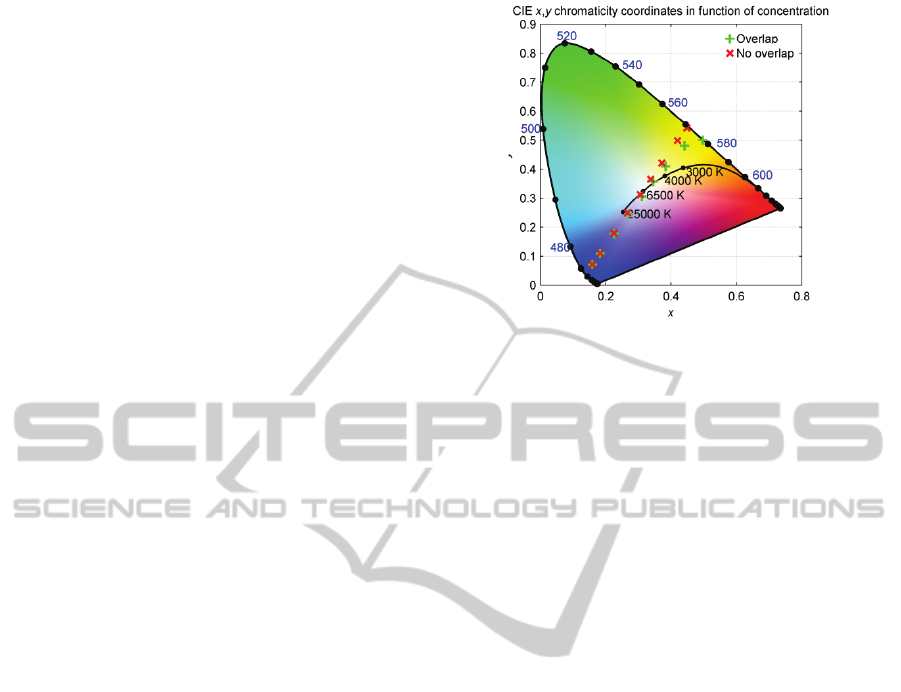
spectral overlap taken into account. In Figure 3, the
chromaticity coordinates are represented in the CIE
1931 x,y chromaticity diagram, for a concentration
of 0.01, 0.02, 0.035, 0.05, 0.065, 0.08, 0.1, 0.15,
0.4 g/cm³ YAG:Ce in the remote phosphor
converter.
Figure 3: CIE 1931 x,y chromaticity coordinates of the
simulated transmitted spectrum for different
concentrations of YAG:Ce in the remote phosphor
converter, with (+) and without (x) the spectral overlap
between excitation and emission spectrum taken into
account.
From Figure 3, an obvious deviation in
chromaticity coordinates is noticeable, especially at
high concentrations of the phosphor. When the
spectral overlap is not taken into account, the
chromaticity coordinates for various concentrations
of phosphor are on a straight line. In this case, the
‘blue’ (from the LED) and ‘yellow’ (from the
phosphor) part of the spectrum have a fixed spectral
distribution, only the ratio of the ‘blue’ and ‘yellow’
part changes. When the spectral overlap is taken into
account, the ‘yellow’ part of the spectrum is not
constant, since re-absorption effects will red-shift
the ‘yellow’ part. At low concentrations, the red-
shift effect is less pronounced, since the probability
of re-absorption events to occur is much lower at
lower concentrations.
At a concentration of 0.08 g/cm³, the
chromaticity coordinates for the simulated spectrum
with the spectral overlap taken into account are
closest to the Planckian locus. The Correlated
Colour Temperature (CCT) is 5007 K. For the same
concentration, the simulated spectrum without the
spectral overlap taken into account results in a CCT
of 5313 K. The distance between the two simulated
colours is larger than a nine-step Mac Adam ellipse
(MacAdam, 1942). According to the recent
regulations of the European Commission regarding
LED lamps, the colour consistency of light sources
should be within a six-step Mac Adam ellipse
(European Commission, 2012). The correct
simulation of the spectral overlap between excitation
and emission spectrum of the phosphors used in
LED lamps is thus important to determine the colour
ModellingFluorescentMaterialswithaSpectralOverlapbetweenExcitationandEmissionSpectrum
37

characteristics of the light source with sufficient
accuracy.
The difference in luminous flux of the simulated
source with and without spectral overlap taken into
account is smaller than 3%, the effect on the colour
characteristics is thus the dominant problem when
ignoring the spectral overlap.
5 CONCLUSIONS
In the paper, the adding-doubling (AD) method was
adapted to allow the calculation of reflection and
transmission characteristics of plane parallel
fluorescent layers with a spectral overlap between
excitation and emission spectrum. The proposed
method was validated with traditional Monte Carlo
ray tracing simulations, the deviation between the
two methods was smaller than 0.5%. The
computation time with the AD method was
approximately 90 seconds, while the Monte Carlo
simulations took 15 hours.
The AD method was used to calculate the
transmitted spectrum through a remote phosphor
converter containing YAG:Ce illuminated with a
blue LED. It was shown that it is important to take
the spectral overlap between excitation and emission
spectrum into account to predict the colour
characteristics of the remote phosphor application.
In the future, experiments on a plane parallel
remote phosphor converter will be performed to
verify the conclusions in this work. The presented
method will also be adapted to perform colour
calculations under different illumination geometries
(e.g. an LED with a lambertian intensity
distribution).
ACKNOWLEDGEMENTS
The authors would like to thank the SIM (Flemish
Strategic Initiative for Materials) and IWT (Flemish
agency for Innovation by Science and Technology)
for their financial support through the SoPPoM
project within the SIBO program.
REFERENCES
Dhami, S., de Mello, A. J., Rumbles, G., Bishop, S. M.,
Phillips, D., Beeby, A. (1995). Phthalocyanine
fluorescence at high concentration: dimers or
reabsorption effect? Photochem. Photobiol. 61 (4),
341-346.
European Commission (2012). Commission Regulation
(EU) No 1194/2012 of 12 December 2012
implementing Directive 2009/125/EC of the European
Parliament and of the Council with regard to
ecodesign requirements for directional lamps, light
emitting diode lamps and related equipment. Brussels,
Official Journal of the European Union.
Hansen, J. E. (1969). Radiative transfer by doubling very
thin layers. Astrophys. J. 155, 563-573.
Henyey, L. G., Greenstein, J. L. (1941). Diffuse radiation
in the galaxy. Astrophys. J. 93, 70-83.
Joseph, J. H., Wiscombe, W. J. (1976). The Delta-
Eddington Approximation for Radiative Flux Transfer.
J. Atmos. Sci. 33, 2452-2459.
Lee K. H., Lee, S. W. R. (2006). Process development for
yellow phosphor coating on blue light-emitting diodes
(LEDs) for white light illumination. 8
th
Electronics
Packaging Technology Conference, Singapore, 6-8
December.
Leyre, S., Durinck, G., Van Giel, B., Saeys, W., Hofkens,
J., Deconinck, G., Hanselaer, P. (2012). Extended
adding-doubling method for fluorescent applications.
Opt. Express 20 (16), 17856-17872.
Liu, Z., Liu, S., Wang, K., Luo, X. (2010). Measurement
and numerical studies of optical properties of YAG:Ce
phosphor for white light-emitting diode packaging.
Appl. Opt. 49 (2), 247-257.
MacAdam, D. L. (1942). Visual Sensitivities to Color
Differences in Daylight. J. Opt. Soc. Am. A 32 (5),
247-274.
Prahl, S. A., van Gemert, M. J. C., Welch, A. J. (1993).
Determining the optical properties of turbid media by
using the adding-doubling method. Appl. Opt. 32 (4),
559–568.
Saeys, W., Velazco-Roa, M. A., Thennadil, S. N., Ramon,
H., Nicolaï, B. M. (2008). Optical properties of apple
skin and flesh in the wavelength range from 350 to
2200 nm. Appl. Opt. 47 (7), 908-919.
Stokes, G. G. (1862). On the intensity of the light reflected
from or transmitted through a pile of plates. Proc. Roy.
Soc. London 11, 545–556.
Wiscombe, W. J. (1976). On initialization, error and flux
conservation in the doubling method. J. Quant.
Spectrosc. Radiat. Transfer 16, 637–658.
PHOTOPTICS2014-InternationalConferenceonPhotonics,OpticsandLaserTechnology
38
