
Web-based Support for Population-based Medical Research
Presenting the QuON Survey System
F. A. Henskens
1,2
, D. J. Paul
1,2
, M. Wallis
1
, J. Bryant
2
, M. Carey
2
, E. Fradgley
2
, C. E. Koller
1,2
,
C. L. Paul
2
, R. W. Sanson-Fisher
2
and A. Zucca
2
1
Distributed Computing Research Group, University of Newcastle, NSW 2308, Callaghan, Australia
2
Health Behaviour Research Group, University of Newcastle, NSW 2308, Callaghan, Australia
Keywords: Survey Software, Web-based Surveys, Public Health, Health Research Support, eHealth.
Abstract: This paper discusses the needs of medical researchers working in the area of patient-centred medicine, in
particular their use of survey data in measuring patient opinions, needs, perceived quality of care received,
and priorities of health service interventions. Until quite recently, collection of survey data has been either
paper-based, or achieved using computer software that largely duplicated paper-based processes with
limited additional functionality. The authors investigate the use of web-based technology to support
collection of such data from patients, including experiences and observations on enhanced/additional
functionality made possible by its adoption. A novel software design termed QuON is presented, together
with examples of its capabilities and uses in current research projects.
1 INTRODUCTION
Public health research broadly focuses on measuring
health behaviours and evaluating the effectiveness of
innovations designed to improve the health of
groups of people. The scope of public health is
broad, covering for example: infectious diseases;
vaccination programs; lifestyle risk factors such as
tobacco smoking, diet, physical inactivity and
weight; and participation in cancer screening
programs. Detection and treatment of mental
illnesses such as depression and anxiety also falls
within this remit.
In 2001, the Institute of Medicine’s report
‘Crossing the Quality Chasm’ nominated patient
centredness as one of six domains of quality care
(Institute of Medicine, 2001). The inclusion of
patient-centred care in this seminal report signalled a
shift from traditionally physician-centred models of
care to patient-centred models that are structured
around patients’ physical, social and emotional
preferences, values, and experiences. This led to
changes, not only in the delivery of health care, but
also in the approach used in research. Patient centred
care emphasises the involvement of patients as
partners in their healthcare. Directly assessing
patient perspectives about whether healthcare meets
their needs using patient-reported surveys is
therefore considered best practice. Data collected via
survey can be used for a number of purposes,
including to: identify patient needs; measure
changes in patient outcomes; provide feedback to
healthcare systems about performance (e.g. as part
of quality assurance activities); and guide clinical
decision making.
Patient-centred health research often requires the
use of survey-based assessments to gather data on
health and health behaviours (McDowell, 2009). In
order to accurately capture a representative sample
of patients’ perspectives without expending
considerable resources, data collection must be
efficient with high levels of participant acceptability.
The production of high quality data requires that
sources of bias be limited by achieving high
response rates, minimising recall bias, obtaining
reliable and valid responses (which may involve
psychometric testing) and involving stakeholders in
development processes (von Elm et al., 2007). A key
element of both a patient-centred approach and
maximising research rigor is the minimisation of
participant burden in a manner that reduces
participant time (e.g. via flexibility and participant
tailoring), increases participant ease of use
(flexibility of format) and minimises the literacy
level required of participants.
To meet these requirements, a multidisciplinary
196
A. Henskens F., J. Paul D., Wallis M., Bryant J., Carey M., Fradgley E., E. Koller C., L. Paul C., W. Sanson-Fisher R. and Zucca A..
Web-based Support for Population-based Medical Research - Presenting the QuON Survey System.
DOI: 10.5220/0004738301960204
In Proceedings of the International Conference on Health Informatics (HEALTHINF-2014), pages 196-204
ISBN: 978-989-758-010-9
Copyright
c
2014 SCITEPRESS (Science and Technology Publications, Lda.)

collaboration between health behavioural scientists
and information technology experts was formed.
This collaboration has produced a web-based survey
package entitled QuON (Paul et al., 2013), which
includes specific features designed to achieve high
levels of participant acceptability.
2 SURVEYS AS A RESEARCH
TOOL
Survey-based measures need to be capable of
providing an accurate assessment of the behaviour or
health state of interest (McDowell, 2009). Measures
also need to be reliable, so that results are
reproducible. There are several factors that influence
measurement accuracy and reproducibility, which
need to be taken into account at the survey design
phase. These include the ease with which the
questions can be understood, and the acceptability
and relevance of the questions (Dillman et al., 2008).
The authors’ own experiences and comprehensive
discussions revealed a raft of qualities required of a
‘good’ patient survey. It is valid, reliable,
psychometrically robust, acceptable, easy to score,
and easy to analyse (Clinton-McHarg et al., 2010).
To improve patient acceptability, surveys should
be designed to be visually pleasing, interactive, and
contain highly relevant item content. Electronic data
collection strategies have a number of advantages
over pen-and-paper modes of survey administration,
as described below.
2.1 Tailoring to Improve Relevance
Paper and pencil surveys require respondents to
follow (sometimes complex) instructions in order to
ensure that only questions relevant to their
circumstance are answered. For example,
respondents may be asked to report on the amount of
physical activity they did in the past week. Those
who indicate that they did not engage in physical
activity may be asked to skip a set of questions
related to activity type.
Instructions of this type introduce a risk that
respondents will misread or misinterpret
instructions, potentially causing confusion for the
respondent, and compromising data quality. In
contrast, electronic surveys can be customised for
each participant. For example, questions can be
alternately skipped or presented depending on a
respondent’s answers to any previous question, not
just the response immediately prior. This not only
minimises respondent burden in reading irrelevant
questions, but also results in better data quality
through reduction in respondent error.
2.2 Immediate Feedback
The survey customisation features mentioned above
can also be used to create immediate feedback for a
patient and/or service provider, based on their
answers. Tailoring of information to individual
needs and preferences improves relevance and recall
of health information (McPherson et al., 2001).
Answers can be inserted into a feedback
template and recommendations can be added, based
on the answers given. A number of strategies to
enhance recall and understanding of information can
be incorporated into feedback to patients or
clinicians. These include explicit categorisation of
information (Girgis and Sanson-Fisher, 1998,
NHMRC, 2004), repetition of important units of
information (Ley et al., 1973), and the use of plain
language (Fallowfield and Jenkins, 2004).
The ability to provide immediate and tailored
feedback from survey output opens up opportunities
for survey data to become part of health care
delivery. Surveys completed before the appointment
with a clinician allow for a more focused
consultation, with potential issues flagged and
automatically documented. This streamlining
enhances the overall provision of service. Data
provided to the participant can form part of a health
intervention. Large data sets aggregated for health
services provide the opportunity to monitor patient-
level perceptions and experiences, which are central
to the provision of quality care.
For optimal data analysis, survey results should
be available to the researcher in a timely manner.
Outputs appropriate for use in popular statistical
analysis packages such as STATA (Stata
Corporation, 2013) or SAS (SAS Institute, 2013)
give immediate access to group data.
2.3 Improved Comprehension
Electronic surveys may incorporate customised
modes of presentation to enhance survey
comprehension. For example, larger fonts or audio
recordings of questions can be used to assist vision-
impaired persons; the language of the survey text
can be customised (e.g. from English to
Vietnamese); and pop-up boxes can be used to
explain difficult terms without interrupting the flow
of the survey.
Graphics and interactive features may also be,
Web-basedSupportforPopulation-basedMedicalResearch-PresentingtheQuONSurveySystem
197

useful particularly for conveying complex
information or additional material for groups with
lower levels of literacy (Murphy et al., 2000).
2.4 Improved Data Quality
The quality of data collected using paper-and-pencil
surveys can be compromised due to missing data
and errors in responses. These quality issues can be
largely overcome through use of electronic surveys.
Respondent errors can be minimised by
programming features that notify respondents if they
have provided an answer outside an expected range,
and prompts them to re-enter their answer (e.g.
postcodes, duration of illness, age). Similar features
can be used to prompt for completion of missed
items, thus reducing the amount of missing data
(Boneveski et al., 1999).
Electronic surveys preclude the need for manual
data entry (either item by item, or by scanning pages
into a data reader), thus eliminating a time-
consuming process and minimising data errors.
Automatic summaries of survey data can be
produced quickly and easily, and the ability to
export data from the survey system to statistical
programs allows complex statistical analysis to be
undertaken.
Paper and pencil survey responses need to be
manually logged into a database or spreadsheet to
keep track of completion rates, and to determine
whether reminder letters need to be sent to non-
responders. Completion of electronic surveys,
however, can be monitored electronically so that
reminder emails, SMS, or prompts for researchers to
make reminder phone calls can be sent
automatically. This is a labour efficient feature,
which assists in maximising completeness of data.
3 THE QuON SURVEY SYSTEM
The QuON survey software system was jointly
developed by the Distributed Computing Research
Group (DCRG), and the Health Behaviour Research
Group (HBRG), at the University of Newcastle,
Australia, and initially funded by the Australian
Government Department of Innovation, Industry,
Science and Research. The HBRG had previously
used PC-based systems such as Digivey (CREOSO
Corporation, 2013), and web-based systems such as
Survey Monkey (Survey Monkey, 2013), and while
useful, had found these systems to be increasingly
restrictive. The joint development of QuON grew
out of a need to facilitate data discovery in ANDS
(Australian National Data Service, 2013), and a
realisation that the growing sophistication of HBRG
research required access to a richer set of survey
question types and software functionality.
QuON enables researchers to build complex and
personalised survey questions by providing a large
tool box of item types and branching patterns. It also
allows innovative question types, such as interactive
point allocation exercises, that would be too
burdensome to complete using a traditional pen and
paper survey. Examples of the powerful features of
QuON are described in Table 1. These are a
combination of successful design features from other
survey systems and powerful customised new
additions developed by the QuON team.
Table 1: Features of the QuON Survey Software System.
Feature Description Benefit
Tailoring to improve survey relevance to end users and to minimise respondent burden
Complex branching
capabilities
Allows questions to be included or exclude
d
based on either raw answers, or calculations (e.g.
b
ody mass index (BMI)) based on answers t
o
ANY previous questions, not just the answer t
o
the question immediately preceding the branch.
This is illustrated in Figure 1.
Allows creation of surveys that are high
l
relevant for participants, reducing participa
n
b
urden and survey completion time. This
especially important if data are being collected
i
healthcare settings where patients might be call
e
into their consultation at any time and need mo
r
than one session to complete the survey.
Question
composition features
Allows dynamic surveys to be modelled based
on participants’ responses on three levels:
o The number of questions received by an
individual based on previous answers;
o Building the question stem containing
content from previous answers,
o The possible response options available for
selection.
Increases sophistication of survey items and
improves comprehension of survey items for
patients
HEALTHINF2014-InternationalConferenceonHealthInformatics
198

Table 1: Features of the QuON Survey Software System (cont.).
Immediate and tailored feedback of data
Real-time feedback
Generation of on-the-spot printed or screen-
based feedback to patients based on survey
answers
Allows data to be used not only for research
purposes and to provide feedback to the
healthcare system about performance, but for
tailored feedback of health information to
patients with the potential to directly affect
patient health outcomes.
Prioritisation
Allocation of points to prioritise desired changes
(rather than simple ranking exercises)
Provides information and specificity about the
relative weight of desired changes, not just a
rank order.
Design factors that effect survey comprehension
Specification of
what is displayed
on each screen
The ability to have more than one question on a
screen
Reduces the time that it takes to load new pages
for each item (Couper et al., 2001), and makes
the survey more user friendly for participants.
This feature is not exclusive to QuON; (e.g. it is
also included in Survey Monkey), but QuON
allows greater levels of customisation).
Graphics
The capability to insert still or moving picture
content to the text on survey screens
Improves comprehension and the overall appeal
of the survey. Also allows creation of screens
that are used exclusively for provision of
content, without an accompanying question
Definition of
permissible
responses
Allows the researcher to specify limits on the
number of digits entered (e.g. limiting postcode
to four digits and numbers between 1,000 and
8,000), and prompts that allow participants to re-
enter their answer. Also allows specification of
answer type, e.g. number vs. text.
Enhances data quality assurance (Dillman et al.,
2008).
Calendar functions
and auto pop-up
number pads
For answers that require a numerical response a
number pad, or calendar, appears on the screen.
Reduces the amount of “free-style” typing
required by participants, thereby increasing user
friendliness and improving data quality
Multiple survey
completion.
Participation in identified and authenticated
surveys can be set to ‘once only’ or ‘multiple
permitted’,
The ability, for example, for a patient and their
family/carer to provide linked input or to track a
change over time.
Privacy and confidentiality
Flexible survey
design to facilitate
anonymity and/or
confidentiality
The confidentiality of surveys can be specified
so results can be anonymous; linked to
individual participants; or linked to groups of
related participants.
Ethical and analytical benefits.
Study specific
participant lists
The researcher has the option of adding
participant details into the secure QuON server.
Participant lists (identified and authenticated)
are study specific and only visible to individual
researchers from that study.
Ethical and pragmatic reasons.
Restricted access
Access to survey results is restricted so that only
the ‘owner’ of a survey is permitted to access
them.
For ethical reasons.
Improving usability for researchers
Survey item re-use
The ability to copy items from previously
published surveys into a new survey, and to edit
them for re-use.
Increases ease of use for research groups,
particularly for questions that are routinely used
e.g. gender, date of birth..
Auto-calculate
study ID numbers
The ability to generate study numbers based on
respondents’ answers.
Allows for test-retest or sub-group follow-up.
Timing statistics
QuON can be asked to record timing data such
as time taken to complete the survey, as well as
time spent on each question, and number of
pauses and restarts.
Provides valuable information on patients’
behaviour while taking the survey, for each
item, as well as overall.
Web-basedSupportforPopulation-basedMedicalResearch-PresentingtheQuONSurveySystem
199
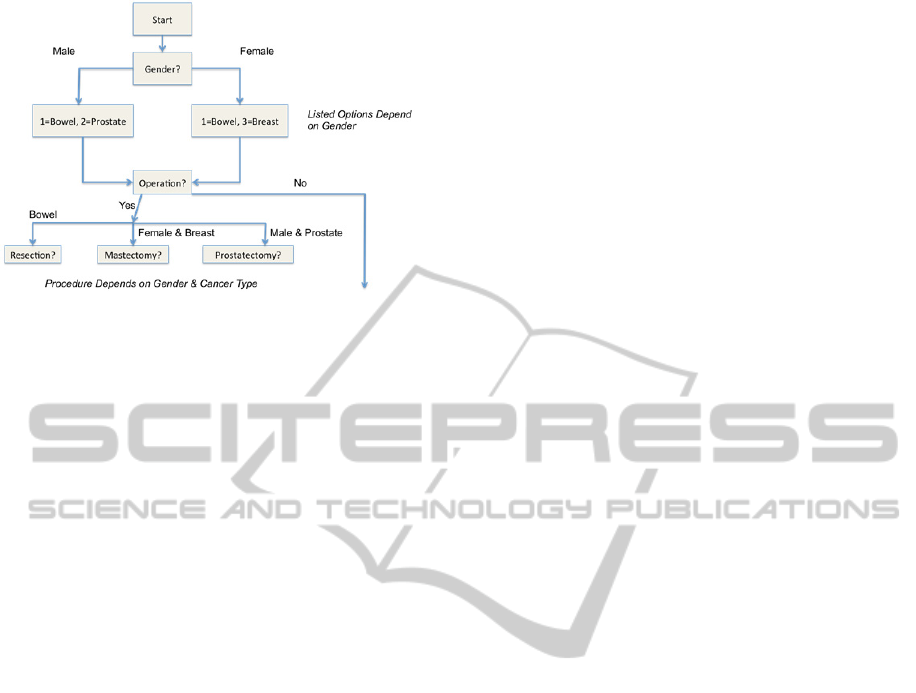
Figure 1: Illustration showing complex branching
capabilities of the QuON survey software.
3.1 Design and Implementation
QuON is a Web application, built using the
CakePHP platform (Cake Software Foundation,
2012), that communicates with a MySQL database
(Oracle, 2012) used to store both survey
definitions and answers collected for each survey.
It uses a typical Model-View-Control (MVC)
approach (Krasner and Pope, 1988) and utilises
Web standards, such as HTML5 and Semantic
markup (W3C, 2013) so that the same survey can
be presented on different devices such as
computers, tablets, and smart phones. The QuON
application executes on a central server;
researchers and participants are clients of the
application, and interact with QuON using a local
web browser.
There are five kinds of QuON users:
Administrators, who set up system-wide
properties, create new users and groups, and
assign users to groups;
Researchers, who define and modify
surveys;
Survey Owners, who are researchers with
the special assigned right to download
result data for a particular survey;
Group Administrators, who are researchers
with the additional permission to perform
administrative tasks only for the group to
which they belong. For example, a group
administrator can add new users to their
group, change owners of surveys, etc.;
Participants, who access and answer the
surveys that have been published and
allocated to them by the researchers.
Participants are specified on a per-survey basis,
and can be either:
Anonymous: participants are not identified
before starting the survey and the results
are stored anonymously;
Identified: participants need to be pre-
registered in the system by the researchers
responsible for the survey, and must
provide their username before they can take
the survey;
Auto-identified: participants are asked to
provide a name (e.g. James0911 – given
name concatenated with day and month of
birth) to identify themselves before taking
the survey, but the username does not need
to be pre-registered by the researcher(s)
responsible for the survey;
Authenticated: participants need to be pre-
registered in the system by the researchers
responsible for the survey, and must
provide their username and password before
they can take the survey.
Each QuON survey comprises an ordered set of
individually defined survey objects. A survey
object can be:
A question, which displays some stimulus
and requests a response from the
participant;
A calculation, which evaluates an
expression that is potentially based on
previous answers. The result is stored but
not displayed by the calculation object, and
can be used later in the survey as part of a
displayed message, or as an input into
branching logic. An example would be the
calculation of Body Mass Index from
answers on height and weight, which will
be used to generate appropriated feedback;
A branch object, which customises the
order in which survey objects appear to
individual participants by ‘jumping’ to a
different location in the survey, based on a
conditional expression typically involving
previous participant responses;
An information object, which displays text,
possibly augmented by still pictures or
video, and does not require a participant’s
answer.
Different question types supported by QuON
include: Informational; Text; Checkbox; Radio
Button; Button Option; Drop Down; Calendar;
Rank Order; Distribution of Points; and Likert
Scale. There is also support for dynamic questions
such as: Dynamic Checkbox; Dynamic Rank
Order; Dynamic Distribution of Points, in which
the presented options are based on a subset of
answers provided to previous questions; and so-
HEALTHINF2014-InternationalConferenceonHealthInformatics
200
called meta questions that allow multiple questions
to be conditionally displayed on the one screen.
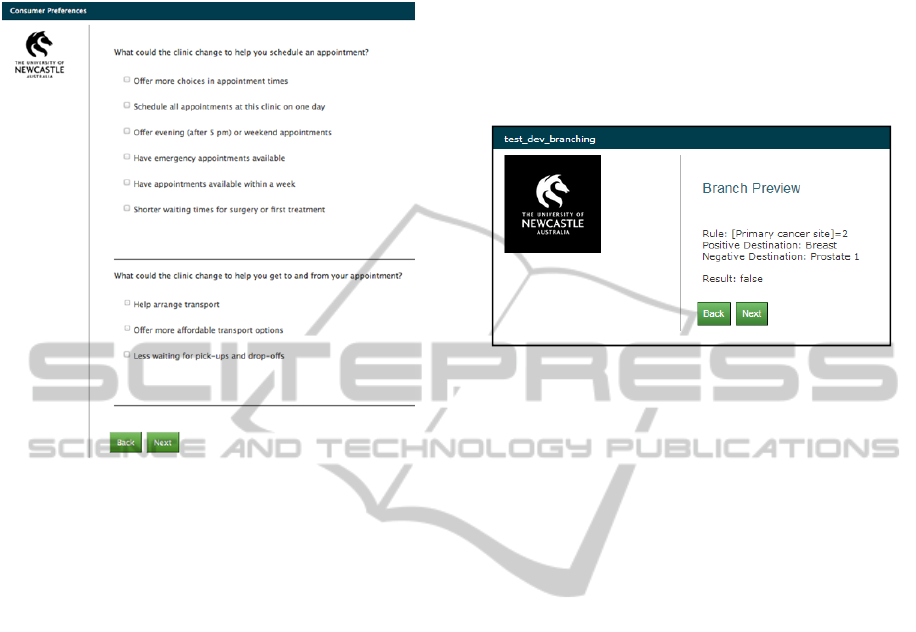
Figure 2: Meta-question and Dynamic Checkbox.
Figure 2 shows a dynamic checkbox question
type combined with a meta question type. This
presents a dynamic set of checkbox answers based
on previous answers, as well as multiple questions
for the user to complete on a single screen.
Further, programmers can easily add new
question types to QuON by creating new CakePHP
Helpers (Cake Software Foundation, 2012). These
define the attributes survey designers (researchers)
are allowed to specify, how the question should be
displayed, how responses should be validated, and
how responses are stored.
Several features embedded in QuON enable the
survey designer to review the construct and check
for errors. Tracking of complex branching is
facilitated in survey preview, when a Branch
Preview will appear at the location where the
branch has been inserted. This displays the rule
and what has been entered for the positive and
negative destinations, as well as the outcome
determined from the previous question:
For example, Figure 3 shows that the primary
cancer site was not 2=breast (Result: false), thus
the program will progress to the negative
destination, in this case the branch which tests if
prostate was selected. Surveys can also be
validated so errors can be easily identified and
remedied.
QuON makes it easy to include customised
Cascading Style Sheets (CSS) to change the
appearance of any question or information survey
object. It is also possible to specify different styles
for mobile and non-mobile devices. Customised
Javascript (Arnold and Gosling, 2000) is also
possible, allowing researchers to implement
custom client-side logic on the participants’
devices while they are taking a survey.
Figure 3: Branch Preview.
3.2 Conducting a Survey
The survey sequence is presented in the order in
which the survey objects are inserted into the
survey. Questions are processed by displaying the
question, and waiting for the participant to provide
a valid response. If an invalid response is entered,
the respondent is presented with an error message,
and asked to enter a new response. Once a valid
response is provided, the system moves to the next
survey object. Calculation objects evaluate an
expression, after inclusion of values from the
respondent’s previous answers, before control
moves to the next survey object. Branches evaluate
their researcher-defined logical condition and, if it
is true, cause a jump to the survey object specified
in the branch’s positive condition; otherwise they
cause a jump to the branch’s negative destination.
A participant may choose to leave the survey early;
if the participant is an identified or authenticated
user, the survey can be re-joined later, at which
time the system presents the participant with the
question they were viewing at the time of leaving
the previous survey session. This functionality
caters for timeouts caused if the participant forgets
or is unable to complete a survey in one setting.
Once a participant has completed a survey,
he/she can be presented with feedback sheets based
on the participant’s responses. The content of
feedback sheets is defined using easily modifiable
templates.
The Owner of a survey is able to view results
and timing data online, or to download the data as
a Comma-Separated-Value (CSV) file at any time.
Web-basedSupportforPopulation-basedMedicalResearch-PresentingtheQuONSurveySystem
201
Thus aggregated survey results are available
immediately, and not delayed by the transcription
or scanning necessary for paper-based surveys.
QuON also allows researchers to provide survey
metadata, in a form suitable for ingestion by
ReDBox (Queensland Cyber Infrastructure
Foundation, 2012) systems, resulting in production
of RIF-CS (Global Registries, 2013) discoverable
entries in the Australian National Data Service
(ANDS, 2013). The adoption of open standards
such as CSV and the RIF-CS formats ensures that
researchers are not locked into any specific system
for result analysis.
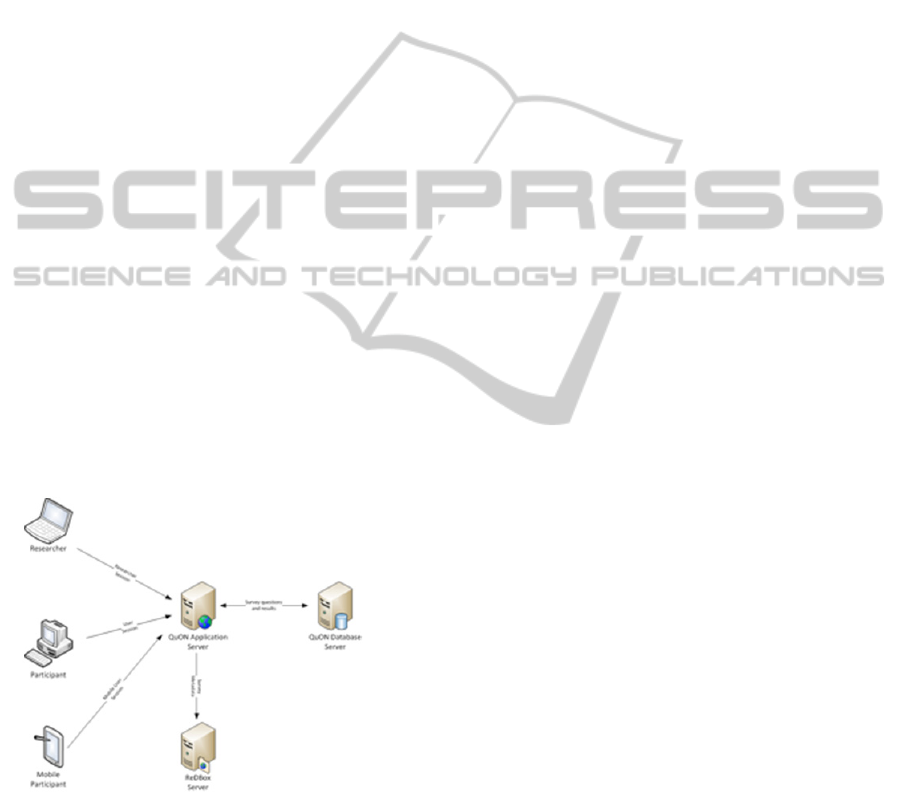
Figure 4 presents a high-level overview of the
standard QuON deployment. Connectivity between
participants and the QuON server will typically be
by Internet, and may be either wired or wireless
(including WiFi and 3G/4G/GPRS). The
deployment options are flexible, with multiple
database servers and web servers being supported
under the CakePHP framework.
During the design of the QuON system a
strong emphasis was placed on open standards and
re-usable components. Open software development
platforms such as PHP, combined with the MIT
license structure ensures that any user of the
system can extend the platform to their specific
needs. This extension may, for example, add a new
Helper that introduces a custom question type, or a
custom ‘branding’ that tailors the survey output for
a specific device or group of users.
Figure 4: High-level overview of a QuON deployment.
3.3 User Documentation
The development of specialised QuON software
features was driven by the requirements of experts
in health behaviour, but implemented by experts in
software engineering and development. This
process required close collaboration between the
scientists and the software developers, and
effective transfer of information between their
respective disciplines.
To ensure that non-experts can put the
capabilities of the developed system to its best use,
it was necessary to prepare detailed documentation
that described the required steps (and rationales) in
a way that can be easily followed. This was
achieved by logical organisation of the user
document and detailed, step-by-step instructions,
which were illustrated by corresponding
screenshots.
Addition of new features such as extra question
types, and other enhancements, required occasion
updates of the user manual. This involved creation
of a new version with the relevant changes made
throughout the document, as well as a short
summary of the changes in the ‘Change History’
section of the last chapter of the user manual.
Features such as defining branch conditions
and the creation of the feedback sheet template
require the use of expressions similar to those used
in programming languages; these proved to be
difficult for the researchers to understand and use.
Syntax information was usually provided in the
form of templates, with placeholders used to
represent the data required by the template. The
correct format for provision of such data was
described, allowing relatively easy transfer of the
syntax used in sample expressions into the specific
context required for each survey situation. Detailed
examples of desired outcome scenarios were
provided which included the syntax used to
achieve that outcome; an explanation of the syntax;
and the output produced. However, despite the
details provided, this aspect of survey design
presents the biggest challenge to the researcher.
4 EVALUATION
A functional and comparative evaluation of the
QuON system conducted by the Health Behaviour
Research Group (HBRG) at the University of
Newcastle. QuON was compared with the two
incumbent survey systems, Survey Monkey and
Digivey. The features presented in Table 1 were
used to produce the comparisons shown in Table 2.
Some evaluation results benefit from extra
explanation, which is provided in the list of caveats
that immediately follows Table 2.
HEALTHINF2014-InternationalConferenceonHealthInformatics
202

Table 2: Comparison of Features.
Feature QuON Di
g
ive
y
Surve
y
Monke
y
Complex branching
capabilities
Yes Partial (1) Yes
Question composition features Yes
N
o
N
o
Real-time feedbac
k
Yes
N
oYes
Prioritisation Yes
N
o
N
o
Specification of what is
displayed on each screen
Yes No Partial (2)
Graphics Yes Yes Yes
Definition of permissible
responses
Yes Yes Yes
Calendar functions and auto
p
op-up number pads
Yes No Yes
Multiple surve
y
completion. Yes Partial (3) Yes
Flexible survey design to
facilitate anonymity and/or
confidentialit
y
Yes Yes Yes
Stud
y
specific participant lists Yes
N
oYes
Restricted access Yes Partial (4) Yes
Surve
y
item re-use Yes
N
o Partial (5)
Auto-calculate study ID
numbers
Yes No No
Timin
g
statistics Yes
N
oYes
The following caveats apply to the above
comparison:
1. Digivey does support complex branching via
its “skip” and “branch” features, though
researchers found the two separate concepts
confusing and hard to work with in
comparison to QuON’s single “branch
object” approach.
2. Survey Monkey does permit definition of
multiple questions to be displayed on a screen
but the selection is static. There is no ability
to dynamically choose the displayed
questions on the basis of previous answers
3. Digivey supports multiple runs of a survey
but support for resuming a half-complete
survey is limited.
4. Digivey stores all survey answers on the local
PC, and unless the researcher chooses the
encryption option these are accessible by any
user of that PC.
5. Survey Monkey permits the export and
import of survey questions but does not
provide the survey or department level re-use
that QuON implements.
5 CONCLUSIONS
Researchers in patient-centred medicine often
gather data on health and health behaviours using
survey-based assessments. Accurate representation
of patients’ perspectives is more readily achieved
when data collection is efficient, and when
participants feel comfortable with the tools used to
elicit their opinions. Collected data is most useful
when it is available in a timely manner, and in a
form suitable for statistical analysis.
This paper presents QuON, a software system
that supports the definition and conduct of web-
based surveys. QuON provides a rich set of
question types, together with the ability to define
surveys that are tailored to the circumstance of
each individual participant. The system design
supports a high level of flexibility in survey and
participant administration, while ensuring
appropriate confidentiality of participant
responses. QuON has been specifically developed
to fill gaps in the existing incumbent offerings to
ensure surveys are as effective as possible a
research tool in the public health domain.
The QuON software architecture allows
programmers to easily add new question types.
Additionally, appropriately skilled researchers can
change the way question or information screens are
displayed, including different configurations for
mobile and non-mobile devices.
QuON continues to evolve to meet its users’
needs. The initial version may be downloaded
Web-basedSupportforPopulation-basedMedicalResearch-PresentingtheQuONSurveySystem
203

from http://code.google.com/p/quon/.
ACKNOWLEDGEMENTS
The work presented in this paper was funded by
grant DC17 from the Australian Government
Department of Innovation, Industry, Science and
Research under the ANDS scheme. Dr. Jamie
Bryant is supported by an Australian Research
Council Post-Doctoral Industry Fellowship.
REFERENCES
ANDS. 2013. Australian National Data Service
[Online]. Available: http://www.ands.org.au
[Accessed September 2013].
Arnold, K. & Gosling, J. 2000. The Java Programming
Language, 3rd ed., Addison Wesley.
Australian National Data Service. 2013. Better Data:
Better Research [Online]. Available:
http://www.ands.org.au/betterdata/index.html
[Accessed September 2013].
Boneveski, B., Sanson-Fisher, R., W., Campbell, E.,
Carruthers, A., Reid, A. L. A. & Ireland, M. 1999.
Randomized controlled trial of a computer strategy
to increase general practitioner preventive care. .
Preventive Medicine, 29(6), 478-486.
Cake Software Foundation 2012. CakePHP Cookbook,
Cake Software Foundation.
Clinton-Mcharg, T., Carey, M., Sanson-Fisher, R.,
Shakeshaft, A. & Rainbird, K. 2010. Measuring the
psychosocial health of adolescent and young adult
(AYA) cancer survivors: a critical review. Health &
Quality of Life Outcomes, 8(25).
Couper, M. P., Traugott, M. W. & Lamias, M. J. 2001.
Web Survey Design and Administration. Public
Opinion Quarterly, 65(2), 230-253.
Creoso Corporation. 2013. Available:
http://www.digivey.com [Accessed September
2013].
Dillman, D. A., Christian, L. M. & Smyth, J. D. 2008.
Internet, Mail, and Mixed-Mode Surveys: The
Tailored Design Method, John Wiley & Sons, Inc.
Fallowfield, L. & Jenkins, V. 2004. Communicating sad,
bad, and difficult news in medicine. . Lancet,
363(9405), 312-19.
Girgis, A. & Sanson-Fisher, R. W. 1998. Breaking bad
news. 1: Current best advice for clinicians.
Behavoural Medicine, 24(2), 53-59.
Global Registries. 2013. The Registry Interchange
Format - Collections and Services (RIF-CS)
[Online]. Available: http://www.globalregistries.org
[Accessed September 2013].
Institute of Medicine 2001. Crossing the quality chasm :
a new health system for the 21st century [Committee
on Quality of Health Care in America], National
Academies Press.
Krasner, G. E. & Pope, S. T. 1988. A cookbook for
using the model-view controller user interface
paradigm in Smalltalk-80. Journal of Object-
Oriented Programming, 1(3), 26-49.
Ley, P., Bradshaw, P. W., Eaves, D. & Walker, C. M.
1973. A method for increasing patients’ recall of
information presented to them. . Psychological
Medicine, 3, 217-20.
Mcdowell, I. 2009. Measuring Health. A guide to rating
scales and questionnaires.
, Oxford University Press.
Mcpherson, C. J., Higginson, I. J. & Hearn, J. 2001.
Effective methods of giving information in cancer: a
systematic literature review of randomized
controlled trials. Journal of Public Health Medicine,
23(3), 227-34.
Murphy, P. W., Chesson, A. L., Walker, L., Arnold, C.
L. & Chesson, L. M. 2000. Comparing the
effectiveness of video and written material for
improving knowledge among sleep disorders clinic
patients with limited literacy skills. Southern
Medical Journal, 93(3), 297-304.
NHMRC 2004. General Guidelines for Medical
Practitioners on Providing Information to Patients.
Oracle 2012. MySQL Reference Manual, Oracle.
Paul, D. J., Wallis, M., Henskens, F. A. & Nolan, K.
QuON - A Generic Platform for the Collation and
Sharing of Web Survey Data. Web Information
Systems and Technologies (WEBIST2013), 2013
Aachen, Germany. 111-116.
Queensland Cyber Infrastructure FOUNDATION. 2012.
ReDBox - Mint [Online]. Available: http://
www.redboxresearchdata.com.au [Accessed 11
January 2013].
SAS Institute. 2013. SAS: Business Analytics and
Business Intelligence Software [Online]. Available:
http://www.sas.com [Accessed September 2013].
Stata Corporation. 2013. Stata: Data Analysis and
Statistical Software [Online]. Available:
http://www.stata.com [Accessed September 2013].
Survey Monkey. 2013. Available: http://www
.surveymonkey.com [Accessed September 2013].
Von Elm, E., Altman, D. G., Egger, M., Pocock, S. J.,
Gøtzsche, P. C. & Vandenbroucke, J. P. 2007. The
Strengthening the Reporting of Observational
Studies in Epidemiology (STROBE) statement:
guidelines for reporting observational studies.
Bulletin of the World Health Organisation, 867-872.
W3C. 2013. A vocabulary and associated APIs for
HTML and XHTML - Editor's Draft [Online].
Available: http://www.w3.org/html/wg/drafts/
html/master/ [Accessed November 2013].
HEALTHINF2014-InternationalConferenceonHealthInformatics
204
