
The Rectus Femoris Muscle Fatigue through Mechanomyographic
Time-Frequency Response in Paraplegic Subject
Preliminary Results
Eddy Krueger
1
, Eduardo M. Scheeren
2
, Guilherme N. Nogueira-Neto
2
,
Agnelo Denis Vieira
2
and Percy Nohama
1
1
CPGEI, Universidade Tecnológica Federal do Paraná, Sete de Setembro Ave 3165, Curitiba, PR, Brazil
2
PPGTS, Pontifícia Universidade Católica do Paraná, Imaculada Conceição St 1155, Curitiba, PR, Brazil
Keywords: Mechanomyography, Fatigue, Functional Electrical Stimulation, Spinal Cord Injury, Cauchy Wavelet.
Abstract: The purpose of this study is the evaluation of mechanomyographic (MMG) time-frequency response of
rectus femoris muscle of a paraplegic subject during an isometric electrically-elapsed fatigue protocol. An
accelerometer sensor was used to measure the vibration of muscle during voltage-controlled functional
electrical stimulation application at 1 kHz pulse frequency (20% duty cycle) 70 Hz modulated frequency
(20% duty cycle). A load cell (50 kgf) measured the force signal with the participant seated on a bench with
the hip and knee angle set to 90º. During the protocol the electrical output voltage was adjusted to keep the
force at 30% of maximal stimulated contraction (MSC). When the electrical stimulation was unable to keep
the force above approximately 10% of MSC the protocol was ceased. Ten seconds with unfatigued (initial
period) and fatigued (final period) muscle, MMG signal was processed with Cauchy wavelet transformation
(bandpass 5-100 Hz). For fatigue conditions of paraplegic subject, MMG signal presents concentration
energy to lower frequencies mainly to 11.31 Hz band frequency.
1 INTRODUCTION
Muscular fatigue produces electromechanical
modifications on neuromuscular tissue as the
incapacity to generate force required in contraction
(Cè et al., 2013). Muscular fatigue of people with
complete spinal cord injury (SCI) can be detected by
using force information (Gerrits et al., 1999);
however, to elicit the muscular contraction the main
way is applying the functional electrical stimulation
(FES).
Unfortunately, the stimulating electrical current
produces interference on the acquisition of feedback
signals such as electromyography (Faller et al.,
2009) that registers the bioelectrical signal of
neuromuscular tissue. Alternative way to acquire the
muscular response of paraplegics with complete
lesion is by means of mechanomyography (MMG)
(Nogueira-Neto et al., 2013), which is a technique
based on mechanical oscillations of muscles during
contraction. So, it is immune to electrical
interference yielded during FES application (Seki et
al., 2003).
The goal of the research discussed in this paper is to
verify if there is any frequency band of time-
frequency response that has higher energy in rectus
femoris muscle of a paraplegic subject during an
isometric electrically-elapsed fatigue protocol to
improve the knowledge of muscle physiology.
2 METHODS
2.1 Volunteer
This study was approved by Human Research Ethics
Committee of Pontifícia Universidade Católica do
Paraná (PUCPR) under register 2416/08. The
participant involved in the research was 38 years
old, weight: 88 kg, height: 179 cm and diagnosed
with incomplete spinal cord injury at T3-T4
radicular level acquired twenty years earlier by
gunshot. The left lower limb of the volunteer
underwent a physical evaluation classifying it as
level B (without voluntary contraction) in
accordance with the American Spinal Injury
239
Krueger E., M. Scheeren E., N. Nogueira-Neto G., Denis Vieira A. and Nohama P..
The Rectus Femoris Muscle Fatigue through Mechanomyographic Time-Frequency Response in Paraplegic Subject - Preliminary Results.
DOI: 10.5220/0004804102390243
In Proceedings of the International Conference on Bio-inspired Systems and Signal Processing (BIOSIGNALS-2014), pages 239-243
ISBN: 978-989-758-011-6
Copyright
c
2014 SCITEPRESS (Science and Technology Publications, Lda.)

Association (AIS) impairment scale (from A to E).
In the day of test, the volunteer did not use any drug
that could change his motor condition.
2.2 Electrical Stimulation
The custom electrical stimulator produced
monophasic rectangular wave with amplitude
controlled stimulation pulses. The parameters
configured were pulse frequency: 1 kHz (20% duty
cycle); burst (modulating) frequency: 70 Hz (20%
duty cycle).
2.3 Instrumentation
The MMG system used had a triaxial accelerometer
sensor (Freescale
®
MMA7260Q MEMS with 800
mV/G sensitivity at 1.5 gravitational acceleration -
13x18mm, 0.94 g) and the Z-axis (transverse to the
muscle belly displacement) was used as the signal
process. The electronic circuits allowed 2.2x
amplification. A load cell (50 kgf ≈ 500 N), of S
shape aluminium body, with four strain gages in full
Wheatstone bridge, was used to measure force. After
the skin preparation (trichotomy and cleaning),
MMG sensor was positioned over the belly of rectus
femoris (RF) muscle using double-sided adhesive
tape. The placement was equidistant between the
anterosuperior iliac spine and the top of the patella.
The self-adhesive electrodes with different sizes
were positioned on the thigh over the knee region
(anode with 5 x 9 cm) and over the femoral triangle
(cathode with 5 x 5 cm) to stimulate the quadriceps
muscle via femoral nerve.
2.4 Experimental Protocol
The volunteer was positioned seated on a bench with
the hip and knee angle set to 90º. After the
placement of the FES electrodes on the left limb a
minimum of 10 min rest was respected to skin-
electrode impedance balance (Reilly, 1992). The
MMG sensor was positioned over the rectus femoris
muscle belly. The load cell was attached on the leg
through band strips and a Velcro strap belt was
positioned in trunk for volunteer stabilization. The
instrumentation layout is illustrated in Figure 1.
Firstly, the maximal stimulated contraction
(MSC) force was performed by increasing the
electrical stimulating magnitude (approximately 3
V/s to avoid motoneuron adaptation/habituation)
until the force started to level off. Twenty-minutes
rest interval was respected to avoid interference on
fatigue protocol. The protocol was initiated with 0V
of electrical stimulating, them it was controlled to
keep the force in 30% of MSC (30MSC). When the
electrical stimulating was unable to keep the force
over 30% of 30 MSC (approximately 10% of MSC)
the protocol was ceased (Gerrits et al., 1999).
Figure 1: Experimental set up and instrumentation layout.
2.5 Data Processing and Analysis
The signal process was realized by custom-written
MatLab
®
software version R2008a. Ten seconds
window was chosen at initial instant when the
30MSV was reached (unfatigued muscle). Ten
seconds window was chosen at final instant before
30% of 30MSV force (fatigued muscle). The MMG
signal was processed with a third-order Butterworth
filter with bandpass of 5-100 Hz (spectral range of
muscular vibration). The signal was processed in
eleven bands of Cauchy wavelet (CaW) transform
(von Tscharner, 2000) (2.07, 5.79, 11.31, 18.63,
27.71, 38.54, 51.12, 65.42, 81.45, 99.19 and 118.63
Hz) and the root mean square (analysis window
length: 1s) was computed for each CaW band. Data
were normalized by the first second at the initial
moment to each frequency band in order to show
signal variations.
3 RESULTS
The volunteer did not show any spastic event during
the protocol application. In order to reach the MSC
force (31.5 kgf), the output stimulator voltage was
set to 190 V. The green line in Figure 2 shows the
target force (30% MSC), the blue line indicates the
threshold of 10% MSC and the red line indicates the
BIOSIGNALS2014-InternationalConferenceonBio-inspiredSystemsandSignalProcessing
240
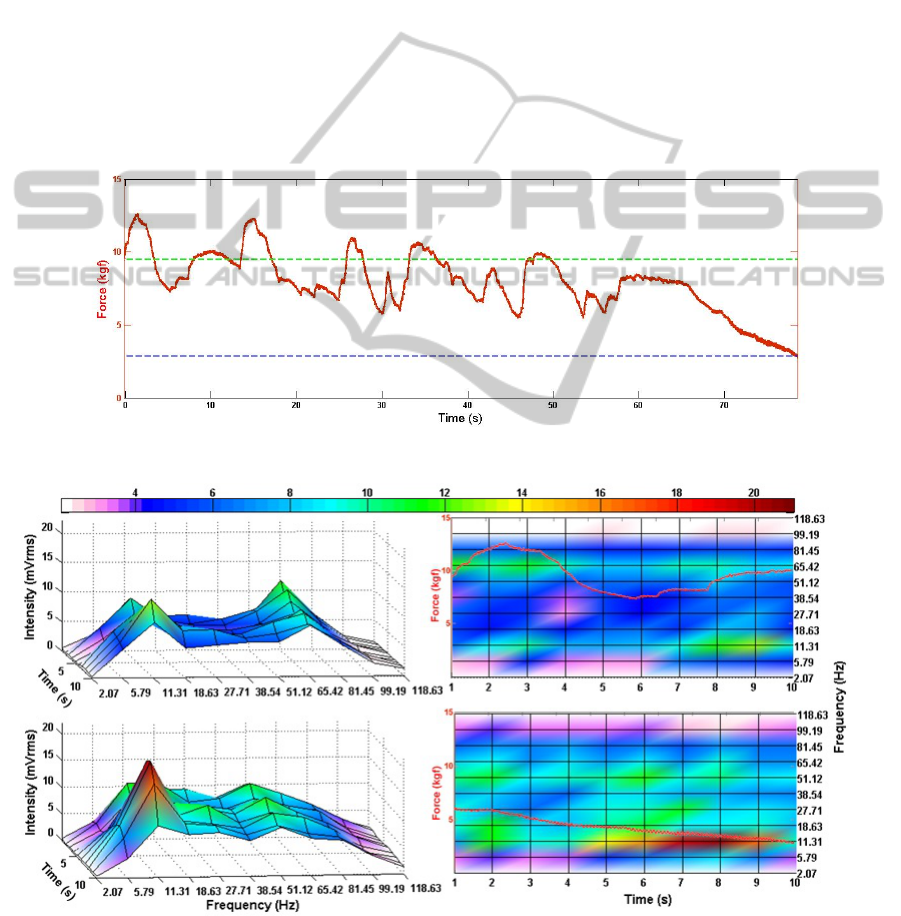
response of the force obtained during the protocol.
After 50 s of applying the electrical stimuli, one may
observe the inability of the muscle to sustain its
strength in the target area even with the increase of
the electrical stimulation.
Figure 3 shows the MMG time-frequency
response: at first stage (first 10 s – A and B) two
frequency bands are prominent, at 11.31 Hz and at
65.42 Hz; the latter one is probably due to myofibers
oscillation in accordance with burst frequency (70
Hz – tetanic frequency). At last stage (last 10 s – C
and D) under fatigue conditions, the frequency band
around 11.31 Hz shows an enhancement in energy
concentration (seen as higher intensity value) near
the final setpoint protocol.
Figure 4 illustrates normalized data. At first stage
(A and B), the lower frequency components show
greater energy content (from 5.79 to 11.31 Hz); at
final stage (C and D), under fatigue conditions, the
same components (from 5.79 to 11.31 Hz) also show
greater energy concentration near the final set point
protocol. The frequency components around 65.42
Hz in normalized data do not show variation along
the protocol, possibly because few myofibers
achieve oscillation in this vibration frequency.
4 DISCUSSION
At initial stage (unfatigued), the frequency
components around 65.42 Hz show content
concentration, as well as the band at 11.31 Hz,
probably due to myofibers oscillation in accordance
Figure 2: Force (red line) during the protocol. Force goal control (green line), inferior force threshold (blue line).
Figure 3: 3D (A and C) and 2D (B and D) MMG time-frequency responses of rectus femoris muscle. A and B: ten initial
seconds of FES-force-controlled application (unfatigued muscle). C and D: ten final seconds of FES-force-controlled
application (fatigued muscle). The color bar shows the maximum value (21 mVrms) in dark red color and the values below
10% of maximum (0.21 mVrms) are in white color. Force: red line in 2D image.
(A)
(B)
(C)
(D)
TheRectusFemorisMuscleFatiguethroughMechanomyographicTime-FrequencyResponseinParaplegicSubject-
PreliminaryResults
241
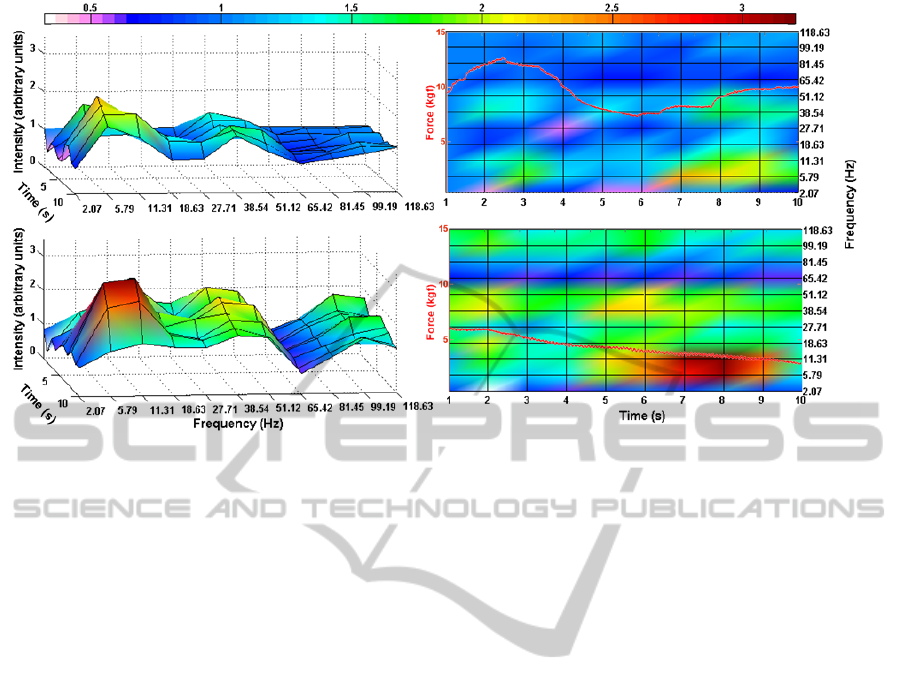
Figure 4: Normalized 3D (A and C) and 2D (B and D) MMG time-frequency responses of rectus femoris muscle. Data
normalized by the first second. A and B: ten initial seconds of FES-force-controlled application (unfatigued muscle). C and
D: ten final seconds of FES-force-controlled application (fatigued muscle). The color bar shows the maximum value (3.2
normalized data) in dark red color and the values below 10% of maximum (0.32 normalized data) are in white color. Force:
red line in 2D image.
with modulated frequency (70 Hz tetanic frequency).
The same event occurs when modulated frequency is
set to 50 Hz. At this situation the signal shows a
peak energy at the range of 51.12 Hz and other peak
at 11.31 Hz (Krueger et al., 2013b) as in our
previous study. These events on signal are not due to
FES interference, because the electrical stimulator
intensity is increased along the protocol application
and the energy variation around 65.42 Hz keeps
practically the same content (normalized data in
Figure 4).
At final stage (fatigued), both Figures 3 and 4
indicate the increase of energy at lower frequencies
(mainly 11.31 Hz) when the muscular fatigue occurs
(Tarata, 2003; Gandevia et al., 1995). Using the
FES-control based on knee joint angle rather than on
force the result is the same (Krueger et al., 2013a).
This lower frequency energy concentration may be
due to motor units coherence (Yao et al., 2000)
when myofibers vibrate in phase during contraction
in fatigue state. Moreover, the increased energy for
low frequency bands in the last seconds of protocol
may be associated with a decrease in muscle fibre
conduction velocity, that is a peripheral factor,
related to the occurrence of muscle fatigue as occurs
with able-bodied subjects (Schillings et al., 2003).
5 CONCLUSIONS
During fatigue conditions the mechanomyographic
signal of rectus femoris muscle from a paraplegic
subject presents a greater energy concentration at
lower frequencies (mainly 11.31 Hz band
frequency). This fatigue information in paraplegic
subject (without voluntary contraction) is helpful to
knowledge's improvement regarding muscular
physiology after spinal cord injury.
ACKNOWLEDGEMENTS
We would like to thank CNPq and SETI-PR for
important funding and financial support.
REFERENCES
Cè, E., Rampichini, S., Agnello, L., Limonta, E.,
Veicsteinas, A. & Esposito, F. 2013. Effects of
temperature and fatigue on the electromechanical
delay components. Muscle & Nerve, 47, 566-576.
Faller, L., Nogueira-Neto, G. N., Button, V. L. D. S. N. &
Nohama, P. 2009. Muscle fatigue assessment by
mechanomyography during application of NMES
protocol. Revista brasileira de Fisioterapia, 13, 422-
429.
(A)
(B)
(C) (D)
BIOSIGNALS2014-InternationalConferenceonBio-inspiredSystemsandSignalProcessing
242

Gandevia, S. C., Enoka, R. M., Mccomas, A. J., Stuart, D.
G. & Thomas, C. K. 1995. Fatigue: Neural and
Muscular Mechanisms, New York, Springer Us.
Gerrits, H., De Haan, A., Hopman, M., Van Der Woude,
L., Jones, D. & Sargeant, A. 1999. Contractile
properties of the quadriceps muscle in individuals with
spinal cord injury. Muscle & Nerve, 22, 1249-1256.
Krueger, E., Scheeren, E., Lazzaretti, A. E., Nogueira-
Neto, G. N., Button, V. L. S. N. & Nohama, P. Year.
Cauchy wavelet-based mechanomyographic analysis
for muscle contraction evoked by fes in a spinal cord
injured person. In: IASTED, ed. 10th IASTED
International Conference on Biomedical Engineering,,
February 13 - 15, 2013a Innsbruck, Austria. 237-42.
Krueger, E., Scheeren, E., Nogueira-Neto, G. N. &
Nohama, P. Year. Time-Frequency Muscle Responses
Elicited by Different FES Modulating Frequencies in
Paraplegics. In: 18th IFESS Annual Conference,
2013b Donostia-San Sebastian, Spain. Serbia:
Academic Mind, 249-252.
Nogueira-Neto, G., Scheeren, E., Krueger, E., Nohama, P.
& Button, V. L. 2013. The Influence of Window
Length Analysis on the Time and Frequency Domain
of Mechanomyographic and Electromyographic
Signals of Submaximal Fatiguing Contractions. Open
Journal of Biophysics, 3, 178-190.
Reilly, J. P. 1992. Electrical stimulation and
electropathology, Cambridge, USA, Cambridge
University Press.
Schillings, M. L., Hoefsloot, W., Stegeman, D. F. &
Zwarts, M. J. 2003. Relative contributions of central
and peripheral factors to fatigue during a maximal
sustained effort. European Journal of Applied
Physiology, 90, 562-568.
Seki, K., Ogura, T., Sato, M. & Ichie, M. Year. Changes
of the evoked mechanomyogram during electrical
stimulation. In: Annual Conference of the
International Functional Electrical Stimulation
Society, 2003 Brisbane.
Tarata, M. T. 2003. Mechanomyography versus
electromyography, in monitoring the muscular fatigue.
Biomedical Engineering Online, 2, 3.
Von Tscharner, V. 2000. Intensity analysis in time-
frequency space of surface myoelectric signals by
wavelets of specified resolution. Journal of
Electromyography and Kinesiology, 10, 433-445.
Yao, W., Fuglevand, R. J. & Enoka, R. M. 2000. Motor-
unit synchronization increases EMG amplitude and
decreases force steadiness of simulated contractions.
Journal of Neurophysiology, 83, 441-452.
TheRectusFemorisMuscleFatiguethroughMechanomyographicTime-FrequencyResponseinParaplegicSubject-
PreliminaryResults
243
