
Challenges of Capacity Modelling in Complex IT Architectures
Andrea Kő, Péter Fehér and Zoltán Szabó
Institute of Information Technology, Corvinus University of Budapest, Budapest, Hungary
Keywords: Internal Cloud, Capacity Management, Modelling, Neural Networks, Multivariate Statistics.
Abstract: As internal cloud, and cloud technologies widespread among companies, the responsibility of providing
reliable IT infrastructure and adequate capacities became the top priority for companies. While internal
clouds and related technologies creates the flexibility for customer, limited IT resources arise problems for
providing capacities, that has impact on IT service quality. The presented research addressing this problem,
and seeks creating models describing the relationship between IT service quality and background
infrastructure capacity usage with two distinct methodologies, in a complex cloud-like environment of a
financial institution. The research was analysed a pilot area of a widely used electronic banking service. As
multivariate statistical modelling and hypothesis testing had limited results in phase 1, but in phase 2 further
modelling opportunities were explored, a model based neural networks were developed. The research
analyses the limitations of pure statistical analysis in cloud-like environments, but concludes to the usability
of alternative methods.
1 INTRODUCTION
As the popularity of internal and hybrid clouds is
advancing, companies apply cloud technology like
solutions in their internal environments. As
companies implement virtualization, dynamic
resource scaling and load balancing, adequate IT
architectures and infrastructures became more and
more important. As opposite of external clouds,
where capacities are seemingly infinite for users, in
case of internal clouds resource capacities are
limited, and require careful planning. In this case
internal cloud architectures offer flexibility, but also
limit of capacity planning, because dependences of
infrastructure elements and IT services are difficult
to clarify. Exploration of the relation between IT
service quality and capacity management is vital in
order to understand and improve operational
processes and supports identification problems faster
and more reliable way.
This paper aims to explore the relationship
between front-end quality of IT service in internal
cloud environment, and the infrastructure capacity
usage, analysing methods to predict required
capacities and service levels. The research used the
environment of a financial institution (Central-
European branch of a multinational bank) that is
developing its IT architecture via cloud
technologies.
IT service quality prediction allows enterprises to
support the need of adaptation and customization of
IT infrastructure and thus it helps to prevent the
actual occurrence of failures or to mitigate upcoming
failures. Such proactive adaptation capabilities are
increasingly relevant especially for future service-
oriented systems (Metzger et al., 2012) and in
internal cloud environments (Rountree and Castrillo,
2013). Investigation of the relation between capacity
management and IT service quality support to
understand and improve operational processes and
enhance problems identification quickly and
systematically. It facilitates establishing valid and
reliable service performance measures. Measuring
customer satisfaction and other performance
outcomes can benefit from the solution as well.
2 LITERATURE REVIEW
IT services underpins business operations, IT has
business critical role as it has strong impact on
business operations. IT service management (ITSM)
methodologies and standards, especially ITIL (IT
Infrastructure Library) have recently become a very
popular approach and a widely used methodology to
improve this organizational activity (Taylor, 2007).
543
Kõ A., Fehér P. and Szabó Z..
Challenges of Capacity Modelling in Complex IT Architectures.
DOI: 10.5220/0004851505430550
In Proceedings of the 4th International Conference on Cloud Computing and Services Science (CLOSER-2014), pages 543-550
ISBN: 978-989-758-019-2
Copyright
c
2014 SCITEPRESS (Science and Technology Publications, Lda.)

The IT Infrastructure Library, as a comprehensive
approach is a set of processes and functions that
define best practices for managing, optimizing IT
services, ensuring the responsiveness, cost-
effectiveness of IT. ITIL helps to make IT a strategic
asset for the company. The key ITSM procedures
can be grouped into 5 major categories, integrating
several processes into a life-cycle ranging from
service Strategy to Continual Service Improvement.
Our research topic concentrates on a core process
of ITIL: capacity management. This is a business-
critical activity that is responsible for the smooth
operations of IT supported business operations, that
safeguards the quality of services and ensures the
efficient processing of large volumes of business
transactions. The goal of capacity management is to
ensure that the capacities underpinning the business
services through IT services meets the agreed
requirements cost-effectively and in a timely
manner, by understanding and satisfying current and
future capacity and performance demand of the
business. Capacity management, through the
alignment of IT objectives with business priorities
on short and long terms reduces the total cost of
ownership of IT infrastructure and operations, and
has central part of the warranty of the IT services
(OGC, 2007). According to Broussard (Broussard,
2008) measuring and management of the
performance of IT services is among the top issues
for IT managers. Microsoft operations framework
(MOF) has capacity management process too
(Bagley et.al. 2002).
Capacity management has proactive and reactive
tasks to enable the synchronization of IT and
business performance. It ensures current operations
by optimizing resource utilization and fine-tuning
the infrastructure, monitoring the operations and
supporting capacity-related incident management.
Capacity management has also long term
responsibilities that enable organizations to balance
long term costs against the IT resources needed, and
balancing supply and demand of IT services
(development plans, budgeting, procurement, etc.).
It has responsibilities and procedures on business,
services and component levels (OGC, 2011).
Although the concept has long history and
integrates experiences and best practices, designing
and establishing comprehensive capacity
management activities in a complex IT environment
is a demanding task. Capacity management is
closely related to application sizing, but it follows a
service-oriented and comprehensive approach,
covering the whole life cycle of IT services. Another
related concept is the performance management.
Performance management traditionally monitor and
manage IT performance, optimize infrastructure
utilization, and support component-level capacity
planning and service-level reporting. Capacity
management utilizes several methods and techniques
(many of them discussed in Kant and Srinivasan,
1992), integrated into a holistic approach of Service
Design processes. Implementation issues of capacity
management discussed in details by Higday-
Kalmanowitz and Simpson (2004).
The main challenge relies on the management of
complexity. Recently business services are
supported by several multiple interdependent and
multilayered IT services. As more automation,
virtualization is embedded in the underpinning IT
systems, the dynamic nature of the resources
requires special attention, careful design and strict
control (HP, 2008). The IT organization is
responsible for guaranteeing the agreed level of
performance and quality to business users. In order
to maintain control over the IT environment and to
ensure the services meet business requirements, IT
must have the explicit knowledge of the
dependencies and performance of the entire system,
both in real time and in historical terms. A key
aspect of capacity management is the detailed
understanding of business patterns, user profiles,
dependencies of business processes and IT services.
This requires extensive and well-targeted, objective
monitoring of IT activities and resource utilization.
The exploration and documentation of complex
interdependencies of IT services and the supporting
infrastructure components is also a requirement.
Planning and forward looking processes also require
sophisticated tools and techniques to enable
modelling, analysis and reporting (OGC 2011; EMA
2012).
Capacity management integrates many activities,
collects many inputs from several data resources
(business, service, component and financial data)
and enables several processes that have central role
in the management of the IT as a business. It
monitors utilization of individual components and
response times of services. It collects and transforms
business needs and utilization patterns into IT
requirements for services. By analysing data it
identifies trends, bottlenecks and enables tuning of
components, applications or services. On short term
the management of thresholds and capacity related
incidents is closely integrated to operational
activities (scheduling, workload management,
virtualization, etc.). On long term, demand
management and capacity planning, application
sizing etc. requires modelling and trending tools and
CLOSER2014-4thInternationalConferenceonCloudComputingandServicesScience
544

techniques: trend analysis, analytical modelling and
simulations (OGC 2011).
There are similar initiatives in capacity planning
and performance optimization. Lee and Asanovic
implemented a multiprocessor system simulator
(METERG QoS system) to provide a method for the
estimation of the lower bound on end-to-end
performance for a given configuration of resource
reservations (Lee and Asanovic, 2006). A
comprehensive high level modeling framework was
developed by Heckmann to analyse economical and
technical hypothetical questions of service providers
throughout a service’s life cycle (Heckmann, 2012).
HP experts created a closed multi-tier multi-station
queueing network model that combines performance
modeling with performance profiling (Chen et.al.
2007). Their experiments show that the model is
appropriate in a typical 3-tier e-commerce
application in a virtualized environment to translate
SLAs to lower-level resource requirements for each
involved system in providing the service. Kousiouris
(Kousiouris, et.al. 2011) used a generic black box
approach, based on Artificial Neural Networks,
appropriate for SLA negotiations. Our model, based
on a similar modelling approach, is focusing on the
runtime of a complex group of applications.
3 RESEARCH OVERVIEW
The presented research in this paper is aimed to
explore the relationship between front-end quality of
the provided IT service, and the background
infrastructure capacity usage in an internal cloud
environment.
Although the research, as a whole is considered
to be an explorative, in order to create a model to
describe this relationship, the researchers have
strong hypotheses on the related factors. During the
development of the relationship model, these
hypotheses are codified and tested in a pilot
environment with multidimensional statistical
methods.
The research was conducted in a Central-
European branch of a multinational financial
institution (named as “Bank” in the following). The
Bank serves both private and business customers
with mainly commercial banking products, with the
addition of investment possibilities. Products can be
reached via several channels, including local offices,
telebanking, Internet banking services, and dedicated
business terminals for companies.
Information technology is a vital part of this
company, as in every financial institution.
Information technology is expected to provide cost
savings, and improved internal efficiency (Fung,
2008; Ehikhamenor, 2003), but it is also expected to
create new opportunities for expanding business, and
interacting with customers (Liao and Wong, 2007,
Vatanasombut et al 2008; Lee, 2008).
By today, the banking industry heavily depends
on the information technology services, therefore it
is vital to provide these services at least on a
minimum acceptable level. Failing this condition
results decreasing quality in business products,
lower customer satisfaction, and eventually losing
customers.
With the increase of technological complexity, it
is more and more difficult to monitor and relate
component performances and capacities (Metzler,
2003). The question is what is required to provide
quality services, what are the factors that have
impact on service quality?
In case of complex IT architectures, with the
application of cloud technologies, IT infrastructure
resources are often shared (virtualised) among
logical elements. In results a complex load on the
physical level by logically separate servers and
services. Companies usually measure the physical
level and neglect end-user quality questions.
Moreover even physical level measures are the
results of ad-hoc decisions, resulting incomplete
datasets for analysis. But the main challenge is the
lack of definite relationship between infrastructure
performance and end user service quality.
To explore the above mentioned research
questions the services of the Internet Banking
channel of the institution were selected. The
research idea was considered adequate for research
purposes, because of the following reasons:
Service quality is directly perceptible by
customers
The background IT architecture is complex, and
covers the relevant banking products and
services
Provides sample data in adequate size for
statistical analysis that is representative for the
research services.
Although the main conditions are adequate for
analysis, the research had to deal with limited and
incomplete datasets on the physical and logical level
of the IT architecture.
The Internet Banking channel covers 8 main
banking products and services, with 4 other
administrative services. While the administrative
services cover over one third of the overall
transaction numbers, these services use only load on
the direct web server, while the business services use
ChallengesofCapacityModellinginComplexITArchitectures
545
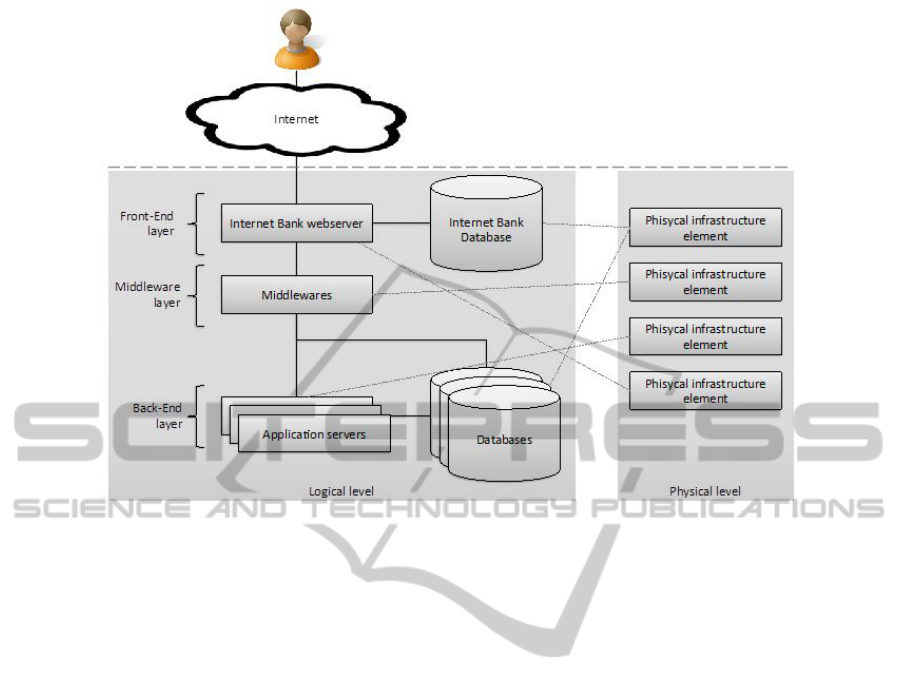
Figure 1: Architecture overview of the researched Internet Bank.
a wide range of the IT architecture. This paper
analyses the problems of the most popular
transaction type: domestic money transfer, that
covers almost two third of business service
transactions.
3.1 Architecture Structure of Services
In order to understand the relationship between
components, the architecture behind the visible
services should be explored. Generally IT
architecture of every provided service consists of a
front end (client software) and a back-end (servers
and resources) layer (Figure 1). The two layers are
connected via a middleware layer (Stephens, 2010).
In case of an infrastructure cloud (Sitaram and
Manjunath, 2011) the capacity of the same physical
resource (a server, a storage, CPU, memory, etc.) is
shared between several virtualised elements
(application servers, database servers, etc).
Moreover, the same virtual server can be used by
several other applications and services. Therefore a
certain IT service competes for the same resources
against other IT services.
Based on the used technology and policy settings
virtual infrastructure elements, or applications can
have dedicated resources, or a service can use
resources in a flexible way, based on its current
needs. The presented research concentrates on the
latter environment, because in this case the quality
of a service does not depend only on the used
capacities, but also influenced by other competing
resources.
In case of the presented research, the Internet
Bank is accessed by the customers of the bank via an
online user interface that can be used in any
browser. This interface is served directly in the
front-end layer with an application server, and its
database that contains front-end related data. In case
of business services the access of the back-end
infrastructure elements (applications, databases, via
the middleware layer) is required to record
transactions, to check account balances, or to filter
fraudulent activities. Each virtual server of database
runs on different physical infrastructure elements
that are shared among several logical infrastructure
elements, even outside of the Internet Banking
service group.
In this architecture quality of the money transfer
service is measured as response times within the
boundaries of the Bank, in the context, where
business services are defined as the available
functions, or transaction types of the user interface.
Because the bank have no influence neither on the
quality of the Internet network, nor on the quality of
provided internet service for the customer, this part
of the response time was not used during analysis.
Measurement on transaction numbers, and
transaction time periods were recorded for the
researched service (money transfer), and the used
CLOSER2014-4thInternationalConferenceonCloudComputingandServicesScience
546

logical and physical infrastructure elements through
the data flow and processing were identified.
Because logical infrastructure elements use– even in
case of dedicated pools – the capacities of the
physical infrastructure, measures were applied on
the physical level.
4 ANALYSIS
In Phase 1 the research started to prepare a
prediction model based on multivariate statistical
analysis. In order to form the model series of
hypotheses was formed and tested. In phase 2 the
limitations of the research model were addressed and
alternative methods were used.
4.1 Phase 1: Research Model and
Hypotheses
Figure 2 summarizes the expectations of the model.
It is expected, that the service quality of money
transfer – in this case the response time – is
impacted by four main factors:
Capacity usage of the used physical
infrastructure (H4)
Capacity usage of the front-end application
(H5)
The day of the week (H6)
Number of transaction in the measured
timeframe (H7)
As background hypothesis, the research analyzed the
relationship, how the capacity usage is impacted by
the behaviour of the users during a week that
revealed in the number of transactions. For this
relationship we analyzed the relationship between
the day of the week and the number of transactions
(H1), the number of transaction and the capacity
usage of the front-end application (H2), and the
front-end load and capacity usage of back-end
applications (H3). For every relationship (H1-H3
and H4-H7) the research expected positive impact
that makes available prediction model for service
quality.
4.2 Data Preparation
In many researches data are analysed for identifying
extraordinary values. In this research extraordinary
values (in every parameter) are the most vital parts
of the research problems. If there are particular high
values in response time that does not fit into the
patterns of the data, researching the reasons is the
most valuable for companies, because these response
time causes them the problems in operations.
These cases are not uncommon for the research
service in this shared and virtualized environment,
and these kinds of cases can have serious impact on
customer satisfaction and company reputation
(Johnson and Peppas, 2003, Johnston 2004).
Response time above accepted in the Service Level
Agreement represent a 24,31% share of the total
transactions.
Because of these reasons, and despite only 3,7%
of the data are considered as extraordinary, no data
were excluded at this phase of the research, nor were
the sample split into normal and extraordinary cases.
4.3 Hypotheses Testing
To test the hypothesis 1 (H1), that specific days has
influence on the number of transactions the analysis
of variance were executed. To test the homogeneity
Weekday
(Monday‐Sunday)
Front‐endload
Load on hw 1
Load on hw 2
Load on hw n
Response time
…
H1
H3
H4
No.of
transactions
H2
H5
H6
H7
Figure 2: Basic research model and hypotheses.
ChallengesofCapacityModellinginComplexITArchitectures
547

of variances Levene Statistics was applied and was
significant (0,000), while F test also justifies the
difference of transaction number means of different
weekdays.
Moreover there are also differences in the
patterns of capacity usage in the Front End layer
(H2) and Processing layer components. Capacity
usage averages tend to follow transaction numbers
(strong correlations >0,9 on significance level <
0,01), but response times (H7) follow a different
pattern (no significant correlation). Moreover the
research could not find significant correlation
between service quality and the front-end load or the
processing layers (H4 and H5).
The filter the cross-impact of each component,
partial correlation analysis supported hypotheses
testing. Even with this refines analysis, the research
cannot confirm the relationship between the capacity
usage of the physical infrastructure and service
quality (H4 and H5).
The research can only confirm, that there is a
relationship between the special days and response
times, but this relationship alone is not complete to
build a predictive model for service quality.
4.4 Phase 2: Neural Network Analysis
of Capacity Data
To overcome the unsatisfying results of statistical
models in capacity analyses, we applied another
promising modelling approach, artificial neural
networks (ANN). Neural networks are inspired by
the working mechanism of human brain and they are
known as promising solutions in forecasting and
business classification applications, because of their
beneficial characteristics (Turban, 2011):
They are able to deal with highly nonlinear
relationships,
Not prone to restricting normality and/or
independence assumptions
Can handle variety of problem types
Usually provides better results (prediction
and/or clustering) compared to its statistical
counterparts
Handles both numerical and categorical
variables.
Neural networks are able to “learn”, they are often
called universal approximators (Sifaoui, 2008).
Learning algorithms specify the process by which
neural network learns the underlying relationship
between input and outputs or between inputs.
Learning algorithms can be supervised or
unsupervised (Mohri et al., 2012), (Barlow, 1989).
Supervised learning is often applied in prediction
area, while unsupervised learning is frequently used
in clustering problems. Pattern recognition,
forecasting, prediction, and classification are the
typical tasks for ANN. Application areas are various,
like finance, marketing, manufacturing, operations,
information systems, and so on.
In our case neural networks were utilized for
those services where the statistical investigation had
no satisfying result. According our task type, which
is a prediction, one of the most promising ANN
model, multilayer perceptron network was selected.
Multilayer perceptron is a feedforward, supervised
learning model (Rumelhart, 1986).
Several software tools are available for
modelling neural networks, amongst other
commercial and open source data mining software
suits, like SAS Enterprise Miner, Statistica Data
Miner, PASW, Rapidminer, R and standalone
solutions, like NeuroSolutions, BrainMaker,
NeuralWare and NeuroShell. Rapidminer was
selected as a modelling environment, because
nowadays it is a leading open source data mining
solution with rich functionality (Rexer, 2009). It has
more than 600 operators and user friendly graphical
user interface.
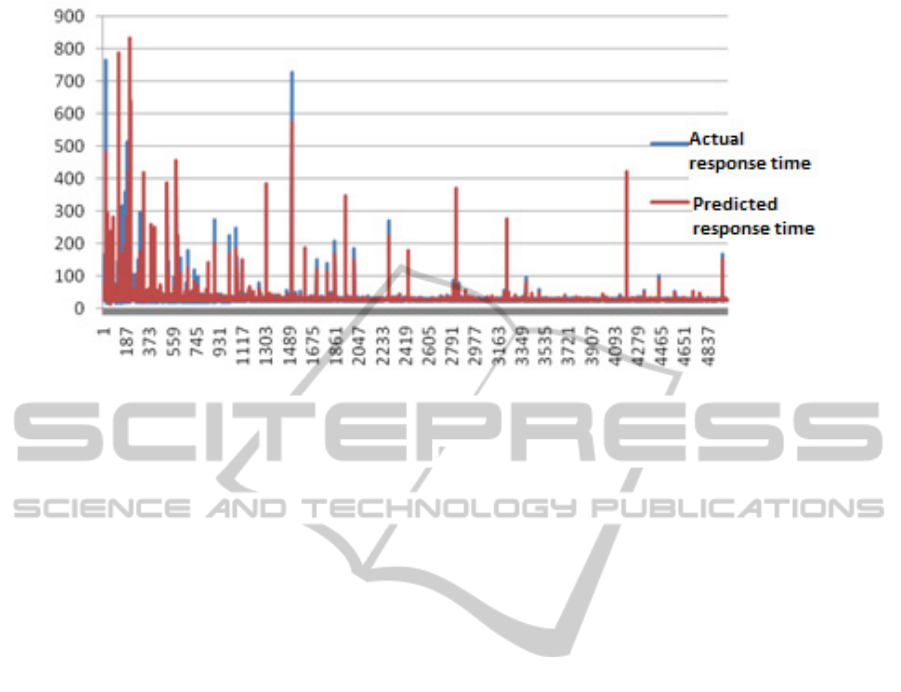
ANN network topology for HUF transfer service
consisted of one input layer, one output layer and
one hidden layer. Input variables included date, like
weekday, hour and minute and infrastructure
measurements, like CPU. Output variable was PI
runtime. Training data set of HUF transfer model
included 11807 records of HUF transfer service data
of a monthly period. This data set was applied to
build ANN model. Model testing was done on the
13622 records of HUF transfer service data from
next month. Results included predicted response
time, actual response time are shown on the figure 3.
In model evaluation the following error functions
were applied: correlation, root_mean_squared_error,
absolute_error, squared_error, prediction_average,
spearman_rho, kendall_tau. Correlation was 0.208
for the whole data set, which was not satisfactory
result. This bad value is caused by the outliers (8%
of the whole data set). In a modified data set which
doesn’t contain outliers; correlation was 0.89, which
is an appropriate outcome. The ANN modelling
environment was applied afterwards for capacity
investigation in the bank by consultants. The ANN
model was regularly updated and maintained
according the changing capacity environment.
CLOSER2014-4thInternationalConferenceonCloudComputingandServicesScience
548
5 CONCLUSION
Our results shows that traditional multivariate
statistic-based models and techniques have only
limited explanation power in today’s complex
virtualized, cloud-like IT infrastructure, as popularly
labelled as internal clouds. Seemingly trivial
hypotheses were failed, suggesting that there are
hidden interdependencies and unrecognized
relationships between IT infrastructure elements and
the business services. Although realizing the
necessity and usefulness of traditional statistical
analysis, to develop a comprehensive and easy-to-
use model more sophisticated tools should be used,
underpinned with the knowledge crystallized in the
corporate architecture models.
This paper analyzed the relation between
capacity management and IT service quality. We set
up a research model and hypothesis, which was
tested in a Bank. We could accept four hypotheses,
but two were declined. These two services required
another research approach, beyond the traditional
statistical models. Therefore an artificial neural
network for capacity modelling was selected, as
alternate modelling method. ANN has several
promising characteristics; the most important ones
are its non-linear feature and learning ability. One of
the main limitations of our result is that neural
networks are not so popular amongst business
decision makers, because they are deemed to be
black-box solutions; we have no explanation about
the results. In spite of the sometimes negative
attitude of decision makers towards ANN, this
model was applied after the research in the Bank for
capacity modelling in IT operations.
Capacity and service level management can be
supported with ANN based prediction models.
Predicted changing numbers of transactions (based
on a marketing campaign or policy issues) is a good
input parameter for running the model. Based on the
ANN approach changed capacity usage and internal
response time can be predicted, and unacceptable
response time periods can be identified. Based on
the predicted response times, capacity and service
level managers can decide on a) investing into new
infrastructure elements to provide the required
capacity for peak times, b) change server capacities
to restructure resources for more demanding
applications or c) influence customer behaviour to
smooth overused capacities into underused time
periods. Capacity planning allows organisations to
prepare their future quality of service for predicted
user behaviours.
Further developments include fine-tuning of the
ANN modelling environment and testing other ANN
topologies, and additional architectural
environments.
REFERENCES
Bagley, W.; Hanna, A.; Howels, V.; Rasmussen, K.;
Rytkonnen, P.; Westover, J.; Yuhas, J., 2002. MOF
Service Management Function Capacity Management.
Microsoft Corporation, Redmond
Barlow, Horace B., 1989. Unsupervised learning. Neural
computation 1.3 pp. 295-311.
Figure 3: Predicted and actual response time for HUF transfer service.
ChallengesofCapacityModellinginComplexITArchitectures
549

Broussard, Frederick W., 2008. IT Service Management
Needs and Adoption Trends: An Analysis of a Global
Survey of IT Executives. IDC White Paper.
http://whitepapers.techrepublic.com.com/abstract.aspx
?docid=395611 (accessed: 28.06.2009)
Chen, Y., Iyer, S., Liu, X., Milojicic, D., Sahai, A., 2007.
SLA Decomposition: Translating Service Level
Objectives to System Level Thresholds. Enterprise
Systems and Software Lab, HP Labs.
http://www.hpl.hp.com/techreports/2007/HPL-2007-
17.pdf. (accessed: 28.12.2013)
Ehikhamenor, F.A., 2003. Information technology in
Nigerian banks: The limits of expectations.
Information Technology for Development 10, 13–24.
EMA, 2012. IT Optimization through Predictive Capacity
Management. ENTERPRISE MANAGEMENT
ASSOCIATES (EMA) White Paper.
http://www.ca.com/~/media/Files/IndustryAnalystRep
orts/it-optimization-through-predictive-capacity-
management.pdf (accessed: 28.08.2012)
Fung, M.K., 2008. To What Extent Are Labor-Saving
Technologies Improving Efficiency in the Use of
Human Resources? Evidence from the Banking
Industry. Production and Operations Management 17,
pp. 75–92.
Heckmann, B., 2012. Service Quality and Profit Control
in Utility Computing Service Life Cycles, Doctorate,
University of Plymouth, Plymouth,
http://hdl.handle.net/10026.1/1568 (accessed:
28.12.2013)
Higday-Kalmanowitz C.; Simpson E. S. (eds.), 2004.
Implementing Service and Support Management
Processes: A Practical Guide. Van Haren Publishing
HP, 2008. End-to-end service management in the
virtualized environment. White Paper.
https://h10078.www1.hp.com/bto/download/4AA2-
3182ENW.pdf (accessed: 28.08.2012)
Kant, K.; Srinivasan, M. M., 1992. Introduction to
computer system performance evaluation. McGraw-
Hill International edition.
Kousiouris, G.; Kyriazis, D.; Gogouvitis, S.; Menychtas,
A.; Konstanteli, K.; Varvarigou, T., 2011. "Translation
of application-level terms to resource-level attributes
across the Cloud stack layers," Computers and
Communications (ISCC), 2011 IEEE Symposium on,
vol., no., pp.153,160, June 28 2011-July 1 2011
Lee, J.W.; Asanovic, K., 2006. "METERG: Measurement-
Based End-to-End Performance Estimation Technique
in QoS-Capable Multiprocessors," Real-Time and
Embedded Technology and Applications Symposium,
2006. Proceedings of the 12th IEEE , vol., no.,
pp.135,147, 04-07 April 2006
Lee, M.-C., 2009. Factors influencing the adoption of
internet banking: An integration of TAM and TPB
with perceived risk and perceived benefit. Electronic
Commerce Research and Applications 8, pp. 130–141.
Liao, Z., Wong, W.K., 2007. The determinants of
customer interactions with internet-enabled e-banking
services. Journal of the Operational Research Society
59, pp. 1201–1210.
Metzger, A., Chi-Hung C.; Engel, Y.; Marconi, A., 2012.
Research challenges on online service quality
prediction for proactive adaptation. In.: Proceedings
Software Services and Systems Research - Results and
Challenges (S-Cube), 2012 Workshop on European
Software Services and Systems Research - Results and
Challenges (S-Cube), pp. 51 - 57
Metzler, J., 2003. The Mandate to Implement Unified
Performance Management. Accessed: 29 Sept 2009,
source: http://www.comnews.com/WhitePaper_Libra
ry/Network_management/pdfs/NetScout_wp_Metzler_
Mandate_to_Implement_Unified_Performance_Manag
ement.pdf
Mohri, M., Rostamizadeh, A., Talwalkar, A., 2012.
Foundations of Machine Learning. The MIT Press
ISBN 9780262018258.
OGC. 2007. ITIL Service Design. London: The Stationery
Office Ltd.
OGC, 2011. ITIL Service Design. London: The Stationery
Office Ltd.
Rexer, K., 2009. Data Mining Tools Used Poll.
KDNuggets,
http://www.kdnuggets.com/polls/2009/data-mining-
tools-used.htm (2009.08.24)
Rountree, D., Castrillo, I. (2013) The Basics of Cloud
Computing, Understanding the Fundamentals of Cloud
Computing in Theory and Practice, Elsevier
Rumelhart, D. E., Hinton, G. E. and Williams, R. J., 1986.
„Learning internal representations by error
propagation”. In Rumelhart, D. E. and McClelland, J.
L. (eds.), „Parallel Distributed Processing”, Vol. 1.,
MIT Press, Cambridge, MA.
Sifaoui, A., Abdelkrim, A., Benrejeb, M., 2008. On the
Use of Neural Network as a Universal Approximator.
International Journal on Sciences and Techniques of
Automatic control & computer engineering, IJ-STA,
Vol. 2, N. 1, pp. 386-399.
Sitaram, D., Manjunath, G. 2011. Moving To The Cloud:
Developing Apps in the New World of Cloud
Computing. Elsevier
Stephens, D., 2010. The Challenges Monitoring
Composite Applications. MeasureIT 8.
Taylor, S. 2007. ITIL: The official introduction to the ITIL
Service Lifecycle. The Stationery Office Ltd.
Turban, E., Sharda, R., Delen, D., 2011. Decision Support
and Business Intelligence Systems. 9/E, (ISBN-10:
013610729X)
Vatanasombut, B., Igbaria, M., Stylianou, A.C., Rodgers,
W., 2008. Information systems continuance intention
of web-based applications customers: The case of
online banking. Information & Management 45, pp.
419–428.
CLOSER2014-4thInternationalConferenceonCloudComputingandServicesScience
550
