
Verification and Validation Activities for Embedded Systems
A Feasibility Study on a Reading Technique for SysML Models
Erik Aceiro Antonio, Rafael Rovina and Sandra C. P. F. Fabbri
Department of Computer Science, Federal University of São Carlos, São Carlos, Brazil
Keywords: Inspection Activity, Reading Technique, Embedded System, SysML, SYSMOD.
Abstract: Embedded Systems play an important role on today's interconnected world. However, there is a gap in
relation to Verification and Validation (V&V) activities for Embedded Systems, particularly when they are
designed with SysML models. Hence, the objective of this paper is to present a feasibility study on a
Reading Techniques for detecting defects in SysML models. This technique is part of a family of reading
techniques for inspecting Requirement Diagrams and State Machine Diagrams which are SysML models
designed along the SYSMOD development process. The definition of these techniques required the
establishment of a defects taxonomy, which was based on three sources: i) the certification standards for
embedded systems UL-98 and DO-178C; ii) the Failure Mode and Effects Analysis (FMEA); and iii) the
syntactic and semantic elements available in the formalism of the SysML language. A feasibility study was
carried out to evaluate the effectiveness and efficiency of one of the techniques. From a total of 26 subjects,
50% have found an average of 72% of defects and spent an average of 48 minutes.
1 INTRODUCTION
The development process of Embedded Systems
requires strict definition of functional and non-
functional requirements such as, for example, time
constraints (real-time), reliability and accurate
requirements definition (Liggesmeyer and Trapp,
2009). In this context, the Embedded Systems
Engineering aims to explore techniques and
strategies largely used in the traditional software
engineering to promote quality in the embedded
systems development (Graaf, Lormans and Toetenel
2003). As a result, the modeling techniques and
formal languages for the development of embedded
systems have been pointed by the literature as
promising approaches. As examples, we can cite the
Unified Modeling Language (UML) and its
extensions RT and MARTE (OMG, 2011); SysML
(OMG, 2010) and Model-Driven Architecture
(MDA) (Pastor and Molina, 2007). In terms of the
software development process, there is the
SYSMOD process which is a top-down process that
uses the artifacts of the SysML language to model
the functional and non-functional requirements
(Weilkiens, 2008).
However, despite the adoption of a process, it is
also important to apply software quality control
activities to ensure that both the process and the
artifacts generated during the execution of this
process have the expected quality. Examples of
software quality control activities are activities of
Verification and Validation (V&V) such as
inspection and testing. These types of activities have
been considered as an essential practice for critical
missions, especially for software that controls
manned and unmanned aerial vehicles (UAV)
(Albaker and Rahim, 2010). In addition, activities of
V&V should be applied along all the process aiming
to anticipate possible failures generated by the lack
of formalism during the transcription of
requirements to high level abstraction models.
The activities of V&V are considered as follows:
static activity, as inspection; and dynamic activity,
as the testing activity. The inspection activity was
initially proposed by Fagan (1976). It is considered a
static activity because it does not require the
execution of the artifact under inspection. It is
supported by reading techniques that provide to the
inspector guidelines for reading the artifact.
However, there is a lack of reading techniques for
embedded systems, mainly comprised for
UML/SysML and MATLAB/Simulink models.
Therefore, considering the importance of the
software quality control activities, the contributions
233
Aceiro Antonio E., Rovina R. and C. P. F. Fabbri S..
Verification and Validation Activities for Embedded Systems - A Feasibility Study on a Reading Technique for SysML Models.
DOI: 10.5220/0004887302330240
In Proceedings of the 16th International Conference on Enterprise Information Systems (ICEIS-2014), pages 233-240
ISBN: 978-989-758-028-4
Copyright
c
2014 SCITEPRESS (Science and Technology Publications, Lda.)

of this paper are: (i) to show that readings techniques
can aid the identification of defects of SysML
models; (ii) to present the family of reading
techniques that was created to support the inspection
of SysML and MATLAB/Simulink models
generated by SYSMOD process; and (iii) to present
the feasibility study that was carried out to explore
the feasibility of using such type of technique.
This paper is organized as follows: in Section 2
related works are commented; Section 3 presents the
family of reading techniques in the context of the
SYSMOD process; Section 4 describes the
feasibility study carried out for evaluating one of the
techniques; and Section 5 presents the conclusion e
future work.
2 RELATED WORK
Before starting the definition of the reading
techniques addressed in this paper, we conducted a
Systematic Mapping (SM) (Petersen et al., 2008)
aiming to identify the main studies related to V&V
activities in the context of embedded systems —
specifically in the modeling level. Systematic
Mappings are used, to detect literature evidence
about a topic to be explored while Systematic
Literature Reviews (SLR) (Kitchenham, 2004) are
used to identify, evaluate and interpret all relevant
research on a particular topic, aiming to establish the
state of the art about it. Frequently, SMs precede
SLRs.
In this SM a total of 411 studies were gathered
and during the screening phase — i.e., the selection
of relevant studies based on the inclusion and
exclusion criteria, just 80 of them were accepted.
After that, during the keywording phase — i.e., the
definition of the classification scheme, some facets
were defined. Among them, the three facets showed
in Figure 1, highlighted a gap regarding inspection
activities, particularly for detecting defects in
SysML models and Simulink models. Besides, only
49 studies, from the total of 80 studies, satisfy the
categories grouped in these facets. The other 31
studies address V&V activities for embedded system
but are not related to these three facets specifically.
Figure 1 maps the 49 studies according to these
facets. Observe from these 49 studies that 24 are
related to facet (1) and facet (2); and 25 are related
to facet (3) and facet (2). Hence, for example, there
is one study that addresses both the categories:
Reading Techniques and V&V Process; there are 8
studies that address Test Case Generation and V&V
techniques. Also, it is important to notice that the
same study can be included in more than one
relationship.
Aiming to exemplify the initiatives that are being
conducted, three studies will be commented. The
first study refers to the static activity of inspection.
Denger and Ciolkowski (2003) propose a Reading
technique for inspecting Statecharts models inspired
on Perspective Based Reading (PBR) (Basili et al.,
1996). Hence, the authors propose a taxonomy that
establishes quality criteria that should be present in
Statechart specifications of embedded systems.
Another study refers to the use of certification
standards for validating embedded system models.
In this case the certification standard DO-178C is
suggested as a V&V support activity in the context
of the GENESYS architecture. Although the authors
emphasize the importance of using UML/SysML in
this architecture, they do not address the use of
reading techniques. However, inspection has been
pointed out as an effective way for detecting defects
along a process and some reading techniques have
been proposed. As example we can cite the
following techniques: (i) PBR – Perspective Based
Reading (Basili et al., 1996), which is used to
inspect requirement documents; (ii) UBR – Use
Based Reading, which is used to detect anomalies in
user interface (Zhang et al., 1998); and (iii) OORTs
– Object Oriented Reading Techniques (Travassos et
al., 2000), which are used for inspecting UML
models at project level; and (iv) OORTs/ProDES
(Marucci et al., 2002), which are used for inspecting
UML models that are constructed according to the
ProDES process. Therefore, V&V activities have
been widely investigated by researches from
different points of view. However, no work was
identified that explored inspection activities for
SysML models, which are widely used for modeling
embedded systems.
3 A FAMILY OF READING
TECHNIQUES FOR SYSML
MODELS
SysML/System Modelling (SysML/SYSMOD)
(Weilkiens, 2008) is a top-down process of software
development which has been highlighted in the
community of embedded systems.
Considering the importance of the application of
verification and validation activities for quality in
software development and also that the SYSMOD
process uses SysML diagrams, we define a family of
reading techniques to be used with the SYSMOD
ICEIS2014-16thInternationalConferenceonEnterpriseInformationSystems
234
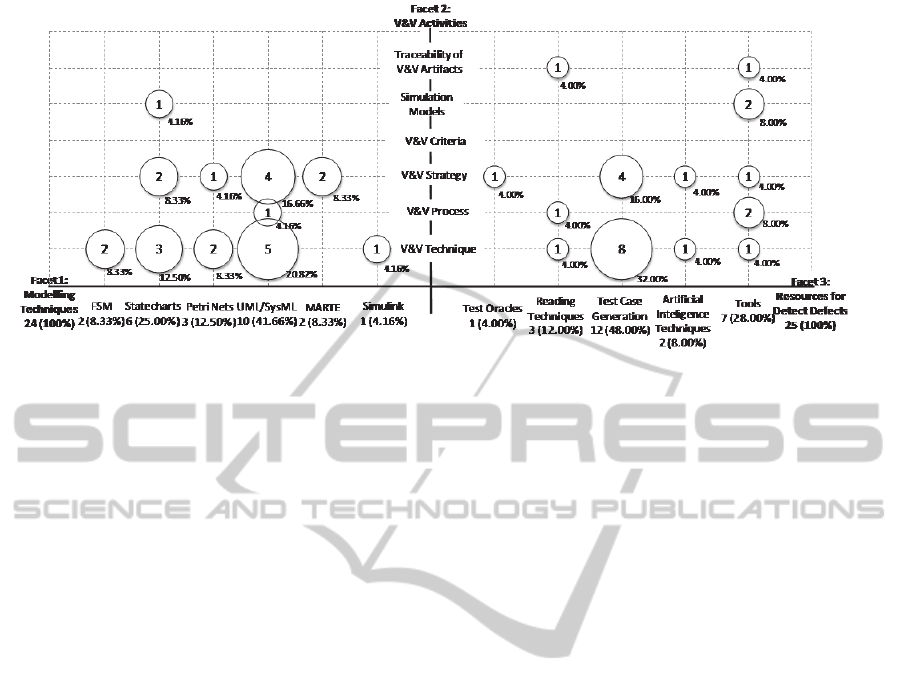
Figure 1: Systematic Mapping for V&V Activities.
process.
The goal of these techniques is to establish a
quality control activity to ensure that the information
is correctly transcribed from a diagram to another
diagram. Thus, any defects unintentionally inserted
during the development process can be identified
and corrected before being transferred to later stages
and propagated in various other defects, probably
increasing the cost of development. Figure 2
illustrates the SYSMOD process with the readings
techniques. This figure highlights the phases of this
process: Requirements, System Context, Use Cases,
Domain Knowledge, System Structure and Dynamic
System. Each SYSMOD phase defines the SysML
diagrams necessary for the specification of the
embedded system. For example, in the Requirements
phase, the system requirements are specified into a
Requirements Diagram (REQ), and in the System
Context phase, system requirements are detailed in
Internal Block Diagram (IBD) and Block Definition
Diagrams (BDD). The reading techniques have been
established between pairs of diagrams where the
information of one diagram is used to build the other
one. As an example, T1 technique is applied to the
pair of diagrams: Requirements Diagram (REQ) and
Internal Block Diagram (IBD) (Figure 2).
According to the nomenclature used by Travassos et
al., (2000) for UML, we named vertical reading
technique the one that uses the Requirements
Diagram and horizontal reading technique the ones
that do not involve the Requirements Diagram.
Thus, aiming to verify, during the system
development evolution, if the transcription of
information from one diagram to another diagram is
correct, a taxonomy of defects was defined. This
taxonomy is based on the Std1044 IEEE-2009
(IEEE, 2010) standard, and classifies a set of defects
inspired in three sources. One of these sources are
the UL-98 standard (Desai, 1998; UL, 1998) for
embedded systems and the DO-178C standard
(Daniels, 2011) for aircraft certification. The goal of
using these standards is to anticipate the
identification of defects for the modeling level, once
these standards are focused in identifying defects
only when the code of the embedded system is
already built. The second source is the Failure Mode
and Effects Analysis (FMEA) methodology (Pentti
and Atte, 2002). In this case, the goal is to identify
hardware elements susceptible to defects in the
diagrams addressed by the reading technique. The
third source are the syntactic and semantic elements
available in the formalism of the SysML language.
The goal is to verify whether the diagrams are
consistent to each other in terms of adequacy of
elements transcription. To exemplify the reading
techniques, we selected an excerpt of the reading
technique T4
comp
. Figure 3(a) shows an excerpt of
this technique in the textual format and Figure 3(b)
shows the same excerpt of this technique in the
flowchart format. Observe that parts (A) and (B) of
Figures 3(a) and 3(b) are exactly equals, and part (C)
describes the steps of the technique in the formats
previously mentioned.
See that part (A) specifies the objective of the
technique, the diagrams that are inspected and the
inputs and outputs of the technique as a whole.
Similarly, part (B) specifies the diagram that will be
prepared to be used in the consistency comparison.
Finally, part (C) specifies the steps of the
technique in the textual format (Figure 3(a)) and in
the flowchart format (Figure 3(b)).
Hence, in this example, observe that T4
comp
technique aims to identify defects associated to
relevant syntactic and semantic properties of the
VerificationandValidationActivitiesforEmbeddedSystems-AFeasibilityStudyonaReadingTechniqueforSysML
Models
235
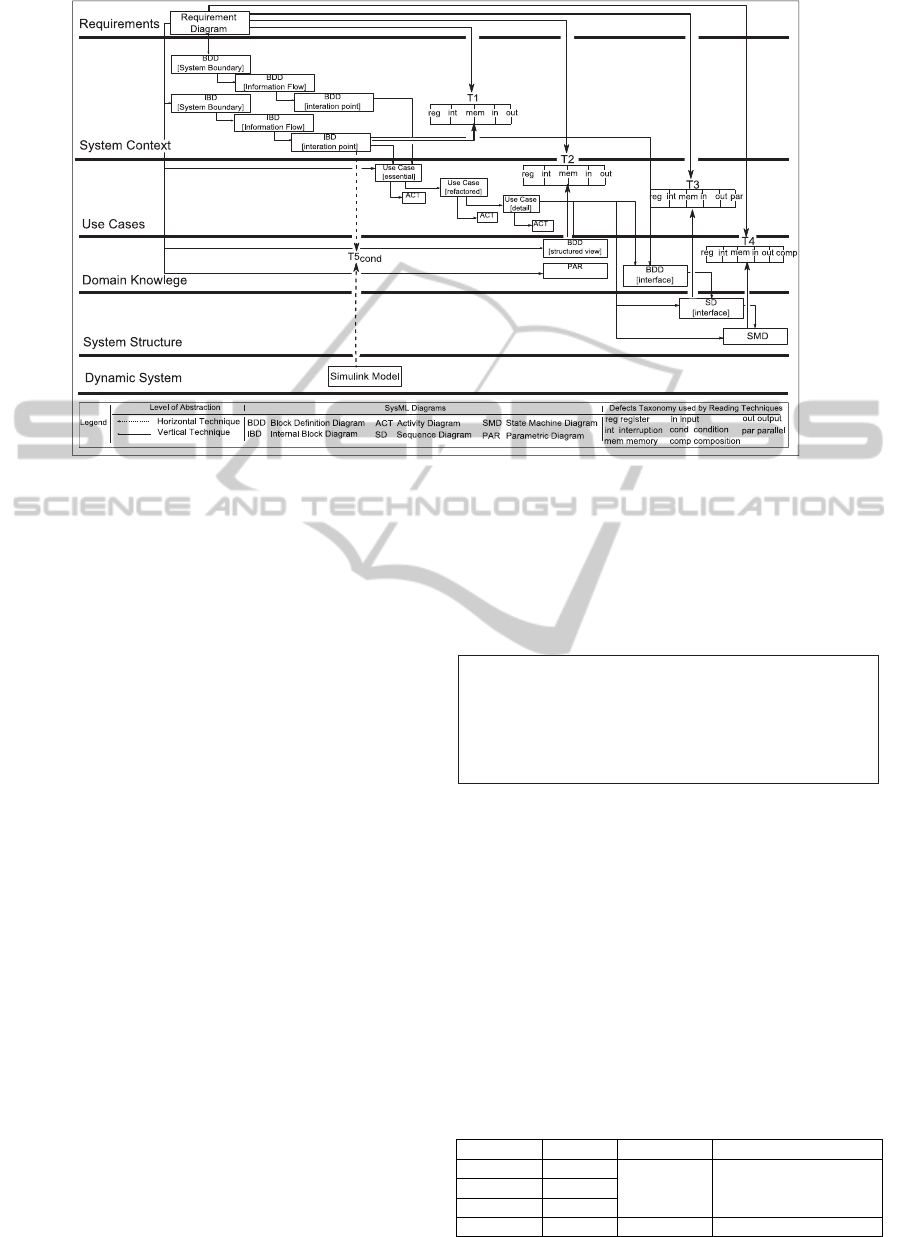
Figure 2: SYSMOD Process with Family of Reading Techniques.
SysML language formalism. As showed in part (C)
of Figures 3(a) and 3(b), the inspector should use the
stereotype «IEEESyntaxMissing» to mark syntactic
defects in the Requirements Diagram. Also, the
stereotypes «EssReq» and «TecReq» should be used
to mark blocks that contain essential requirements
and technical requirement, respectively, of the
SysML language. Analogously to the excerpt of
T4
comp
, showed in Figure 3, the other reading
techniques were constructed.
4 THE FEASIBILITY STUDY
According to Shull et al., (2001), a feasibility study
must be used to evaluate if a new process fulfilled
the overall goal for which it was created. Hence, in
this case, one of the reading techniques was
evaluated in the feasibility study aiming to verify if
it was worthwhile and provided usable results. In
this feasibility study, two questions were evaluated:
(Q1) The main question aimed to evaluate if the
Reading Technique T4
comp
is feasible to be used to
inspect SysML models in terms of effectiveness and
efficiency; and (Q2) The secondary question aimed
to evaluate if the format the technique is written
(Text or Flowchart) can interfere on the performance
for identifying defects (effectiveness and efficiency).
To answer these questions, we used a SysML model
of a hybrid gas/electric powered Sport Utility
Vehicle (HSUV). Some defects were inserted in this
model and an oracle version was created for the
comparison and summarization of the final results.
The study was based on the main steps suggested by
the Wohlin’s experimental process (Wohlin et al.,
2000) and they are presented in following
subsections. The main objective of the feasibility
study is presented as follows:
To answer the research question Q1 the hypotheses
1a and 1b were formulated as follows:
Hypothesis 1a:
H
0|1a
: T4
comp
.is not effective, i.e., there is not at least
50% of subjects that found at least 50% of defects.
H
1|1a
: T4
comp
.is effective, i.e., there is at least 50% of
subjects that found at least 50% of defects.
Hypothesis 1b:
H
0|1b
: T4
comp
is not efficient, i.e., there is not at least
50% of subjects that finished the inspection before 60
minutes.
H
1|1b
: T4
comp
is efficient, i.e., there is at least 50% of
subjects that finished the inspection before 60 minutes
Table 1: Specification of Hypothesis 1a.
#subjects #defects hypotheses description
>50% <50%
H
0|1a
T4
comp
is not feasible <50% <50%
<50% >50%
≥50% ≥50%
H
1
|
1a
T4
com
p
is feasible
Anal
y
ze the Reading Technique
T
4
comp
For the purpose of evaluation
With respect to effectiveness and efficiency
From the point of view of the developer
In the context of undergraduate students
ICEIS2014-16thInternationalConferenceonEnterpriseInformationSystems
236
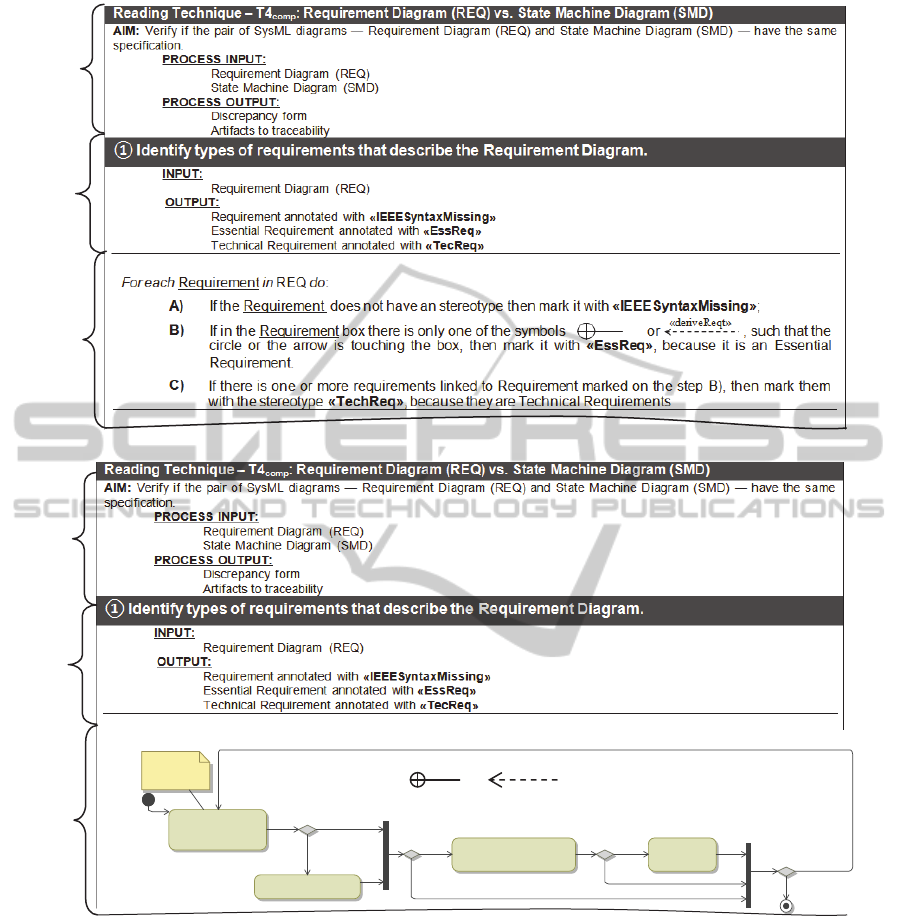
Figure 3: Reading Technique T4
comp
– (a) text notation; (b) flowchart notation.
To answer the research question Q2 the hypothesis
2a and hypothesis 2b were formulated as follows:
Hypothesis 2a:
H
0|2a
: There is no significant difference between the
effectiveness of T4
comp
(Text) and T4
comp
(Flowchart), i.e.,
Effectiveness [T4
comp
(Text)] = Effectiveness [T4
comp
(Flowchart)].
H
1|2a
: There is significant difference between the
effectiveness of T4
comp
(Text) and T4
comp
(Flowchart), i.e.,
Effectiveness [T4
comp
(Text)] ≠ Effectiveness [T4
comp
(Flowchart)]
Hypothesis 2b:
H
0|2b
: There is no significant difference between the
efficiency of T4
comp
(Text) and T4
comp
(Flowchart), i.e.,
Efficiency [T4
comp
(Text)] = Efficiency [T4
comp
(Flowchart)]
H
1|2b
: There is significant difference between the
efficiency of T4
comp
(Text) and T4
comp
(Flowchart), i.e.,
Efficiency[T4
comp
(Text)] ≠Efficiency[T4
comp
(Flowchart) ]
4.1 Variable Selection
The following independent and dependent variables
were considered in this study:
Independent Variable: the reading technique
T4
comp
is the independent variable in the context
of this study; besides, considering the question
Mark it (the requirement
identified in the Step A) with
<<EssReq>>
Mark it with
<<IEEESyntaxMissing>>
Step A -- Choose a
Requirement on the
Requirement Diagram
for Inspection
Mark them
with
<<TecReq>>
Are there any
non-inspected
requirements ?
Is there a
stereotype on
the
Requirement ?
Are there
requirements
linked to the
Requirement
marked with
<<EssReq>> ?
Use the
Requirement
Diagram
[yes]
[no]
[no]
[yes]
[no]
[yes] [yes]
Arethereintheboxonlyoneofthe
symbolsOR
suchthatthecircleorthearrowis
touchingthebox?
<<deriveReqt>>
(A)
(B)
(C)
(A)
(B)
(C)
(a)
(b)
VerificationandValidationActivitiesforEmbeddedSystems-AFeasibilityStudyonaReadingTechniqueforSysML
Models
237
Q2, T4
comp
is explored in text and diagram
formats.
Dependent Variable: the effectiveness and
efficiency are the dependent variables of this
study and they are defined as follows:
effectiveness
Number of detected defects per total of
discrepancies.
efficiency
Percentage of detected defects in relation to
inspection time.
After the variable definition, the subjects were
selected according to convenience and they were a
group of undergraduate students of the System
Engineering. Since it is a feasibility study with the
primary objective of determining whether the use of
the reading technique T4
comp
really helps to find
defects and the application time is feasible, all
subjects applied the same technique.
However, due to the secondary objective of
evaluating the format (notation) used to write the
technique, subjects were divided into two groups:
G1 applying T4
comp
(Text) and G2 applying
T4
comp
(Flowchart).
4.2 Descriptive Analysis of Research
Question Q1 and Q2
Table 2 summarizes the collected data of the study
and Figure 4 represents, via box-plot, the results of
effectiveness and efficiency. The results of the
feasibility study are presented in Table 2 as follows:
The first column depicts the treatment groups G1
and G2. The second column represents the subjects
through the identifiers S
1
to S
26
. The third column
shows the format the technique was used (text and
flowchart). In the fourth column it is indicated the
project used as example. The fifth column presents
the total number of defects identified by each
subject. The sixth column shows the time spent, in
minutes, by each subject during the inspection
activity. Finally, in the seventh and eighth columns
there are the effectiveness and efficiency,
respectively. At the bottom line of the table, average
values (μ) are presented.
Aiming to totalize defects found by each subject,
the discrepancy form was compared with an oracle
version previously developed by the authors. This
oracle had 20 defects and it was used to decide
whether discrepancies were real defects.
(ii) the second region corresponding to the second
and third quartiles, which represents 50% of data,
where (0.60 ≤ effectiveness ≤ 0.80); and (iii) the
third region corresponding to the fourth quartile,
which represents the greatest 25% of data, where
(0.80 <effectiveness ≤ 1.00). From second region it
can be observed that one half of subjects have got at
least 50% of effectiveness.
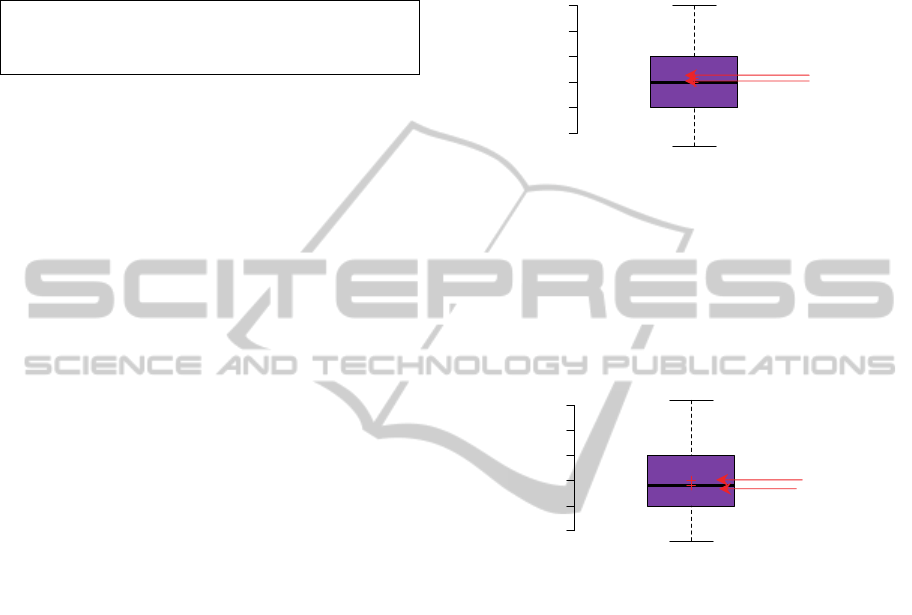
The box-plot of Figures 4 and 5 summarize the
results of effectiveness and efficiency, respectively.
Figure 4: Effectiveness of T4
comp.
According to Figure 4 the following regions can be
observed:
(i) the first region corresponding to the first
quartile, which represents 25% of data, where (0.45
≤ effectiveness< 0.60);
Figure 5: Efficiency of T4
comp
.
As the mean and median were very close — 0.72
and 0.70, respectively, we can consider that the data
distribution is symmetric, i.e., the effectiveness data
has a normal distribution. In relation to efficiency
(Figure 5), the data can be interpreted in a similar
way. It is important to notice that at least at least
50% of subjects detected from 0.25 to 0.35 defects
per minutes, on the other hand, them have spent
from 46 up to 48 minutes to conclude the inspection
— it has been calculated using the relation between
the effectiveness, efficiency and total number of
defects existing in the oracle (time spent =
20*effectiveness/efficiency).
In summary, in relation to effectiveness, we can
say that H
0|1a
can be rejected because more than 50%
of subjects have found more than 50% of defects.
The same occurs for efficiency, i.e., H
0|1b
can be
rejected because more than 50% of subjects have
spent less than one hour to finish the inspection
0.5 0.7 0.9
Reading Technique T4
Effectiveness
0.20 0.30 0.40
Reading Technique T4
Efficiency
Max=1.00
0.80
0.60
Mean=0.72
Min=0.45
Median=0.70
Max=0.46
Min=0.18
Mean=0.30
Median=0.29
0.35
0.25
ICEIS2014-16thInternationalConferenceonEnterpriseInformationSystems
238
Table 2: Collected data of the discrepancy form.
Group Subjects Reading Technique T4
comp
Defects
(a)
Time
(b)
Effectiveness
(a/20)
Efficiency
(a/b)
G1
S
1
Text
16 68 0.80 0.24
S
2
15 58 0.75 0.26
S
3
16 50 0.80 0.32
S
4
14 50 0.70 0.28
S
5
15 41 0.75 0.37
S
6
17 45 0.85 0.38
S
7
9 43 0.45 0.21
S
8
12 46 0.60 0.26
S
9
12 45 0.60 0.27
S
10
17 37 0.85 0.46
S
11
10 40 0.50 0.25
S
12
12 40 0.60 0.30
S
13
18 50 0.90 0.36
S
14
15 47 0.75 0.32
G1 Average (μ) 14.1 47.15 0.70 0.30
G2
S
15
Flowchart
14 73 0.70 0.19
S
16
14 65 0.70 0.22
S
17
17 62 0.85 0.27
S
18
15 60 0.75 0.25
S
19
12 55 0.60 0.22
S
20
20 49 1.00 0.43
S
21
11 60 0.55 0.18
S
22
18 50 0.90 0.36
S
23
14 46 0.70 0.30
S
24
11 35 0.55 0.31
S
25
14 40 0.70 0.35
S
26
14 45 0.70 0.31
G2 Average (μ) 14.5 53,33 0.72 0.28
Average (μ) of the G1 and G2 μ= 14 μ = 50 μ = 0.72 μ = 0.30
activity.
Based on Table 2, was calculated the total of the
G1 and G2 groups, separately, i.e., it was
summarized the means of groups using flowchart
and text reading technique. Applying F-test statistic
test, both failed to reveal a significant effect for the
G1 (p = 0.9853) and G2 group (p = 0.8290). In these
conditions, we must not reject null hypothesis
H
0|2a
and H
0|2b
.Finally, in both cases there was no
statistical significance. Therefore, we can say that
there is no significant difference in applying T4 in
text format or flowchart format.
5 CONCLUSIONS
This paper described, by means of a feasibility
study, the contribution of a reading technique
(T4
comp
) for detecting defects in SysML models.
Based on the results of this study, families of similar
techniques were defined taking into account some
SysML models generated through the application of
the software development process SYSMOD. The
goal of this family of techniques is to identify
defects throughout the process as soon as they occur.
This feasibility study has assessed the
effectiveness in detecting defects and the time
required to do this. As presented in this paper the
results indicated that more than 70% of the defects
were identified by at least 50% of the subjects.
Furthermore, the feasibility study allowed assessing
the format to write the techniques, suggesting that
there is no difference in the effectiveness and
efficiency for defects identification, independently
of the format used (text or flowchart). As this study
was performed as soon as the first technique was
defined, the other techniques were defined in a
similar way and nowadays other experimental
studies are being conducted to evaluate the other
techniques.
REFERENCES
Albaker, B. M., Rahim, N. A., 2010. Unmanned aircraft
collision detection and resolution: Concept and survey,
VerificationandValidationActivitiesforEmbeddedSystems-AFeasibilityStudyonaReadingTechniqueforSysML
Models
239

in: Industrial Electronics and Applications (ICIEA),
2010 the 5th IEEE Conference On. pp. 248–253.
Basili, V., Green, S., Laitenberger, O., Shull, F.,
Zelkowitz, M.V., 1996. The Empirical Investigation of
Perspective-Based Reading.
Daniels, D., 2011. Thoughts from the DO-178C
committee, in: System Safety, 2011 6th IET
International Conference On. pp. 1–7.
Denger, C., Ciolkowski, M., 2003. High Quality
Statecharts through Tailored, Perspective-Based
Inspections, in: EUROMICRO Conference. IEEE
Computer Society, Los Alamitos, CA, USA, p. 316.
Desai, M., 1998. UL 1998 - Software in Programmable
Components. Underwriters Laboratories Inc.,
Research Triangle Park, North Carolina Laura Elan.
Fagan, M.E., 1976. Design and Code Inspections to
Reduce Errors in Program Development. IBM Systems
Journal 15.
Graaf, B., Lormans, M., Toetenel, H., 2003. Embedded
software engineering: the state of the practice. IEEE
Software 20, 61– 69.
IEEE, 2010. IEEE Standard Classification for Software
Anomalies. IEEE Std 1044-2009 (Revision of IEEE
Std 1044-1993) 1–23.
Kitchenham, B., 2004. Procedures for Performing
Systematic Reviews. Technical Report TR/SE-0401.
Dep. of Computer Science, Keele University, UK.
Liggesmeyer, P., Trapp, M., 2009. Trends in Embedded
Software Engineering. IEEE Softw. 26, 19–25.
Marucci, R. A., Maldonado, J. C., Travassos, G. H. and
Fabbri, S. C. P. F., 2002. OORTs/ProDeS: Definição
de Técnicas de Leitura para um Processo de Software
Orientado a Objetos. in: 1st. Brazilian Symposium of
Software Quality. Gramado, Brazil.
OMG, 2010. OMG Systems Modeling Language : The
Official OMG SysML site (2010) [WWW Document].
OMG Systems Modeling Language : The Official
OMG SysML site. URL http://www.omgsysml.org/
(accessed 3.23.12).
OMG, 2011. UML Profile for MARTE: Modelling and
Analysis of Real-Time Embedded Systems v 1.1
(2011a) [WWW Document]. URL http://www.
omg.org/spec/MARTE/1.1 (accessed 3.23.12).
Pastor, O., Molina, J.C., 2007. Model-Driven Architecture
in Practice: A Software Production Environment
Based on Conceptual Modeling. Springer.
Pentti, H., Atte, H., 2002. Failure Mode and Effects
Analysis of software-based automation systems, in:
VTT Industrial Systems, STUK-YTO-TR 190. p. 190.
Petersen, K., Feldt, R., Mujtaba, S. and Mattsson, M.,
2008. Systematic Mapping Studies in Software
engineering. in: International Conference on
Evaluation and Assessment in Software Engineering
(EASE),. Bari, Italy, p. 71–80 Jun. 2008.
Shull, F., Carver, J., Travassos, G.H., 2001. An empirical
methodology for introducing software processes.
SIGSOFT Softw. Eng. Notes 26, 288–296.
Travassos, G.H., Shull, F., Carver, J., 2000. A Family of
Reading Techniques for OO Design Inspections.
UL, 1998. Underwriters Laboratories Standards [WWW
Document]. URL http://www.ul.com/ (accessed
9.30.13).
Weilkiens, T., 2008. Systems Engineering with
SysML/UML: Modeling, Analysis, Design. Morgan
Kaufmann Publishers Inc., San Francisco, CA, USA.
Wohlin, C., Runeson, P., Host, M., Ohlsson, C., Regnell,
B., Wesslén, A., 2000. Experimentation in Software
Engineering: an Introduction. Kluver Academic
Publishers.
ICEIS2014-16thInternationalConferenceonEnterpriseInformationSystems
240
