
r(e)flect
The Reflective Teaching Material about Energy, Behaviour and
Product Development
Magdalena Boork
1
, Susanne Engström
2
, Rebekah Olsen
3
and Therese Balksjö
3
1
SP Technical Research Institute of Sweden, Energy Technology, JTI, Box 7033, SE-750 07, Uppsala, Sweden
2
Department of Education, Uppsala University, Box 2136, SE-750 02, Uppsala, Sweden
3
Interactive Institute Swedish ICT, Energy Design, Portgatan 3, SE-633 42, Eskilstuna, Sweden
Keywords: Teaching Material, Reflection, Visualization Tool, Energy Use.
Abstract: r(e)flect is a tangible curriculum kit for students age 10-15 to reflect on energy behaviour and make better
informed choices about energy use. Along with web-based material, the kit includes a minicomputer, smart
plugs (sensors), and an electricity visualization tool especially designed to be used in the classroom to
conduct experiments and measurements, perform project work in product development, and increase the
understanding of the kWh concept. The curriculum is closely connected to the new Swedish National
curriculum and supplies the teachers with appropriate support for assessment of different skills. The project
was initiated in 2011 and a first version of the curriculum was tested and evaluated with students and
teachers. The feedback from this trial influenced the second iteration of the kit. The new version will be
tested in at least 20 schools during the spring of 2014 and this second phase will continue until 2015. The
physical r(e)flect material can be borrowed by teachers free of charge, and the web-based platform is open
and accessible to anyone.
1 INTRODUCTION
In Sweden, a new national curriculum including
course plans in physics and technology was
implemented in 2011. Additionally, a new grading
system with clearer criteria was introduced. In
physics and technology, the subject content and
what should be assessed are clearly stated. Within
physics, concepts such as energy and power should
be dealt with, students should develop an
understanding, but also be able to discuss, debate
and reflect upon their own energy use. Within
technology, students should get insight into the
design and development process and their creative
and entrepreneurial abilities should be assessed.
(Lgr, 2011) The curriculum further states the
importance of increased use of computers, not only
to search information, but also as tools for learning.
Traditionally, students experience difficulties
understanding the concepts of energy and power
(Duit, 2007; Solomon, 1992; Wiser and Amin,
2001). Teaching materials have been developed to
support teachers with this problem, both in terms of
conceptual understanding, and connections to
technology and sustainable development (Hobson,
2007; SEET, 2013; Connecticut Energy Education,
2013). Teaching strategies are often based on an
investigative approach where the students have the
chance to learn the subject content while they
understand the situations where the content has
value (Barab and Luheman, 2003). Although
teaching materials have been developed and
curriculums have changed, evaluations (for example
PISA, 2009) show that Swedish students still have
difficulties solving problems and applying their
knowledge in science. Therefore, there is still a need
for educational materials supporting teachers.
Teaching within design and product development
has increased over the last few years due to its
implementation in the curriculum. However, the
research and development of practical teaching
materials to assist the teaching and assessment of
such topics is still needed. (Ritz and Martin, 2013, p.
391):
“research needs included determining what knowledge
and abilities that designing actually involves, criteria
for evaluating novice designs, gaining conceptual
knowledge through designing, and teacher trainee
conceptions of design”
336
Boork M., Engström S., Olsen R. and Balksjö T..
r(e)flect - The Reflective Teaching Material about Energy, Behaviour and Product Development.
DOI: 10.5220/0004964503360341
In Proceedings of the 6th International Conference on Computer Supported Education (CSEDU-2014), pages 336-341
ISBN: 978-989-758-021-5
Copyright
c
2014 SCITEPRESS (Science and Technology Publications, Lda.)

The teaching material described in this article, which
among other things uses a computerized
visualization product for examinations in the
classroom and conceptual understanding, is based on
successful teaching strategies within the energy
field. Additionally, one part of the material focuses
on the product development process.
2 THEORETICAL
BACKGROUND
According to research in science and technology
education, students understand the scientific
concepts better when they are related to society and
technology issues (Bennett et al., 2003). Course
plans have also been developed to involve the
contextualization and focus on sustainable
development, which requires a change of teaching.
Research has shown that an increased degree of
exploration in different real contexts means that
students increasingly appreciate the subject content
(Barab and Luehmann, 2003). By teaching current
social issues, such as climate change while teaching
the traditional concepts of physics, Space (2007)
describes how the concepts become more useful,
relevant and interesting to the students. The students
start to ask questions about discussions they have
heard at home, seen on TV or read about in the
newspaper. Space also describes student-centred
discussions as successful as they develop an interest
in physics concepts that did not exist in earlier
education.
Research also shows that students become more
engaged by project-based, student-centred and
interdisciplinary education that is relevant to real life
(Blumenfeld et al., 1996; Barab et al., 2000).
Project-based teaching allows the students to work
with authentic problems and ask their own relevant
questions. This motivates them to find solutions they
can explain and argue for (Blumenfeld et al., 1996).
Studies show that visualization in varying shapes
makes it easier for students to understand abstract
concepts, especially when they can study different
phenomena and test hypotheses using visualization
tools (Kozma et al., 1996). While working with the
visualization tools, students should be given the
opportunity to express their own thoughts and allow
feedback from others. Additionally, a teacher should
be able to follow the thought process of a student
throughout the exercise. This should also occur in
situations that do not include written or oral
presentations (Lehtinen and Repo, 1996). If the
visualization provides a common view that explains
the problem, for example a screen shot that can be
studied and referred to, research shows that such
collaboration increases the meaningfulness
(Anderson et al., 2000).
The teaching material developed within this
project aims at providing the students with a
visualization tool to explore and understand, among
others, the concepts kilowatt-hour, power and
energy, through reality-based examinations. By
using the material the problems can be visualized
and analysed, measurements can be critically
examined, and various alternatives can be compared.
According to researchers in science and technology
education, students should be given the opportunity
to plan and conduct their own investigations, make
hypothesizes, search for information, and create
models, so they can develop these skills. Also
important are debates with peers and teachers, which
give students the chance to use their knowledge and
strategies to take a position and use well-formulated
arguments. (emphasized by for example Linn et al.,
2004).
The teaching material further allows the students
to discover the process of developing a digital
visualization tool. It lets them conduct reality-based
design tasks in which they work practically,
adopting professional roles. De Vries (2012) claims
that project work with reality-based tasks, combined
with computer modelling and visualization, works
well to integrate the subjects of physics, technology,
engineering science, and mathematics, and allows
further insights into engineering.
This teaching material is based on the idea that,
by starting from their own ideas and in interaction
with the digital teaching material, students and
teachers can together merge the ideas into coherent
chains of thoughts and investigations (characteristics
of a successful dialogic teaching, according to
Alexander, 2004). The material also provides the
students the opportunity to reflect upon their own
choices and its consequences, which are important
bases for understanding, in particular within
technology (Pitt, 2006). The material is also based
on the following specific strategies, favourable for
learning according to Dylan Wiliam (2007):
(1) learning objectives must be clearly defined,
understood and shared by everybody, (2) discussions
and tasks in the classroom need to show if and how
learning in class works, (3) teachers must give
students feedback that help them progress,
(4) teachers should in different ways use classmates
as resources to each other and (5) the teachers need
to make students own their own learning, for
example by self-evaluation and reflection.
r(e)flect-TheReflectiveTeachingMaterialaboutEnergy,BehaviourandProductDevelopment
337
3 MATERIAL DESCRIPTION
The teaching material r(e)flect aims at providing
students with increased awareness and tools to
reflect upon energy use and related behaviour. It is
not a normative material, claiming right and wrong
energy behaviour. The long-term goal is rather that
students, by using r(e)flect, acquire enough
knowledge about energy use and its consequences
that they can make better informed choices
regarding their own energy-related behaviour.
r(e)flect consists of four different parts, (1) the
visualization tool (e)lVis which clarifies the
concepts of energy and power and enables real-time
experiments, (2) the product development process,
(3) reality-based practical exercises and (4) the
WattVett challenge that enables self-reflection upon
energy behaviour. The new approach of this
teaching material is twofold:
1. the combination of the four parts in the same
material (there are other teaching materials
focusing on one or two at the time)
2. all parts following the common theme of energy
(where electricity visualization tools are a
recurring issue in all four parts)
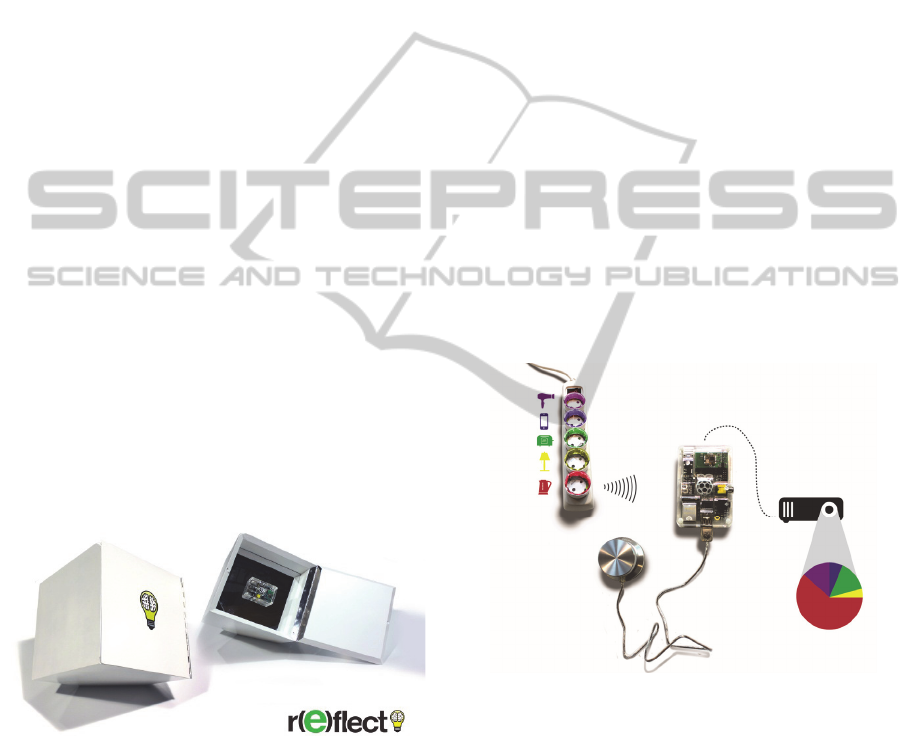
3.1 r(e)flect Box
The teaching material consists of a website (see
Section 3.3.) and a physical material, see Figure 1.
The packaging has been given an interesting and
exciting design to attract both students and teachers.
Figure 1: Parts of the teaching material r(e)flect are
packaged in an interesting and excitingly designed box.
When opening the lid, one finds a mirror with the
minicomputer of the electricity visualization tool
(see next section) mounted on it. The mirror both
symbolizes the self-reflection and ”to look oneself in
the eyes”. Apart from the computer-based
visualization tool, the physical box also includes
material for different activities connected to energy
use, concepts used in physics and technology as well
as developing skills in presentation and
argumentation. The box can be borrowed by
teachers free of charge.
3.2 Electricity Visualization Tool
(e)lVis
The electricity visualization tool (e)lVis (Figure 2) is
the main reason for a physical material. It aims at
enabling experiments with electrical appliances from
everyday life. It clarifies the concepts of energy and
power by real-time representation of electricity use.
Furthermore, electricity visualization tools are a
common theme throughout the teaching material. In
the material, the students can follow the product
development process that led to a similar
visualization product. The two solutions, built on
similar systems of components, are compared.
(e)lVis has been designed to stand long-term use in
the school environment, while the other product
suits workplace applications. This also provides the
students with inspiration to their own project work.
(e)lVis is composed of a set of smart plugs
(sensors), a minicomputer, and a knob. Although the
hardware is made of commercial products, the
software was custom developed for this project.
Figure 2: Illustration of a setup with the visualization tool
(e)lVis. The tool comprises five smart plugs, a knob and a
minicomputer. The minicomputer is connected to the
classroom projector to show the measurement and result,
i.e. a pie chart where each colour represents a device.
By locating one of the smart plugs between an
electrical device and the power outlet the electricity
use of appliances can be measured. Each plug is
associated with a particular colour. The total amount
of energy to be used within the experiment is set
with the knob. As the measurement starts the
electricity use of each connected device can be
followed by its colour in a pie chart. The
minicomputer is connected to the classroom
CSEDU2014-6thInternationalConferenceonComputerSupportedEducation
338
projector to show the real-time measurement and pie
chart to the students on a screen or the wall. When
the full amount of energy has been used, the
proportion and number of watt-hours used by each
appliance, along with the duration of the complete
measurement will be shown, see Figure 2.
3.3 r(e)flect Website
All material included in the box, besides the
visualization tool, can be downloaded from the
website. This makes r(e)flect widely available to
Swedish teachers. The website also provides
instructional videos for teachers and engaging
informational videos for the students. Throughout
the website teachers can find hints, or how to
sections, for how the material can be used and linked
to the traditional classroom learning. The website is
under development, but some screenshots from the
current website are shown in Figure 3 and Figure 4.
Figure 3: Front page of r(e)flect website (under
development).
Figure 4: Website page showing the four parts of the
teaching material (under development).
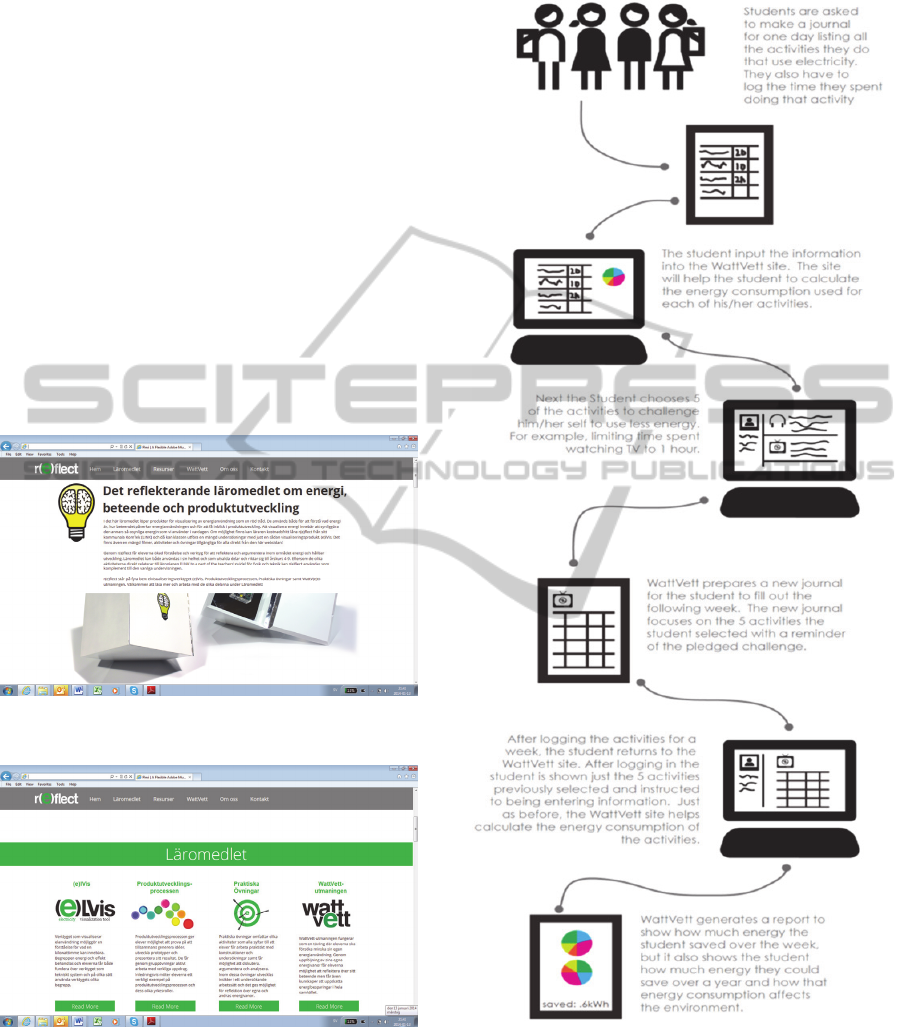
3.4 WattVett Challenge
An important feature found on the website is the
WattVett challenge. It has not yet been
implemented, but the concept and how students are
supposed to work with it is described in Figure 5.
Figure 5: The students’ work flow with the WattVett
challenge.
In the WattVett challenge, students are invited to
challenge themselves or other students and classes.
The aim is to encourage self-reflection on the energy
behaviour, but also to encourage an energy saving
behaviour. Students report their energy use by
r(e)flect-TheReflectiveTeachingMaterialaboutEnergy,BehaviourandProductDevelopment
339

making an energy diary. Additionally, the self-
reporting system can be used to follow up the energy
saving potential connected to the teaching material.
4 PRELIMINARY RESULTS
The teaching material was evaluated in two different
schools and with totally eight teachers. About 150
students tested different parts of the material. By
using short questionnaires, observations and a few
interviews we collected feedback and response on
specific activities. All eight teachers appreciated the
material because it generated interest from the
students. Teachers commented in both interviews
and questionnaires that the material had a "nice and
professional" feel and that it contributes to an
entrepreneurial approach, that it helps visualize the
students' own electricity usage, and that it can
contextualize physics and technology. Teachers
appreciate that the activities are linked to curriculum
and assessment criteria, and enables cross-curricular
elements. All teachers further stress the importance
of a teaching material that contains "everything",
that clearly describes what needs to be prepared and
sourced prior to an activity, e.g. current and relevant
links to reports, websites, etc. and reproducible data,
forms, etc. These resources are of great value
because they are provided within the material.
Students aged 10-15 have used the material in
the ordinary physics and technology education. In
total, 50 students filled in a feedback questionnaire,
another 50 students were observed and six students
were interviewed. In all 50 questionnaires the
students expressed excitement that "something
unusual" happens with a device in the classroom and
that they can see the measurement in progress and in
real time. Teachers that were interviewed told us that
the students can then correlate the measurement to
the use of their own electrical appliances.
In the interviews, all eight teachers further
expressed appreciation for the tool's measurement of
a real situation that can be followed here and now,
but also that the students could follow the electricity
usage of different products. They can initially guess
which one uses the most electricity and then receive
a result directly. Subsequent discussion of the
concept of power is relevant and highlights the need
to consider how long a device is in use.
About 50 of the students in the trial were part of
a debate, which proved to be an excellent activity in
middle school, even though two teachers expressed
concern with the activity in interviews. Observation
of the debate did, however, highlight that some basic
knowledge must be substantiated. Within the debate
students must take a stand for different energy
sources and use evidence-based arguments. The
debates showed the importance for students to have
knowledge about, for example, how electricity is
generated by generators and solar applications. The
debate also highlighted the importance of the teacher
as moderator, guiding the discussion, spreading the
word and picking up interesting threads.
About 50 students in lower secondary school
tested the "electricity diary" within a homework
assignment. The students first measured the
electricity use of some "regular" devices of their
own choice in the classroom. They reflected upon
their everyday life and use of electrical appliances.
As homework, they went home and noted their use
of electricity during the day, talked to other family
members, reflected on the effects on the electricity
bills, and estimated the time and measurement of
electricity use and costs. In interviews with six
students, but also when observing discussions in the
classroom, we found that the students, within their
reflections, were given opportunities to reflect on
aspects they would otherwise never have done.
Moreover, in interviews, two teachers said that
the activities contributed to practical lessons for the
students, such as realizing that the time aspect plays
an important role for the electricity use. The
exercises made the concepts power and watt visible
to the students, and made them realize that both
power and duration has to be taken into account
when discussing total electricity use.
In interviews, all eight teachers expressed
appreciation for teaching materials with the
possibility to make power usage visible to students.
They also emphasized the importance of a teaching
material that exemplifies idea generation and
product development, something that they lacked.
5 FUTURE WORK
We will continue developing the teaching material
based on the initial evaluation. Twenty complete
teaching kits have already been produced and
distributed to schools.
In March 2014, we will let about 10 classes (i.e.
around 250 students aged 10-15) and 10 teachers use
and evaluate the teaching material. Students’
perception of the material will be in demand, and
their knowledge of energy will be tested after certain
activities. Feedback will be collected through
questionnaires, observations and interviews. The
teachers’ views will be sought through
CSEDU2014-6thInternationalConferenceonComputerSupportedEducation
340

questionnaires. Other students and teachers will also
use the material during this period, but they will not
be part of the formal evaluation. The evaluation will
be based on methods described in Robson (2011).
At the end of the project, in 2015, both the web-
based platform and the physical teaching material
will be in their final design.
ACKNOWLEDGEMENTS
The project is funded by the Swedish Society for
Nature Conservation (Naturskyddsföreningen)
thanks to the sale of electricity labelled “good
environmental choice”.
REFERENCES
Alexander, R. J. (Red.). (2004). Towards Dialogic
Teaching: rethinking classroom talk. North Yorkshire:
Dialogos.
Anderson, A., Cheyne, W., Foot, H., Howe, C. Low, J. &
Tolmie, A. (2000). Computer support for peer-based
methodology tutorials. Journal of Computer Assisted
Learning, 16, 41–53.
Barab, S.A., Hay, K. E., Barnett, M.G., & Keating, T.
(2000). Virtual solar system project: Building
understanding through model building. Journal of
Research in Science Teaching, 37(7), 719-756.
Barab, S. A., & Luehmann, A. L. (2003). Building
sustainable science curriculum: Acknowledging and
accomodating local adaption. Science Education,
87(4), 454-467.
Bennett, J., Hogarth, S., & Lubben, F. (2003). A
systematic review of the effects of contextbased and
Science-Technology-Society (STS) approaches in the
teaching of secondary science: Review summary.
University of York, UK.
Blumenfeld, P. C. et al. (1996). Learning with peers: From
small group cooperation to collaborative communities.
Educational Researcher 25(8), 37 – 40.
Connecticut Energy Education (2013), The Institute for
Sustainable Energy. Retrieved 2013 from Web site:
http://www.ctenergyeducation.com/
Duit, R. (2007). Bibliography - STCSE (Students' and
Teachers' Conceptions and Science Education). Kiel:
IPN. Retrieved 2013 from Web site:
http://www.ipn.unikiel.de/aktuell/stcse/stcse.html.
Hobson, A. (2007). Resource Letter PSEn-1: Physics and
society: Energy. American Journal of Physics. 75 (4),
294 - 308.
Kozma, R. B., Russell, J., Jones, T., Marx, N. & Davis, J.
(1996). The use of multiple, linked representations to
facilitate science understanding. I: S. Vosniadou, E.
De Corte, R. Glaser & H. Mandl (red.) International
Perspectives on the Design of Technology-Supported
Learning Environments. NJ: Erlbaum.
Lehtinen, E. & Repo, S. (1996). Activity, social
interaction, and reflective abstraction: learning
advanced mathematical concepts in computer-
environment. I: S. Vosniadou, E. DeCorte, R. Glaser
& H. Mandl (red.) International perspectives on the
psychological foundations of technology-based
learning environments (ss. 105–128). Hillsdale, NJ:
Lawrence Erlbaum.
Lgr, 2011. Curriculum for the compulsory school,
preschool class and the recreation centre 2011.
http://www.skolverket.se/om-skolverket/andra-sprak-
och-lattlast/in-english/publications.
Linn, M. C., Davis, E. A., & Bell, P. (2004). Internet
Environments for Science Education. New Jersey:
Lawrence Erlbaum Associates, Inc. Publischers.
PISA (2009) http://www.oecd.org/ Comments by
Jacobsson, Oscarsson, Karlsson: retrieved 2013 from
Web site:
http://www.skolaochsamhalle.se/flode/skola/jacobsson
oscarssonkarlsson-blir-svenska-elever-allt-samre-i-
naturvetenskap/
Pitt, J. C. (2006). Human beings as artifacts. I J.R. Dakers
(Red.),
Defining technology literacy: Towards an
epistemological framework. (s.133-144). New York:
Palgrave Macmillan.
Ritz, J. & Martin, G., 2013. Research Needs for
Technology Education: Highlights of a Preliminary
Analysis. In PATT27 Technology Education for the
Future: A Play on Sustainability. Editor P J Williams
ISBN 978-0-9922497-2-4 New Zeeland: University of
Waikato. Retrieved 2013 from Web site:
http://www.iteea.org/Conference/PATT/PATT27/PAT
T27proceedingsNZDec2013.pdf.
Robson, Colin (2011). Real World Research 3e. ISBN
978-1-4051-82409. UK: John Wiley & Sons.
SEET. The Institute for Sustainable Energy SEET--
Sustainable Energy Instructional Materials. Retrieved
2013 from Web site: https://ateec.org/professional-
development/workshops-institutes/sustainable-energy-
education-training-seet/next-workshop/
Solomon, J. (1992). Getting to know about Energy in
school and society. London: Taylor & Francis Group.
Space, W. (2007). Climate Physics. Using basic physics
concepts to teach about climate change. The Science
Teacher. 74 (6), 44 – 47.
Wiliam, D. (2007). Research Brief: Five “Key Strategies”
for Effective Formative Assessment. Reston: The
National Council of Teachers of Mathematics.
Wiser, M., & Amin, T. (2001). Is heat hot? Inducing
conceptual change by integrating everyday and
scientific perspectives on thermal phenomena.
Learning and Instruction, 11, 331-355.
Vries, M. J. de (2012), ‘Teaching for Scientific and
Technological Literacy: An International
Comparison’, in: Pfenning, U. and Renn. O. (Hrsg.),
Wissenschafts- und Technikbildung auf dem
Prüfstand. Baden-Baden: Nomos Verlag, 93-110.
r(e)flect-TheReflectiveTeachingMaterialaboutEnergy,BehaviourandProductDevelopment
341
