
Providing Water Parameters Monitoring Data through Interoperable
Web Services
Anca Hangan
1
, Lucia Vacariu
1
, Octavian Cret
1
and Marian Muste
2
1
Computer Science Department, Technical University of Cluj Napoca, Cluj Napoca, Romania
2
IIHR-Hydroscience & Engineering, University of Iowa, Iowa City, U.S.A.
Keywords: Water Resources Management, Water Parameters, Remote Monitoring, Data Provision, Web Services.
Abstract: The paper describes the design and development of a water parameters monitoring system for rivers. The
system exposes a set of web services that can act as support for decision making in pollution control or as
data provider for a wide range of informational, educational or research applications. A prototype based on
the proposed system design was build and experiments were made on Somes River in Romania. Our
prototype contains web based and mobile applications that provide access to the measurements made by the
sensors and to the historical information as well.
1 INTRODUCTION
Two methods are widely used to evaluate the quality
of water through water parameters monitoring: the
traditional manual method and the automatic
continuous monitoring with stations on the river
shore. Both methods imply large costs: personnel
and laboratory expenses on one side, development
expenses and environmental impact on the other side
(Jiang, et al, 2009). The automatic continuous
monitoring systems are preferred nowadays
(Gunatilaka, Moscetta, Sanfilippo, 2007).
Water management cyber-infrastructure needs to
keep up with the advances in computational and
communications technologies (McDonnell, 2008).
New solutions need to be able to combine complex
data from many heterogeneous resources (Muste, et
al, 2012).
Automatic continuous monitoring of water
parameters can be done by specialized stations
placed on the river shore or, more recently, by
wireless sensor networks (WSNs). Even though
water shore stations usually provide measurements
for a large variety of water parameters, there are
very large development and maintenance costs. On
the other hand, WSNs can monitor water quality
parameters through the cooperation of a large
amount of heterogeneous sensors with reduced
environmental and financial costs. For this reason, in
the last years, there has been an important research
interest towards the development of monitoring
systems that use WSNs (Wang, et al, 2010).
A very important part of water parameters
monitoring is constituted by high frequency water
quality monitoring and estimation. It is impossible to
sample all the potential pollutants in a watershed. An
alternative solution consists of monitoring only a set
of parameters called surrogates. Then, using
mathematical equations, the measured values
obtained from the surrogate sensors are converted
into estimates of the variables of interest
(Horsburgh, et al, 2010).
There are significant efforts made worldwide
towards establishing standards for water quality
monitoring. Knowing that there is a huge amount of
information that should be handled as public
information, one of the main concerns in the
heterogeneous hydro-world information is to comply
with standards.
In the European Union, the Water Framework
Directive (WFD) establishes, among others, a guide
for monitoring the quality elements of rivers, to
assure the interoperability between different
platforms (Water Framework Directive, 2003). The
guide presents the appropriate selection of quality
elements and parameters for rivers, lakes,
transitional waters and coastal waters to support the
implementation of the WFD and additional
recommended quality elements, which have been
identified by Member States for that particular water
body type. To achieve the WFD targets, it is
684
Hangan A., Vacariu L., Cret O. and Muste M..
Providing Water Parameters Monitoring Data through Interoperable Web Services.
DOI: 10.5220/0005048006840690
In Proceedings of the 11th International Conference on Informatics in Control, Automation and Robotics (ICINCO-2014), pages 684-690
ISBN: 978-989-758-039-0
Copyright
c
2014 SCITEPRESS (Science and Technology Publications, Lda.)

necessary to develop some cost-effective
instrumentation using advanced technology and
shifting to automation to reduce overall analytical
costs. The actual growing demand is requesting
more and more that water quality be measured
continuously and in real time. Due to
interoperability requirements, new platforms must
be compliant with the INSPIRE Directive of the
European Union (INSPIRE, 2014) and with the
OGC Sensor Observation Service Standard (Vitolo,
Buytaert, Reusser, 2012).
This work describes the design and development
of a water parameters monitoring system for rivers.
Our system exposes a set of web services that can
act as support for decision making in pollution
control or as data provider for a wide range of
informational, educational or research applications.
One of our main concerns is to comply with the
European Union standards for water quality
monitoring and spatial data exchange. This will
assure the interoperability with other platforms that
are compliant with the INSPIRE Directive of the
European Union and with the OGC Sensor
Observation Service Standard. Furthermore, we will
present the implementation of a prototype based on
the proposed system design. Experiments were made
on Somes River in Romania. Our prototype contains
web based and mobile applications that provide
access to the measurements made by the sensors and
to the historical information as well. Integrating
recent IT technology has increased the quality of the
monitoring, communications and information
presentation.
The paper is structured as follows: Section 2
shows the research context of water management in
Romania. Section 3 describes the Cyberwater
monitoring system. In section 4 the service-based
architecture of the monitoring data provision is
presented in detail. Section 5 presents two prototype
systems that we developed on top of the proposed
architecture. Section 6 presents conclusions and
research ideas for future work.
2 RESEARCH CONTEXT
In Romania, water parameters monitoring is mostly
done using the traditional method, which implies
manual sampling and laboratory analysis, and with
specialized continuous monitoring stations placed on
the water shore. As floods and river pollution appear
frequently, there is an obvious need for more
advanced water management practices and tools
(Tacheci, et al, 2012). There are projects that follow
the enhancement of the Romanian hydrologic
observation network and the application of modern
modeling tools for the improvement of water
resources management (Mocanu, et al, 2013).
However, there are very few similar projects and
there is need for initiative in the direction of
continuous real-time water parameters monitoring in
Romania. There is also an imperative need to
comply with European Union standards and
directives.
In this context, Cyberwater is a Romanian
project that has as main objective the development
of an e-platform that uses advanced computational
and communication technology for managing water
and land resources in a sustainable and integrative
manner, focused on pollution phenomena in rivers
(Ciolofan, Mocanu, Ionita, 2013).
Our objective as part of Cyberwater project is to
develop a water monitoring system that will be one
of the main components of the e-platform. The
monitoring system gathers data from sensors placed
on the river shore and acts as a data provider for
informational applications and as support for
decision making in pollution control systems. It is
important to store and provide the data in a standard
form, to insure the interoperability with other water
management or informational systems.
Figure 1 depicts the general architecture of the
Cyberwater platform.
Figure 1: Cyberwater general architecture.
Our monitoring and data provider system places
itself on the base layer of the Cyberwater general
Sensors Database
Data History
Monitoring
Acquisition Processing Data Storage &Provision
Decision System
Alert Prevent Inform
Services
Users
ProvidingWaterParametersMonitoringDatathroughInteroperableWebServices
685

architecture. Data received from the sensors is
further used by the decision system, which offers
support for the decision making process of the water
management authorities, and by other information
services exposed by the platform. Cyberwater
platform is a service-oriented platform. The web
services will be provided by both the decision
system and by the monitoring system.
3 THE MONITORING SYSTEM
In this section, we will focus on describing the
service-based architecture of the monitoring system.
As the main feature of Cyberwater is to detect
pollution in rivers, one of our objectives is to
facilitate the measurement, acquisition and storage
of water parameters, which can indicate this type of
phenomenon. Water parameters such as temperature,
pH, conductivity, and others are measured by
sensors submerged in the river.
On the river shore, there is need for a local data
acquisition sub-system (datalogger) that gathers data
from all sensors in the area. To determine the
architecture of the local data acquisition sub-system,
the measurement setup has to be known. We
consider two situations:
1. The measurements are made in a small
area of the river (e.g. the distance between the
sensors is less than 500 meters);
2. The distance between two subsequent
measurement locations is larger than 1km (e.g. a
measurement is made every 10 kilometers).
To implement the local acquisition sub-system
we use National Instruments wireless solution (NI
WSN) that allows integrating wired & wireless
measurements, accessing remote data with secure
web services and communicating with third-party
wireless sensors (WSN NI, 2014).
In the first situation, several wireless nodes can
gather data from the sensors. Because the nodes are
relatively close to each other, they all send their data
to a gateway node that handles long distance
communication. Because the gateway collects and
stores data from the entire area, local decision
making is possible.
In the second situation, local nodes have to
handle both data acquisition and long distance
communication. Communication between
subsequent nodes and local decision making based
on combined sensor data is not possible because of
the long distance.
The local data acquisition sub-system sends the
data collected by the sensors to an application that
stores it. A feasible solution for handling long
distance communication from the river shore is
GSM communication. The local gateway is
connected to a GSM provider. Gathered sensor data
are transmitted to a GSM data storage service that
will store the sensor data until a software component
connected to the Internet gets the data from storage
service, processes them (e.g. computes water
parameter values from surrogates, transforms raw
values received from sensors to required formats)
and sends them to a database, using an XML format.
Data from the database can be accessed through
software services by remote monitoring applications
connected to the Internet. Stored data are available
to other applications that are part of the Cyberwater
platform through web-services.
The monitoring system is depicted in Figure 2, at
the base of the proposed service-base architecture of
the monitoring data provision system.
4 THE SERVICE-BASED
ARCHITECTURE
To make the data gathered by the monitoring system
available to other users, we propose a service-based
architecture.
We expose the monitoring data through web
services that can act as support for decision making
processes in pollution control or as data provider for
a wide range of informational, educational or
research applications.
One of the main requirements of this architecture
is the interoperability. Because Romania is a
member of the European Union, we have to comply
with the INSPIRE Directive for keeping
hydrographic data. The INSPIRE Directive provides
data models specifications for spatial data, including
hydrographic data. We use a sub-set of the
Hydrography Model provided by INSPIRE, mainly
the Hydro-Base and Hydro-Network Application
Schemas (INSPIRE, 2014) to keep data about the
monitored river basin.
By hydrographic data we understand: the river
identifier, its geographical name, the river topology
represented as a network with nodes and
watercourse links, its localization, its flow direction
and its length.
Moreover, to manage sensor data in an
interoperable way, we use OGC Sensor Observation
System Standard (SOS). The SOS Standard provides
specifications for a web service interface that allows
querying for sensor observations (measured values)
ICINCO2014-11thInternationalConferenceonInformaticsinControl,AutomationandRobotics
686
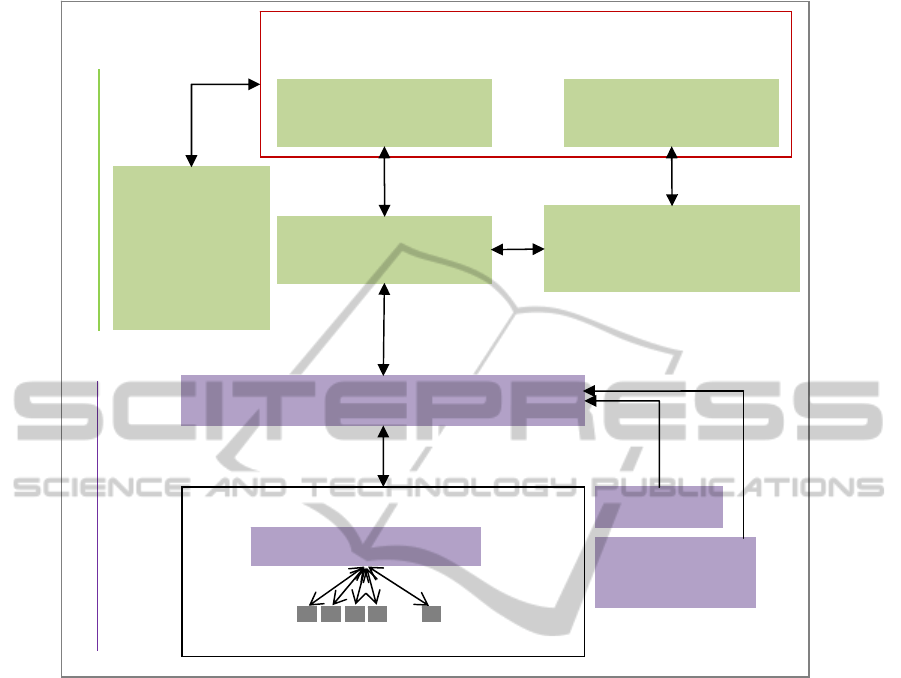
Figure 2: The service-based architecture of the monitoring data provision system.
and provides the means for registering sensors and
for recording the sensors’ readings (Sensor
Observation Service, 2014). The standard requests
accepted by the SOS component that we
implemented are the following: query observation,
insert observation, register sensor, remove sensor.
Figure 2 shows the service-based architecture of
the monitoring data provision system. At the base of
this architecture is the water parameter monitoring
system. The monitoring system includes one or more
WSNs that gather data from the water shore sensors
and send it to the data processing component.
The data processing component receives data
from WSNs, but it is also possible to receive data
from other (external) sources that may be measured
or surrogate values. Data can be in different formats
(CSV, XML and others). The data processing
component processes data and puts them into a
uniform XML format. Data will be then sent to the
Sensor Observation Service through the translation
service that will form standard insert requests for the
SOS component. The SOS component will store the
data.
The translation service component receives not
only data from the data processing component, but
also information about the sensors, in order to
generate requests for registering (or unregistering)
sensors with the SOS. This component receives, as
well, requests from other applications or information
systems that need to use the monitoring data that we
provide. It is possible that these requests are not
SOS compliant. The non-SOS compliant requests
will be received and translated into SOS compliant
requests by the translation component. Through this
component, monitoring data will be provided in an
XML format. SOS compliant clients will pass the
requests directly to the SOS component.
The proposed architecture insures
interoperability with SOS compliant systems as well
as with INSPIRE compliant systems in the
hydrographic domain. Moreover, the monitoring
data can be requested by applications that are not
Information services (Visualization, Statistics and Pollution
Information)
WSN
LabView
Radio
….
WSN Nodes, Sensors
WSN Gatewa
y
Data processing
GSM
LabView
Surrogates
Other data
sources
XML,CSV
WaterParametersMonitoring
Translation Service
(XML<->SOS)
XML
MonitoringDataProvisioning
Sensor Observation Service
(SOS)
INSPIRE
Compliant Data
Service
(Hydrographic
data,
GIS data)
SOS
Applications
(Web, Mobile)
SOS Clients
XML
SOS
ProvidingWaterParametersMonitoringDatathroughInteroperableWebServices
687
SOS-compliant.
5 THE PROTOTYPE SYSTEMS
To prove the validity of the proposed architecture,
we implemented it in two prototype systems. The
preliminary measurements were made on Somes
River on a 1 km distance, in three points.
5.1 System for Pollution Detection
in Somes River
We developed a prototype system for pollution
detection in Somes River using the proposed
architecture as basis. Data acquisition is made by a
WSN located in the point where the river enters the
city. The water parameters that we follow are:
temperature, pH, specific conductivity, turbidity,
dissolved oxygen and discharge. Using these values
as surrogates we can determine a series of water
quality constituents such as: alkalinity, suspended
solids or chloride (Horsburgh, et al, 2010).
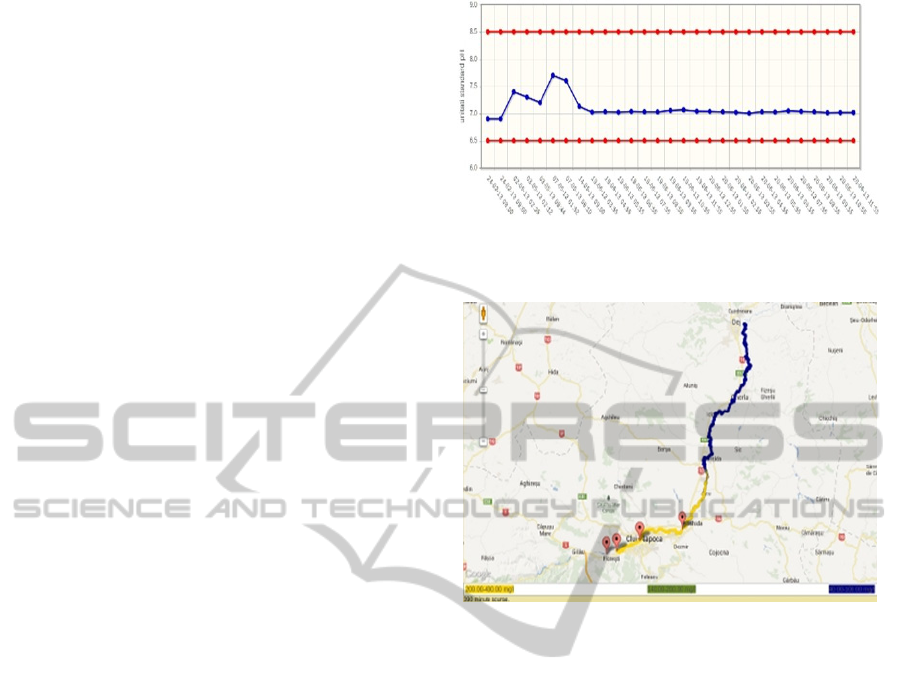
The system monitors the water parameters over
time. Through a web interface, the user can follow
the last measured water parameter values or can
view a chart containing several readings over a
period of time (Figure 3). If the parameters are
outside some specified intervals, a pollution
situation is detected and signaled.
When pollution is detected, the user can start a
simulation that will provide as result an estimated
propagation scenario for the pollutant in the river
starting from the location of the sensors. The
pollutant propagation estimation can be viewed in
the same web interface on a map provided by
Google Maps. To highlight the polluted segments of
the river, a color code is used, as seen in Figure 4. In
order to be able to estimate the pollutant propagation
we used the model developed by (Ani, et al, 2010).
The mathematical model was computed for a
segment of Somes River.
The prototype system for pollution detection that
we developed uses an INSPIRE Hydrographic data
model to keep information about the monitored
segment of Somes River.
Because the INSPIRE and the propagation
model’s coordinate systems didn’t match, we needed
to make some coordinates transformations to be able
to use the propagation model in (Ani, et al, 2010).
The system is not SOS compatible. Therefore, to
receive the measured values from sensors, it has to
make requests to the translation service component.
Figure 3: Chart containing several readings of water pH
value.
Figure 4: The pollutant propagation simulation viewed in
the web interface.
5.2 Mobile Water Parameters
Information System
The second prototype is a mobile water parameters
information system implemented on Android OS.
We developed it on top of the proposed service-
based monitoring data provision architecture. Like in
the previous example, this system uses data provided
by the monitoring system set up on a segment of
Somes River. The mobile application includes a
SOS standard client component that is able to
request data from the SOS component of the
monitoring data provision architecture and from any
other SOS server that provides similar data.
The main features of the mobile water
parameters information system are the following:
Temporary storage of the values retrieved
from the SOS server. To obtain a better
response time, responses from the SOS server
are cached for a predefined period of time.
Retrieve information from more than one SOS
server at the same time.
Visualization of sensor location and sensor
data. Users are able to see on a map provided
ICINCO2014-11thInternationalConferenceonInformaticsinControl,AutomationandRobotics
688
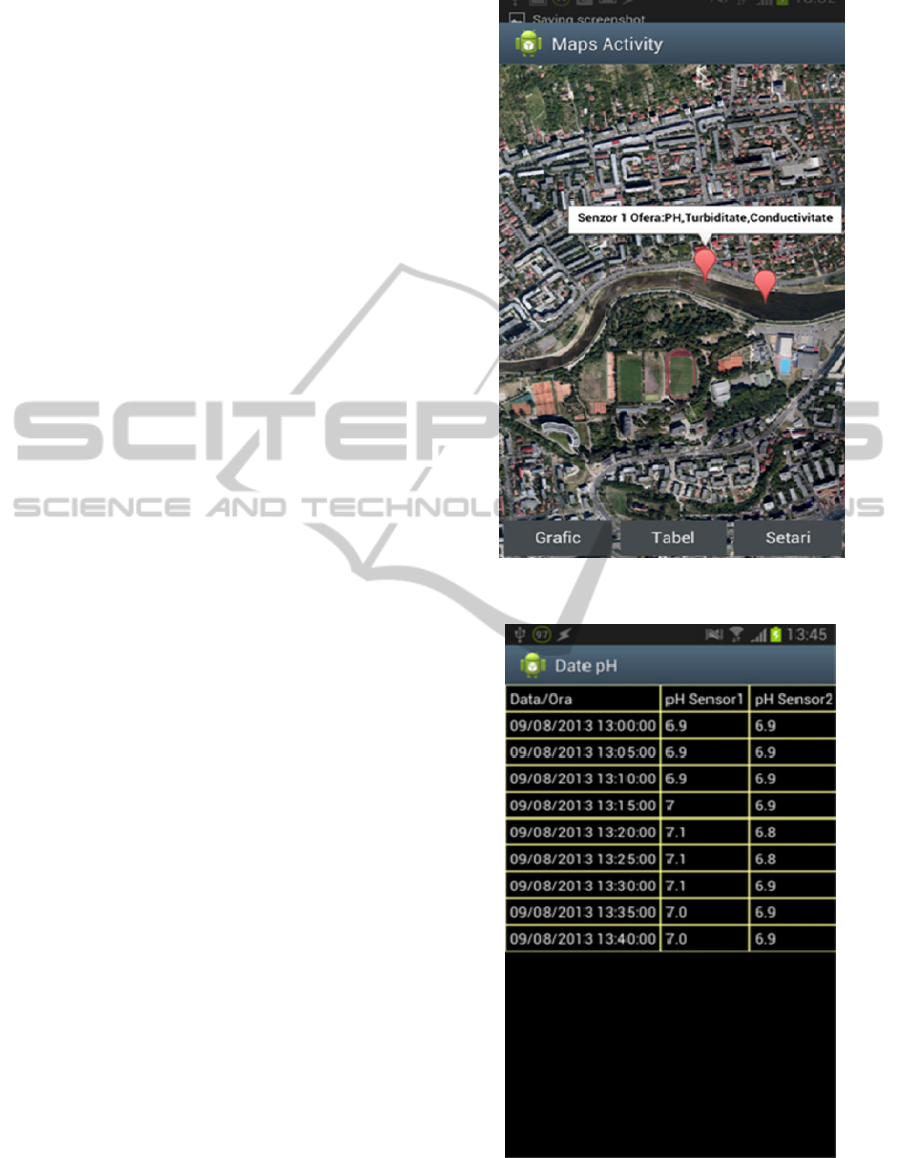
by Google Maps the location of sensors and
the measured values associated with the
sensors as seen in Figure 5.
Charts and tables with the water parameters
measurements over time as seen in Figures 6
and 7.
Support for spatial and temporal filters applied
on the measurements provided by the sensors.
The application is able to apply filters on the
requested SOS observations and to provide the
user information from a specific time interval
or from a specific geographical area.
User notification. The user is notified if the
water parameters are outside regular value
intervals (if pollution is detected).
Adaptation to the performance capabilities
(resource availability) of the mobile device.
The standard SOS client is an important
component of the system. The SOS operations
available are the following:
GetCapabilities – get metadata and detailed
information about the operations provided by
a SOS server.
DescribeSensor – provides metadata about the
registered sensors.
GetObservation – allows access to sensor
observations; allows observations filtering.
The observations can be filtered based on the
following parameters:
Sensors that provide the observations.
Time interval.
Observed phenomenon.
Geographical region (location of sensors).
The SOS client component can be extended with
the implementation of other operations specified by
the SOS standard.
6 CONCLUSION
In this paper, we proposed a service-based
architecture for provisioning water parameters
measured by a monitoring system implemented with
WSN technology. The services that expose the
hydrographic and monitoring data are compliant
with INSPIRE regulations for Hydrography data
models and with SOS standard for sensor data.
As proof of concept, we developed two
applications on top of the proposed data
provisioning architecture. These applications use
hidrographic and monitoring data and allow the
users to view information about the quality of water
in Somes River.
Figure 5: Location of sensors on Google Maps.
Figure 6: Table with pH readings during a time interval
(one hour).
ProvidingWaterParametersMonitoringDatathroughInteroperableWebServices
689
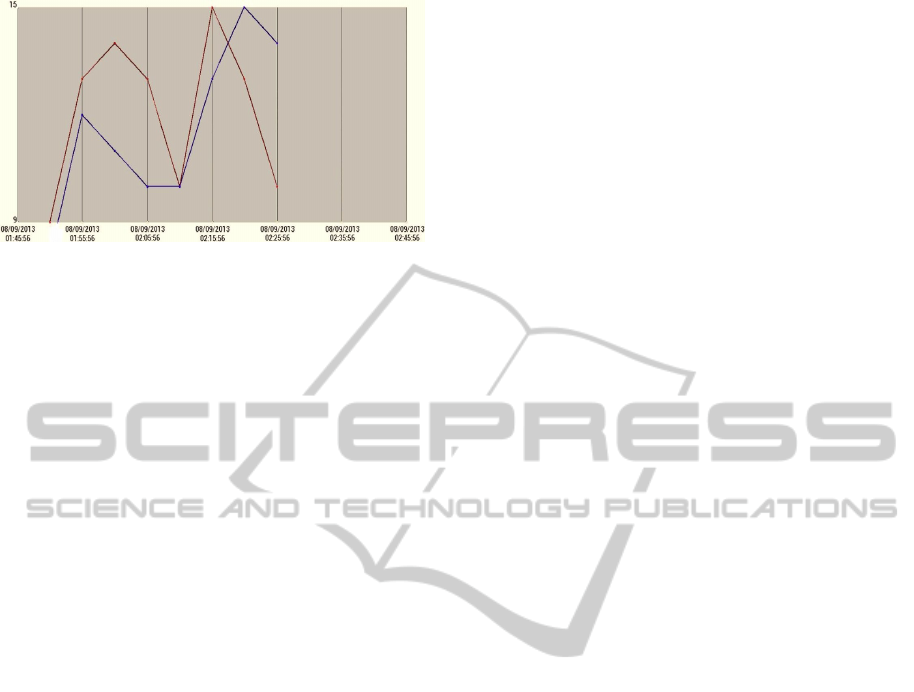
Figure 7: Chart for turbidity measurements over a time
interval, from two sensors.
The experiments showed that the data provisioning
platform and connected applications meet the initial
requirements.
In the future we will develop a decision system,
based on the results obtained up until now.
ACKNOWLEDGEMENTS
This work was supported by a grant of the Romanian
National Authority for Scientific Research, CNDI-
UEFISCDI, project number 47/2012.
REFERENCES
Ani, E. C., Cristea, V. M., Agachi, P. S, Kraslawski, A.,
2010. Dynamic Simulation of Somes River Pollution
Using MATLAB and COMSOL Models. In Revista de
chimie, Bucuresti, nr. 11, pp. 1108-1112.
Ciolofan, S., Mocanu, M., Ionita, A., 2013.
Cyberinfrastructure architecture to support decision
taking in natural resources management. In
Proceedings of the 19th International Conference on
Control Systems and Computer Science, CSCS19, 1st
International Workshop on Cyberinfrastructures for
Natural Resources Management, CyRM-2013,
Bucharest, Romania, pp. 617-623.
Gunatilaka, A., Moscetta, P., Sanfilippo, L., 2007. Recent
Advancements in Water Quality Monitoring - the use
of miniaturized sensors and analytical measuring
techniques for in-situ and on-line real time
measurements of surface water bodies. In Proceedings
of the International Workshop on Monitoring and
Sensor for Water Pollution Control, Beijing.
Horsburgh, J. S., Spackman, J. A., Stevens, D. K.,
Tarboton, D. G., Mesner, N. O., 2010. A sensor
network for high frequency estimation of water quality
constituent fluxes using surrogates. In Environmental
Modelling and Software, vol. 25 (9), pp. 1031-1044.
INSPIRE, 2014. Online: http://inspire.ec.europa.eu/
index.cfm.
Jiang, P., Xia, H., He, Z., Wang Z., 2009. Design of a
Water Environment Monitoring System Based on
Wireless Sensor Networks. In Sensors, vol. 9, pp.
6411-6434.
McDonnell, R. A., 2008. Challenges for integrated water
resources management: how do we provide the
knowledge to support truly integrated thinking? In
International Journal of Water Resources
Development, vol. 24 (1), pp. 131-143.
Mocanu, M., Vacariu, L., Drobot, R., Muste, M., 2013.
Information-centric Systems for Supporting Decision-
Making in Watershed Resource Development. In
Proceedings of the 19th International Conference on
Control Systems and Computer Science, CSCS19, 1st
International Workshop on Cyberinfrastructures for
Natural Resources Management, CyRM-2013,
Bucharest, Romania, pp. 611-616.
Muste, M., Bennett, D., Secchi, S., Schnoor, J., Kusiak,
A., Arnold, N., Mishra, S., Ding, D., and Rapolu, U.,
2013. End-To-End Cyberinfrastructure for Decision
Making Support in Watershed Management. In
Journal Water Resources Planning and Management,
vol. 139 (5), pp. 565-573.
Sensor Observation Service, 2014. Online:
http://www.opengeospatial.org/ standards/sos.
Tacheci, P., Pandele, A., Radulescu, D., Eidsmo, T.,
Zeman, E., Vanecek, S., 2012. Water Resources
Management Tools For Mures River Basin, Romania.
In Proceedings of the 10th International Conference
on Hydroinformatics, HIC, Hamburg, Germany.
Vitolo, C., Buytaert, W., Reusser, D., 2012. Hydrological
Models as Web Services: An Implementation Using
OGC Standards. In Proceedings of the 10th
International Conference on Hydroinformatics, HIC,
Hamburg, Germany.
Wang,, J., Ren, X.L., Shen, Y.L., Liu, S.Y., 2010. A
Remote Wireless Sensor Networks for Water Quality
Monitoring. In Proceedings of International
Conference on Innovative Computing &
Communication, CICC 2010, and Conference on
Information Technology & Ocean Engineering, Asia-
Pacific, ITOE.
Water Framework Directive Common Implementation
Strategy, 2003. Guidance on Monitoring for the Water
Framework Directive, Final Version.
WSN NI, 2014. Online: http://www.ni.com/wsn/
ICINCO2014-11thInternationalConferenceonInformaticsinControl,AutomationandRobotics
690
