
Real-Time Data Mining Models for Predicting Length of
Stay in Intensive Care Units
Rui Veloso
1
, Filipe Portela
1
, Manuel Filipe Santos
1
, Álvaro Silva
2
,
Fernando Rua
2
, António Abelha
3
and José Machado
3
1
Algoritmi Centre, University of Minho, Guimarães, Portugal
2
Serviço Cuidados Intensivos, Centro Hospitalar do Porto, Hospital Santo António, Porto, Portugal
3
CCTC, University of Minho, Braga, Portugal
Keywords: Length of Stay, INTCare, Intensive Care Units, Data Mining, Real-Time.
Abstract: Nowadays the efficiency of costs and resources planning in hospitals embody a critical role in the
management of these units. Length Of Stay (LOS) is a good metric when the goal is to decrease costs and to
optimize resources. In Intensive Care Units (ICU) optimization assumes even a greater importance derived
from the high costs associated to inpatients. This study presents two data mining approaches to predict LOS
in an ICU. The first approach considered the admission variables and some other physiologic variables
collected during the first 24 hours of inpatient. The second approach considered admission data and
supplementary clinical data of the patient (vital signs and laboratory results) collected in real-time. The
results achieved in the first approach are very poor (accuracy of 73 %). However, when the prediction is
made using the data collected in real-time, the results are very interesting (sensitivity of 96.104%). The
models induced in second experiment are sensitive to the patient clinical situation and can predict LOS
according to the monitored variables. Models for predicting LOS at admission are not suited to the ICU
particularities. Alternatively, they should be induced in real-time, using online-learning and considering the
most recent patient condition when the model is induced.
1 INTRODUCTION
With a constant increase in health expenses and the
aggravation of the global economic situation,
managing costs and resources in healthcare assumes
an important role. In Intensive Care Units (ICU) this
reality is even more felt because of the costs
associated to each patient. These costs are quite high
due to several factors as is the large number of
equipment used, the high number of nurses and
doctors, the great variety of therapies and drugs
administered and the patient Length of Stay (LOS).
All these factors lead to an increase of daily patient
costs in an ICU. Planning and provisioning
resources and costs in ICU assumes a critical role in
hospital management (Marshall et al., 2005).
Accurate predictions of the patient's LOS in the ICU
can contribute to reduce costs. It is recognized by
the ICU professionals the importance of having a
tool which help to predict the patient's LOS. This
can help managing the resources and better
understand the patient condition, contributing to
avoid wrong discharges.
Related works found in literature are not accurate
for ICU setting, due to patient specific conditions.
Consequently, the principal motivation of this
research is to induce data mining models that can
predict accurately the LOS of ICU inpatients.
The idea of this work is to understand how many
days a patient with some clinical diseases need to be
in the unit. This only it is possible having a system
which can in real-time adapt the patient's LOS
according to the patient condition. With a correct
prediction of LOS it is possible make a better
resources allocation and consequently decrease the
patient costs, for example, the unit will have a better
professional’s allocation and the therapeutics
(dosages and schedules) can be prescribed according
to the patient LOS. To reach the objectives, two
approaches were explored using Data Mining (DM)
in order to predict the probability of a patient be
discharged in the next hours. The first approach (A)
considered data acquired in the first twenty-four
245
Veloso R., Portela F., Filipe Santos M., Silva Á., Rua F., Abelha A. and Machado J..
Real-Time Data Mining Models for Predicting Length of Stay in Intensive Care Units .
DOI: 10.5220/0005083302450254
In Proceedings of the International Conference on Knowledge Management and Information Sharing (KMIS-2014), pages 245-254
ISBN: 978-989-758-050-5
Copyright
c
2014 SCITEPRESS (Science and Technology Publications, Lda.)

hours and the second approach (B) used data
acquired in real-time. Although the two approaches
have the same goal it is very difficult to compare
them, because the way how the goal was achieved
differs. The approach A predicted a LOS class and
the Approach B predicted the probability of a patient
be discharged in the next hour. The second approach
was explored only because approach A failed. For a
better understanding of the work, the two
approaches will be evaluated separately.
Approach A used data from the patient
admission plus some clinical variables and presented
weak results. These models used classification
techniques to predict the best LOS class. The overall
accuracy of these models ranged from 7.60% to
73.28%. For approach A is not possible to determine
sensitivity and specificity because involves more
than two output classes. Sensitivity has a great
importance in clinical decision because physicians
look for models sensible to one result. The models,
which predict patient discharge hourly, revealed
good results. Mostly all of the models presented
accuracies upper than 70% and in some cases
sensitivities upper than 90%. This work was based in
the study started by INTCare project.
This article is divided into five sections. The first
one introduces the paper. The main concepts and
related work are described in the background in the
section two. In the third one is described the study,
data analysis, transformation, modelling and results.
The subsequent section discusses the results
obtained. The last section makes final considerations
and proposes future work.
2 BACKGROUND
2.1 Length of Stay
Expenditures in hospital care are rising and the costs
associated to the patient represent a significant
portion of the expenses. Reducing Length of Stay
(LOS) in hospitals will lead to an effective reduction
in the costs and an effectiveness improvement in
hospitals (Clarke, 1996). The LOS is the number of
days that a patient is subjected to treatment since
their admission date until the discharge date. This
number of days is counted if the patient is at home
or at the hospital, depending where he is receiving
health cares. The use of this indicator permits to see
the costs with the patient or group of patients along
as the quality of the services given to the patients
(Marshall et al., 2005). Patients with outsized LOS
in the ICU represent an enormous usage of resources
so a reliable prediction of LOS can lead to a rational
bed allocation and to a resources maximization
(Wagener et al., 2011), being more efficiently.
Several works can be found about LOS but for
predicting LOS in ICU no one was found. Isken and
Rajagopalan (2002) use clustering techniques and k-
means algorithms to identify types of patients so that
can be constructed computational simulations or
analytic models about patient flow inside hospitals.
These flow models consider the analysis of measures
like LOS and bed occupancy rate. Another work
used classification techniques recurring to decision
three algorithms, support vector machines and
artificial neural networks to predict LOS in patients
with cardiac disease (Hachesu et al., 2013). Azari
(Azari et al. 2012) propose a multi-layer approach to
predict LOS in hospitals. The work used clustering
techniques to build the training data set. Then,
several classification algorithms were used with the
Naïve Bays, SVM, JRIP and J48 showing the best
results. In the area of Gastroenterology (Zhang et al.
2012) were developed models to predict LOS in ICU
in post-operatory elderly patients with gastric
cancer. The study used regression trees to predict
LOS and other hospital metrics. Caetano et al.
(2014) proposed a data-driven predictive model to
LOS with data from Portuguese hospitals from 2000
to 2013 and used as inputs the typical available
indicators at the hospitalization process. The work
developed several DM Models with the best results
being achieved with Random Forest methods.
2.2 INTCare
This study is being developed under the research
project INTCare. INTCare is a Pervasive Intelligent
Decision Support System (PIDSS) that is in constant
testing and development. Actually it is implemented
in the ICU of the Hospital de Santo António, Centro
Hospitalar Porto. This PIDSS is based on intelligent
agents (Santos et al., 2011) and aims to support the
decision making process and predict clinical events
anywhere and anytime like patient organ failure
(cardiovascular, respiratory, renal, hepatic,
neurological and hematologic), patient outcome
(Portela et. al, 2013a), readmissions, medical
diseases and others. Regarding the predictions made
the system is able to support the decision on
procedures, treatments and therapies. Predictions are
made by means of DM techniques. The system is
based in four autonomous subsystems (data
acquisition, knowledge management, inference and
interface) that use intelligent agents to perform their
actions (Portela et al. 2013b, Portela et al., 2012).
KMIS2014-InternationalConferenceonKnowledgeManagementandInformationSharing
246

2.3 Data Mining
Data Mining (DM) is a field that uses techniques and
methods in data to find trends or patterns in order to
support the discovery of new knowledge (Santos &
Azevedo, 2005). DM identifies opportunities or
threats in business, to support decision making
process or to solve problems. Among the best-
known application areas are Customer Relationship
Management (CRM), banking, retail and logistics
businesses, the entertainment industry, sports,
insurance, travel industry (airlines, hotels, car
rental), health and medicine. A classification model
can be viewed as a function for mapping new cases
(input) to a class from a list of classes (output)
(Santos & Azevedo, 2005). For example, these type
of models can be used to classify the banking history
of users as good or bad (Rokach & Maimon, 2010).
2.3.1 Decision Trees
Decision Trees (DT) was introduced in 1986 in the
machine learning area with the use of ID3 algorithm
to synthesizing decision trees (Quiland, 1986). A DT
based classifier is a partition of an instance of a
space. The decision trees are composed by nodes
and branches. Usually, the DT is constructed with a
top-down strategy with the first node, the root node,
don’t having incoming nodes and giving origin to
two or mode nodes according to the attributes that
are being used. The remaining nodes have only one
incoming node. The nodes that give origin to others
are called internal or test nodes and the others are
called leaves or terminal nodes (Hand, 2001). Figure
1 represents the concept of DT.
Figure 1: Decision Tree, adapted from (Kantardzic, 2011).
The models developed using DT technique
produced rules in the form of IF predictive
information THEN target (Taylor, 2010). These
models use for example CART algorithm that is a
DT learning technique to produce DT as a binary
recursive partitioning procedure capable of
processing continuous and nominal attributes as
targets and predictors (Breiman et al, 1984).
2.3.2 Naïve Bayes
One of the first implementations of a Naïve Bays
classifier occurred in 1994 (Michie et al, 1994).
Bayesian classification is a technique to the
classification of patterns in a set of data. This type of
technique assumes that the classification of patterns
is expressed in probabilistic terms. The classification
based on Bayes theory pretend to classify objects
based on the statistical information of the objects to
minimize the probability of the classification is done
poorly (Cios et al. 2007). The Bayes theorem can be
expressed by the following expression:
P(Ci|X)=(P(X|Ci)*P(Ci))/P(X) (1)
Where,
P(Ci|X) represents the a posteriori probability;
P(Ci) represents the a priori probability;
P(X|Ci) probability density function ( );
P(X) unconditional probability density function.
2.3.3 Support Vector Machines
Support Vector Machines (SVM) are classification
methods to map vectors into a space using nonlinear
mapping building an optimal separating hyperplane
(Vapnik, 1995). The optimal hyperplane is obtained
when the hyperplane is as far as possible from all the
data points that compose the space. SVM algorithms
extend the measurement space in more complex
surfaces so the space includes combinations of the
raw variables. Then trough the margin, the algorithm
attempt to optimize the location of the linear
decision boundary between two classes that is likely
to lead to the best possible generalization, using the
biggest margin (Hand et al, 2001). Figure 2
represents a set of data that can be linearly separable
and where exists an infinite number of hyperplanes
and decision boundaries.
Figure 2: Hyperplanes and Decision Boundaries, adapted
from (Han, 2011).
X>1
Y=?
Class1 Class2 Class3 Class4
No
Yes
Y=A
Y=B
Y=C
Real-TimeDataMiningModelsforPredictingLengthofStayinIntensiveCareUnits
247

2.3.4 CRISP-DM
Once this study is a data mining work it was
followed the CRISP-DM methodology. CRISP-DM
is an acronym for Cross Industry Standard Process
for Data Mining. This paper is organized around the
first five tasks of this methodology: business
understanding, data understanding, data preparation,
modelling and evaluation (Wirth & Hipp, 2000).
3 STUDY DESCRIPTION
3.1 Business Understanding
As mentioned above, the prediction of LOS assumes
an important role on the optimization of costs and
resources in the ICU. In these units a lot of attributes
are available to be used for predicting LOS. Two
approaches were experimented in this study for
predicting LOS of patients in the ICU. The first
approach (A) uses as input data values of collected
in the first 24 hours considering data like the
admission type (worst vital signs values). This
approach is transversal to many areas in medicine
but is a bad choice when used to predict LOS in
intensive medicine. Alternatively, a second approach
(B) was explored. This approach considers more
variables and intends to predict the LOS based in the
probability of a patient be discharged in the next
hour. Then, the LOS is obtained by finding the hour
with the higher probability of the patient be
discharge. This hour represents the inpatient time.
Both approaches used Oracle Data Mining
(ODM) and considered three of the classification
DM techniques available: Decision Trees, Support
Vector Machines and Naïve Bayes.
3.2 Data Understanding and
Transformation
3.2.1 Approach A
The acquisition of the data used in this approach is
made from the electronic health record, laboratory,
and vital signs monitor. Table 1 presents some
statistics about the variables considered.
Case Mix consists in a set of variables that are
present in the Electronic Health Record of the
patient. In this approach were included the variables
age, admission type and admission from, admission
with surgery, Glasgow coma scale, hematologic
disease, transplanted, HTA in treatment, insulin
Table 1: Variables used in approach A.
ID Variable Min Max Value
Age Age 20 96 Real
Sex Sex M F 1 or 2
Admission Type
Urgent - - U
Programmed - - P
Admission surgery
With - - W
Without - - WO
Admission From
Chirurgic - - 1
Observation - - 2
Emergency - - 3
Nursing Room - - 4
Other ICU - - 5
Other Hospital - - 6
Other - - 7
Glasgow Coma GCS 3 15 Real
Hematologic
Disease
Yes - - Y
No - - N
Transplanted
Yes - - Y
No - - N
HTA in Treatment
Yes - - Y
No - - N
Insulin Treated
Diabetes
Yes - - Y
No - - N
Non-Insulin
Treated Diabetes
Yes - - Y
No - - N
Days of Inpatient Inpatient Days 0 40 Real
Hours of Inpatient
Inpatient
Hours
2 970 Real
Oxygen Saturation SPO2 86.00 100.00 Float
Systolic Blood
Pressure
SYS 80.64 219.48 Float
Diastolic Blood
Pressure
DIA 43.20 179.88 Float
Corporal
Temperature
TEMP 34.16 39.74 Float
Heart Rate
Measure
EGG_HR 50.00 231.00 Float
treated diabetes, non-insulin treated diabetes, hours
and inpatient days.These variables are obtained in
the moment of admission. Other variables were
considered (physiological variables) and collected
during the first 24 hours. From the vital signs
monitor, the following variables were collected:
Oxygen Saturation (SPO2), Systolic Blood Pressure
(SYS), Diastolic Blood Pressure (DIA), Corporal
Temperature (TEMP) and Heart Rate Measure
(EGG_HR). In this approach, they were introduced
some classes for the variables days and inpatient
hours (2 classes for each variable), EGG_HR, SPO2,
ART_SYS and ART_DIA by dividing the cases of
each class by equal number. The variables age, sex,
admission type, admission with surgery, admission
from, Glasgow coma scale, hematologic disease,
transplanted, HTA in treatment, insulin treated and
KMIS2014-InternationalConferenceonKnowledgeManagementandInformationSharing
248

non-insulin treated were considered in the Case Mix
group.
3.2.2 Approach B
The acquisition of the data used in this approach is
made from three different sources: the electronic
nursing records, bedside monitors and laboratory. A
pre-processing agent is responsible for validating all
the collected data and for preparing data to the data
mining input table (DMIT). This agent creates the
model input structure for a patient, validates the
input sources data and processes variables.
For this approach where considered 6 main
groups of attributes:
Case Mix (CM) – Age, admission type,
admission from;
SOFA – Cardiovascular, Respiratory, Renal,
Liver, Coagulation and Neurologic;
ACE (Accumulated Critical Events) – ACE of
Blood Pressure (BP), ACE of Oxygen
Saturation (SPO2), ACE of Heart Rate (HR)
and Total ACE;
Ratios 1 (R1) – ACE of BP / elapsed time of
stay, ACE of SPO2 / elapsed time of stay,
ACE of HR / elapsed time of stay, Total of
ACE / elapsed time of stay;
Ratios 2 (R2) – ACE of BP / max number of
ACE of BP, ACE of SPO2 / max number of
ACE of SPO2, ACE of HR / max number of
ACE of HR;
Ratios (R) – Union of the two sets of ratios (R1
and R2).
Case Mix consists on a set of variables that are
present in the Electronic Health Record (EHR) of
the patient. In this approach it was considered the
variables age, admission type and admission from.
These variables are obtained at patient admission
and are automatically transformed according to the
DM attributes.
The Sequential Organ Failure Assessment
(SOFA) is used in ICU to score the degree of
dysfunction/failure of the cardiovascular,
respiratory, renal, liver, coagulation and
neurological organic systems. The value 0 represents
normal function and the maximum value 4 stands for
organ failure. In this case the variable used only
consider two values 0 (sofa = 0) or 1 (sofa > 0).
Accumulated Critical Events (ACE) were
considered as a complement because SOFA has no
predictive capability. ACE include four
physiological variables: blood pressure (BP),
Oxygen Saturation (SPO2) and Heart Rate (HR).
ACE are calculated by summing the critical event
values by hour.
The groups of ratios were added in sequence of
the ACE group. These ratios allow determining the
number of ACE per hour (R1) and a correspondence
between the number of ACE and the maximum
number of events verified in the past, grouped by
category and by patient (R2).
Table 2 represents the transformations on the
data for this approach as well the variables
considered. Note that for Case Mix attributes it is
only used one value to represent each case and for
the SOFA attributes is considered the worst SOFA
value received hourly.
Table 2: Variables used and transformed in approach B.
ID Variable Mi Ma Value
Age Age
18 46 1
47 65 2
66 75 3
76 130 4
Admission Type
Ur
g
ent - - U
Pro
g
ramme - - P
Admission From
Chirur
g
ic - - 1
Observatio - - 2
Emer
g
enc
y
- - 3
Nursin
g
- - 4
Other ICU - - 5
Other - - 6
Othe
r
- - 7
SOFA
Cardiovascula
r
BP
(
mean
)
0 70 1
Do
p
amine 0.0 - 1
Renal
Dobutamin 0.0 - 1
E
p
i / 0.0 - 1
Respiratory
Creatinine 1.2 - 1
Po2/Fio2 0 400 1
He
p
atic Bilirubin 1.2 - 1
Coa
g
ulation Platelets 0 150 1
ACE 0 +∞ SET
R1 0 1 SET
R2 0 1 SET
R1, R2 and ACE values were discretised. These
values were categorized and grouped considering an
interval of values, minimum and maximum. The sets
created were defined considering the average and the
higher value of data collected. The ranges were
created considering the Clinical Global Impression –
Severity Scale (CGI-S) (Guy, 2000). The criterion
used to define percentages concentrate the most part
of patient values within a scale between 0 and 5.
Levels 6 and 7 are for severe cases. Table 3 shows
the discretization rules.
Table 4 represents the discretization of the
variables. On top there are the different sets and on
the left the variables affected.
R1 classes are determined by the rows R1 BP
Min to R1 TOT Max and the R2 attributes (BP, O2,
HR and Total) follow the same rule, e.g. for the first
Real-TimeDataMiningModelsforPredictingLengthofStayinIntensiveCareUnits
249
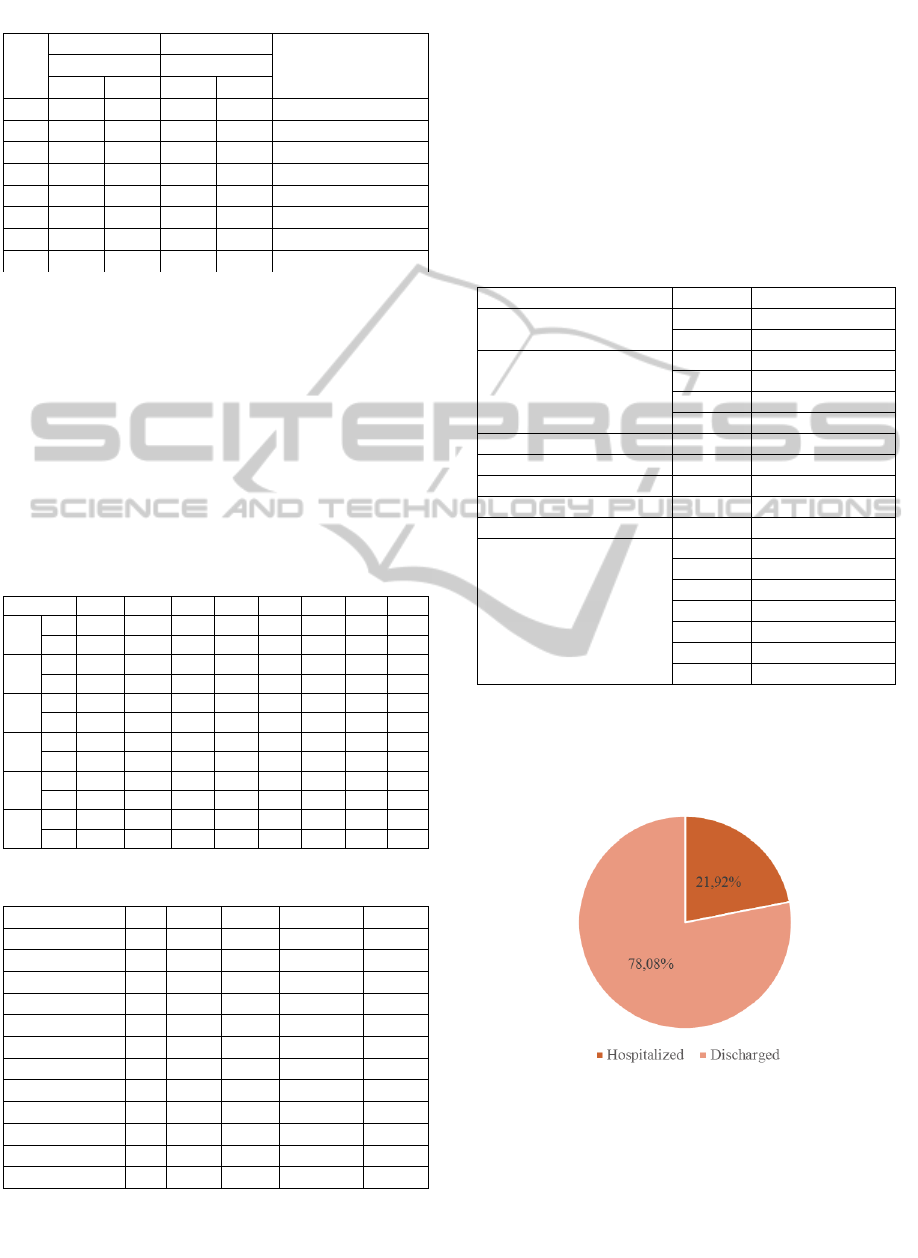
Table 3: Discretization rules for approach B.
Set
R1 R2
Definition Average Maximum
> <= > <=
0 - 0% - 0%
I
nexistence
1 0% 25% 0% 10%
N
ormal Condition
2 25% 50% 10% 25%
B
orderline Condition
3 50% 100% 25% 50%
M
ild Condition
4 100% 150% 50% 75%
M
oderate Condition
5 150% 200% 75% 90%
M
arked Condition
6 200% 300% 90% 100% Severe Condition
7 300% 1000% 100% 200%
E
xtreme Condition
level (1) the range is from 0.00 (0%) to 0.10 (10%).
ACE attributes are grouped by their importance
and number of occurrences. These values where
defined by ICU experts but can be modified in future
studies. All these values are calculated in real-time
according to the most recent patient results. The
values presented in table 4 are the values verified in
the moment when the study was performed. These
new variables used by the models have as prefix
“C_”, e.g. for R2 the class of BP_Max is represented
by C_BP_Max.
Table 4: Discretization sets of Data Mining Input.
SET 0 1 2 3 4 5 6 7
R1 Min -0.100 0.000 0.010 0.021 0.041 0.062 0.082 0.123
BP Max 0,000 0.010 0.021 0.041 0.062 0.082 0.123 2.000
R1 Min -0.100 0.000 0.018 0.036 0.072 0.108 0.144 0.216
O2 Max 0,000 0.018 0.036 0.072 0.108 0.144 0.216 2.000
R1 Min -0.100 0.000 0.004 0.008 0.015 0.023 0.030 0.045
HR Max 0,000 0.004 0.008 0.015 0.023 0.030 0.045 2.000
R1 Min -0.100 0.000 0.020 0.041 0.081 0.122 0.162 0.243
TOT Max 0.000 0.020 0.041 0.081 0.122 0.162 0.243 2.000
R2
Min -0.100 0.000 0.100 0.250 0.500 0.750 0.900 1.000
Max 0 0.100 0.250 0.50 0.750 0.900 1.000 2.000
ACE
Min -0.100 0 3 5 8 10 12 15
Max 0 3 5 8 10 12 15 50
Table 5: Data Analysis.
Variable Min Max AVG STDDEV VC (%)
BP 0 42 0.430 1.054 245.070
BP_Max 0 4.400 0.083 0.230 276.948
BP_Hou
r
0 0.500 0.008 0.025 331.631
H
R
0 16 0.500 1.474 294.800
HR_Max 0 1 0.051 0.140 275.827
HR_Hou
r
0 0.500 0.008 0.025 305.664
O2 0 42 1.030 2.872 278.835
O2_Max 0 1 0.034 0.091 267.398
O2_Hou
r
0 1 0.021 0.055 267.828
Total_ACE 0 50 1.970 4.340 220.305
Total_Ma
x
0 1.170 0.052 0.108 207.934
Total_Hou
r
0 1 0.0370 0.077 207.751
Table 5 presents the distributions of the numeric
fields used in approach B. It is possible to observe
that the sample data have quite heterogeneous
distributions because the variation coefficient is
lesser than 20%. This value is used to assess if a
distribution is hetero or homogeneous. Table 5
presents the minimum value (MIN), maximum value
(MAX), average (AVG), standard deviation
(STDDEV) and coefficient of variance (VC).
Table 6 presents the distribution of the classes
(in percentage) for each one of the independent
variables.
Table 6: Classes Distribution.
Variable Values Percenta
g
e
Admission Type
P 23.5%
U 76.5%
Age
1 16.9%
2 36.4%
3 20.8%
4 25.9%
Res
p
irator
y
1 61.6%
Coa
g
ulation 1 39.0%
Renal 1 19.7%
He
p
atic 1 17.6%
Cardio 1 61.6%
Admission From
1 47.3%
2 0.3%
3 17.7%
4 14.9%
5 2.2%
6 2.0%
7 15.5%
Figure 3 represents the target (discharge)
distribution. The discharged patients are represented
by the value 1, and by 0 are the ones that are
hospitalized.
Figure 3: Target Distribution.
3.3 Modelling
3.3.1 Approach A
In this approach 24 models were created combining
2 different scenarios, 4 target and 3 techniques.
KMIS2014-InternationalConferenceonKnowledgeManagementandInformationSharing
250

Scenarios:
1 = {CM, Class EGG_HR, Class SPO2, Class
SYS, Class DIA, Class Temp}
2 = {CM, EGG_HR, SPO2, SYS, DIA, Temp}
Target:
1 = Class Hours 1
2 = Class Days 1
3 = Class Hours 2
4 = Class Days 2
Techniques:
1 = Support Vector Machine
2 = Decision Trees
3 = Naïve Bayes
Each one of the targets was defined according to
Sturges Rules or with clinical domain provided by
ICU physicians.
Class Hours 1 – Sturges Rules
[2, 100.67]
] 100.67, 199.39]
] 199.39, 297.98]
] 297.98, 396.65]
] 396.65, 495.32]
] 495.32, 593.99]
] 593.99, 692.66]
] 791.33, 890]
] 890, 970]
Class Hours 1 – Clinical domain
[0, 72]
] 72, 120]
] 120, +∞ [
Class Days 1 – Sturges Rules
[0, 4.4]
] 4.4, 8.8]
] 8.8, 13.2]
] 13.2, 17.6]
] 17.6, 22]
] 22, 26.4]
] 26.4, 30.8]
] 30.8, 35.2]
] 35.2, 40]
Class Days 2 – Clinical Domain
[0, 3]
] 3, 5]
] 5, +∞]
In order to evaluate the models created, 70% of
the data was considered for training and 30% for test
(hold-out sampling). The data used in models
corresponds to admissions / discharges made in ICU
of CHP from 2011.08.18 to 2014.02.08 (905 days),
to 407 patients and to 448 records. The
configurations used for these models were based in
the ODM pre-defined settings.
3.3.2 Approach B
For approach B were developed 39 models. These
39 models combine 13 different scenarios, 1 target
and 3 different techniques.
Scenarios:
1 = {CM}
2 = {CM + ACE + R}
3 = {CM + ACE + R1}
4 = {CM + ACE + SOFA}
5 = {CM + ACE + SOFA + R}
6 = {CM + ACE + SOFA + R1}
7 = {CM + ACE + SOFA + R2}
8 = {CM + ACE-SET + R-SET}
9 = {CM + ACE-SET + R1-SET}
10 = {CM + SOFA + ACE-SET}
11 = {CM + SOFA + ACE-SET + R-SET}
12 = {CM + SOFA + ACE-SET + R1-SET}
13 = {CM + SOFA + ACE-SET + R2-SET}
Target:
1 = Discharge
Techniques:
1 = Support Vector Machine
2 = Decision Trees
3 = Naïve Bayes
The models created used the same configurations
of approach A: 70% of the data for training and 30%
for testing. The data used in the models correspond
to admissions / discharges made in ICU of CHP
from 2012.02.01 to 2014.04.24 (813 days),
considering 526 patients and 55442 records. Each
one of the models has been induced automatically
and in real-time using streamed data. The data
mining engine used the data present in the input
table. This data can be represented as a tuple:
DMIT=<pid, date, hour, V_ace_bp,
V_aceBP_time, V_aceBP_max, V_ace_hr,
V_acehr_time, V_aceHR_max, V_ace_spo2,
V_ace_spo2_time, V_ace_spo2_max, V_total_ace,
V_total_ace_time, V_total_ace_max, V_age,
V_admin_F, V_admin_T, V_sofa_cardio,
V_sofa_resp, V_sofa_renal, V_sofa_coag,
V_sofa_hepa>
In this tuple pid represents the patients’
identification, the date the date of the values, hour
represents the number of hours elapsed since the
patient is admitted in the ICU and the tuples with V
prefix represent the values obtained for each patient
in each date / hour. Table 7 presents the
configurations for each one of the algorithms. For
Real-TimeDataMiningModelsforPredictingLengthofStayinIntensiveCareUnits
251
each parameter is indicated the values considered
and if is a default value or a user-specified value
(input).
Table 7: Techniques configurations for approach B.
Techni
q
ue Settin
g
Value T
yp
e
DT
Minrec Node 10 In
p
ut
Max De
p
th 7 In
p
ut
Min
p
ct S
p
lit 0.1 In
p
ut
In
p
urit
y
Metric Gini In
p
ut
Minrec S
p
lit 20 In
p
ut
Min
p
ct Node 0.05 In
p
ut
Pre
p
Auto On In
p
ut
NB
Pairwise Threshol
d
0 In
p
ut
Sin
g
leton Threshol
d
0 In
p
ut
SVM
Conv tolerance 0.001 In
p
ut
Active Learnin
g
Enable In
p
ut
Kernel Function Linea
r
Default
Com
p
lexit
y
facto
r
0.142831 Default
Pre
p
auto On In
p
ut
3.4 Results
3.4.1 Approach A
The results obtained by approach A were very poor.
The best model presents 73.27% of overall accuracy.
To evaluate these models only was used the
accuracy metric, the sensitivity and specificity
metrics were not calculated because the outputs are
represented by more than two classes. Table 8
presents the three best models for this approach.
Table 8: Three best models for approach A.
Scenario Target Technique Accuracy
S1 T2 NB 73.28%
S2 T1 NB 73.28%
S2 T4 NB 50.75%
3.4.2 Approach B
To evaluate the results obtained by approach B were
considered three metrics: sensitivity, accuracy and
specificity. As mentioned before sensitivity is the
most adequate metric in the medicine area.
Table 9 presents the three best models. Table 10
presents the best models for each metric. This table
is useful to find which is the better model when it is
Table 9: Three best models for approach B.
Scenario Technique Accuracy Sensitivity Specificity
S7 DT 74.620%
87.322%
71.169%
S13 DT 77.286% 78.355% 76.628%
S11 DT 77.063% 78.673% 76.628%
expected an equilibrated prediction (accuracy),
predict hourly discharge (sensitivity) or predict a
non-discharge hour (specificity).
Table 10: Three best models for each metric - approach B.
Accuracy Sensitivity Specificity
S2DT - 77.311% S4SVM - 96.140% S12DT - 77.067%
S7DT - 77.286% S11SVM - 95.963% S8DT - 77.043%
S11DT - 77.063% S7SVM - 95.902% S9DT - 77.043%
To understand the importance of each attribute, a
ranking was made for the best model (Table 11).
Minimum Description Length, a supervised
technique for calculate the attribute importance, was
used.
Table 11: Attribute importance for the best model of
approach B.
Attribute Rank Importance
Hour 1 0.110
EC_AC_TOT 2 0.043
EC_AC_HR 3 0.025
ADMINF 4 0.020
EC_AC_O2 5 0.019
Age 6 0.010
Cardio 7 0.008
Renal 8 0.002
ADMINT 9 0.001
Considering scenario 7 and the DT technique,
the most important attributes correspond to the new
variables introduced: number of inpatient hours
(Hour), the hourly accumulated critical events
(EC_AC) for heart rate and oxygen saturation, the
total of accumulated critical events by hour and the
place where the patient was previously hospitalized
(ADMINF).
4 DISCUSSION
The models which presented the best results were
the ones that predict the patient discharge for the
next hour and were able to update the LOS in real-
time. The models of approach A, which predicted
the LOS using information of the admission process
and some measures of patient revealed to be very
poor. In the context of medicine these models cannot
be considered. DT presented overall accuracies
ranging from 7.6% to 38.46%. For NB the results
were situated between 15.14% and 73.28%. In the
case of SVM the worst result corresponds to an
accuracy of 32.65% and the better one to 47.11%.
The use of different classes as target does not
KMIS2014-InternationalConferenceonKnowledgeManagementandInformationSharing
252

influence the results (the discretization techniques
have no effect in the behaviour of the models). As
mentioned before, one of the most important
measures for evaluating data mining models in the
clinical area is the sensitivity. In the approach A this
measure cannot be evaluated because the target
variable has more than two classes.
Finalizing, the approach A does not evidence
clinical relevance since the corresponding accuracies
are very low and does not achieved the baseline
defined in accordance with physicians (accuracy >
75%). For approach B the models which present best
results are the ones that consider case mix, SOFA,
ACE and the second group of ratios (R2). The model
that uses Scenario 7 and DT technique presented a
good overall accuracy of 74.620% and a very good
sensitivity 87.322%. This model is equilibrated
when compared all the metrics. It revels to be a good
model to make an accurate prediction of patient
discharge. However and being sensitivity one of the
most important metrics there are some models which
presented sensitivities upper than 95%. In this case
the scenario 4 using SVM it is the best model,
presenting a sensitivity of 96.140%. In Figure 4 it is
possible to observe the ROC for the best model.
Figure 4: ROC Curve for model S7-DT.
The use of discrete values for ACE and ratios
produced models with better accuracies.
Nevertheless, sensitivity decreased about 15% to
20%. Although the efforts made during this work,
the accuracy level attained is not very high. The
models with better accuracy presented a lower
sensitivity. So the choose of the best model depends
on the decision-maker objective: good models to
predict the possibility of a patient be discharged
(sensitivity) or equilibrated models between the two
outputs (accuracy). The SVM technique presented
very good results in terms of sensitivity but the
overall accuracy of these models is very weak. The
specificity maintains almost the same results
independently the scenario or technique used.
5 CONCLUSIONS AND FUTURE
WORK
The approaches presented in this work differ in the
data set used and in the number classes of the target
variable. Approach A considered the worst values
occurred during the first 24 hours to predict a
number of days (LOS) that ranges from 1 to n (n
classes). Approach B considered real-time values
hourly collected to predict if a patient will be
discharged in the next hour (2 classes). Approach A
corresponded to a more conventional approach
followed in other areas of medicine. In intensive
medicine such approach is not useful. The first part
of this work was dedicated to approach A. In the
second part, an alternative approach has been
explored in order to overcome the limitations
encountered in approach A. Approach B revealed
characteristics more appropriate to intensive
medicine. All the work was carried out under the
supervision off ICU physicians. They verified the
soundness of the work and the impact of the results
in intensive medicine. By the way of this research
work interesting results were obtained for predicting
LOS in Intensive Medicine. The results allow
conclude that the prediction of patient discharge in
an hourly base is very efficient. Models induced to
predict LOS using admission information and
excluding ratios and attributes from the SOFA reveal
to be very limited. The discretization of some
variables help to increase the overall accuracy of the
models however the sensitivity decreases. This
approach could not be considered the best due the
results presented are not satisfactory.
Intensive Medicine has specific characteristics
that make classic LOS models inadequate. Real-time
models, able to update the LOS according to the
patient condition, obtained better results.
This was an applied research work whose main
contributions are:
Intensive medicine – an efficient predictive
model to determine LOS. According to the
literature, completely new results were
presented;
Data mining – a real-time approach has been
developed. Results are an interesting
increment in the scientific knowledge of
streaming data mining.
Those contributions are original and mainly
focused in the field of Intensive Medicine. By using
Data Mining techniques has been possible achieve a
LOS predictive model to improve the discharge
decision process. This approach can be followed in
Real-TimeDataMiningModelsforPredictingLengthofStayinIntensiveCareUnits
253

other critical units where the patients are in
continuous monitoring. In the other cases, solutions
presented in the literature can achieve this goal.
In the future additional variables will be
considered to understand how they can affect the
LOS of inpatients.
ACKNOWLEDGEMENTS
This work has been supported by FCT – Fundação
para a Ciência e Tecnologia in the scope of the
project: Pest-OE/EEI/UI0319/2014.
The authors would like to thank FCT
(Foundation of Science and Technology, Portugal)
for the financial support through the contract
PTDC/EEI-SII/1302/2012 (INTCare II).
REFERENCES
Azari, A., Janeja, V.P. & Mohseni, A., 2012. Predicting
Hospital Length of Stay (PHLOS): A Multi-tiered
Data Mining Approach. In 2012 IEEE 12th ICDB
Workshops. IEEE, pp. 17–24.
Breiman, L. et al., 1984. Classification and Regression
Trees no, ed., Belmont, CA: Wadsworth International
Group.
Caetano, N. et al., 2014. A Data-Driven Approach to
Predict Hospital Length of Stay: A Portuguese Case
Study. In ICEIS 2014. (Accepted to be published)
Cios, K. et al., 2007. Supervised Learning: Statistical
Methods. In A Knowledge Discovery Approach.
Springer US, pp. 307–386.
Clarke, A., 1996. Why are we trying to reduce length of
stay? Evaluation of the costs and benefits of reducing
time in hospital must start from the objectives that
govern change. Quality in health care: QHC, 5(3),
pp.172–9.
Dahan, H. et al., 2014. Proactive Data Mining with
Decision Trees, New York, NY: Springer New York.
Guy W., Rush J, e. a. (2000). Clinical Global Impressions
(CGI) Scale. Psychiatric Measures, APA.
Hachesu, P.R. et al., 2013. Use of data mining techniques
to determine and predict length of stay of cardiac
patients. Healthcare informatics research, 19(2),
pp.121–129.
Han, J., Kamber, M. & Pei, J., 2011. Data Mining:
Concepts and Techniques 3rd ed., San Francisco, CA,
USA: Morgan Kaufmann Publishers Inc.
Hand, D.J., Smyth, P. & Mannila, H., 2001. Principles of
data mining. Available at: http://dl.acm.org/citation.
cfm?id=500820 [Accessed May 5, 2014].
Isken, M.W. & Rajagopalan, B., 2002. Data Mining to
Support Simulation Modeling of Patient Flow in
Hospitals. Journal of Medical Systems, 26(2), pp.179–
197.
Kantardzic, M., 2011. Data Mining: Concepts, Models,
Methods, and Algorithms 2nd ed., Wiley-IEEE Press.
Marshall, A., Vasilakis, C. & El-Darzi, E., 2005. Length
of Stay-Based Patient Flow Models: Recent
Developments and Future Directions. Health Care
Management Science, 8(3), pp.213–220.
Michie, D., Spiegelhalter, D.J., et al., 1994. Machine
Learning, Neural and Statistical Classification. Ellis
Horwood.
Portela, F., Santos, M.F., Silva, Á., et al., 2013. Data
Mining for Real-Time Intelligent Decision Support
System in Intensive Care Medicine. In ICAART 2013
- International Conference on Agents and Artificial
Intelligence. pp. 270–276.
Portela, F., Santos, M.F., Machado, J., et al., 2013.
Pervasive and Intelligent Decision Support in Critical
Health Care Using Ensembles. In ITBAM. pp. 1–16.
Portela, F., Pinto, F. & Santos, M.F., 2012. Data Mining
Predictive Models for Pervasive Intelligent Decision
Support in Intensive Care Medicine. In KMIS. pp. 81–
88.
Quiland, J.R., 1986. Induction of Decision Tress. Machine
Learning, 1(1), pp.81.106.
Rokach, L. & Maimon, O., 2010. Supervised Learning. In
O. Maimon & L. Rokach, eds. Data Mining and
Knowledge Discovery Handbook. Springer US, pp.
133–147.
Santos, M.F. & Azevedo, C., 2005. Data Mining
Descoberta de conhecimento em base de dados, FCA -
Editora de Informática, Lda.
Santos, M.F., Portela, F. & Vilas-Boas, M., 2011.
INTCARE : multi-agent approach for real-time
intelligent decision support in intensive medicine.
Taylor, K., 2010. Oracle Data Mining Concepts.
Vapnik, V.N., 1995. The Nature of Statistical Learning
Theory 1st ed., Springer.
Wagener, G. et al., 2011. The Surgical Procedure
Assessment (SPA) score predicts intensive care unit
length of stay after cardiac surgery. The Journal of
thoracic and cardiovascular surgery, 142(2), pp.443–
50.
Wirth, R., & Hipp, J. (2000). CRISP-DM: Towards a
standard process model for data mining. Paper
presented at the 4th ICPAKDD.
Zhang, X.-C., Zhang, Z.-D. & Huang, D.-S., 2012.
Prediction of length of ICU stay using data-mining
techniques: an example of old critically Ill
postoperative gastric cancer patients. Asian Pacific
journal of cancer prevention: APJCP, 13(1), pp.97–
101.
KMIS2014-InternationalConferenceonKnowledgeManagementandInformationSharing
254
