
A System Dynamics Model to Study the Impact of
an Age Pyramid on Emergency Demand
Bożena Mielczarek, Jacek Zabawa and Marek Lubicz
Institute of Industrial Engineering and Management, Wrocław University of Technology,
Wybrzeże Wyspiańskiego 27, Wrocław, Poland
Keywords: System Dynamics, Hospital Management, Emergency Departments, Demand, Age Pyramid.
Abstract: This paper describes a system dynamics simulation model to analyse the relationship between age pyramid
and the volume of patients arriving to hospital emergency departments located in a sub-region of Lower
Silesia of Poland. The study relies on demographic and historical demand data, and the cohort forecasts for
the population of the region. The results of the simulation experiments provide insights into the relationship
between sub-regional demographic trends and population needs in relation to hospital emergency arrivals.
The preliminary findings indicate that the forecasted long-term demographic changes in the population may
increase the number of emergency patients in the area.
1 INTRODUCTION
This paper follows on our previous study and reports
on the use of simulation methods to support
healthcare policy planning on a regional level. The
results of the first stage of the research were
described in (Mielczarek 2013; Mielczarek 2014).
The overall goal of the study is to assess the volume
of emergency services (ER) to be contracted by the
regional branch of National Health Fund (NFZ) in
admission units (AU) and emergency wards (EW)
located in Lower Silesia region in Poland to cover
the demand for emergency medical treatment. In our
previous study, a discrete event simulation model
(DES) was built to plan the number and value of
hospital emergency services to be contracted by
NFZ with providers, for the following year, to meet
the needs of the population and to ensure that the
cost of the services to be delivered in emergency
units is reimbursed by the contract. This study is an
attempt to identify the relationship between the
number of emergency hospital visits, as forecasted
based on the number of patients arriving at the
hospital emergency departments in the area, and the
demographic parameters of the population.
The challenge when supporting the decisions
related to capacity planning at the regional and
national level is the demand estimation. In practice,
demand for healthcare services is defined based on
the supply, i.e. the number of services delivered to
patients, because only this type of information is
available in the source databases. When dealing with
elective services, the separate measures of supply
(outpatients seen and inpatients admissions) and
referrals (outpatient referrals and decisions to admit)
are available (Martin et al. 2007). This approach,
however, may not be used in relation to the majority
of healthcare services. For example, the emergency
care is provided without limits for every patient who
requires medical assistance and it is not possible to
separately estimate demand and supply.
In our research proposal we assume that the
estimated demand for emergency services is driven
not only by the historically registered population
needs described by the services that have already
been delivered to patients, but also by the factors
directly related to the population structure. The
relationships between changing ER needs of the
population under study and the demographic
parameters (namely: age-gender groups and
migration rates) will be simulated using system
dynamics approach. Based on historical data and
external forecasts of demographic trends published
by Central Statistical Office (GUS, 2014), we
wanted to examine the influence of the fluctuations
in the age pyramid on the volume of ER needs
expressed by the patients arriving at hospital
AU/EWs in the area.
879
Mielczarek B., Zabawa J. and Lubicz M..
A System Dynamics Model to Study the Impact of an Age Pyramid on Emergency Demand.
DOI: 10.5220/0005132008790888
In Proceedings of the 4th International Conference on Simulation and Modeling Methodologies, Technologies and Applications (HA-2014), pages
879-888
ISBN: 978-989-758-038-3
Copyright
c
2014 SCITEPRESS (Science and Technology Publications, Lda.)

2 THE METHOD
There are four main simulation approaches
commonly used to study healthcare management
problems: Monte Carlo (MC), discrete event (DES),
agent based (ABS) and system dynamics (SD). All
these methods have their strengths and limitations,
and the choice of a particular technique depends
mainly on the area the model is going to be applied.
According to Lagergren (1998) and Mielczarek &
Uziałko-Mydlikowska (2012) five main areas of
simulation models applied in health services may be
distinguished:
Health policy: when making decisions that relate to
national, regional or local health planning strategies;
Improvements: when focusing on the current work of
service providers in order to identify bottlenecks and
suggest improvements of system performance;
Forecasting: when trying to predict future demand
and define the resources that will be necessary to
cover the forecasted population needs;
Medical decisions: when conducting the assessment
of various operational decisions in medical practice;
Extreme events: when determining the preparedness
and efficiency of healthcare system in cases of
unexpected events and threats.
DES is by far the most frequently used modelling
technique in improvements (Bowers & Mould 2004),
forecasting (Harper, Phillips & Gallagher 2005) and
extreme events application areas (Whitworth 2006).
This dominant position of DES models is
particularly justified when studying system
performance, testing different alternatives of system
operation, and suggesting system improvements.
MC method is applied across all of the areas, usually
as a supportive technique, and it is a preferred
modelling approach for analysing health policy and
medical decision issues (Jacobson, Sewell &
Weniger 2001). SD is selected mainly to tackle
problems in epidemiology and disease prevention
within health policy and forecasting areas (Homer et
al. 2004; Kasaie et al. 2010). ABS is still not very
popular among healthcare researchers and very few
examples of agent models can be found in literature
(Cabrera et al. 2011).
We chose the SD method for the development of
our projections because this approach enables to
include not only quantitative but also qualitative
aspects of the system. The qualitative parameters are
introduced by the use of casual loops that link
together the risk factors and the decision input
variables. Moreover, system dynamics modelling is
based on the aggregated attributes and therefore it
enables more strategic perspective of the
management of the system. The demography related
factors like aging of the population, deaths,
migrations, and the continuous progress of certain
diseases create a constantly changing situation
influencing the number of patient presentations to
AW/EUs. There are however long delays between
causes and effects that hinder the process of
modelling especially when trying to determine long-
term population dynamics and explore implications
for the health capacity planning strategy. The unique
concept of time spread delays introduced through
stock-and-flow structures in SD simulation models
is ideal for this purpose.
3 LITERATURE REVIEW
There have been many applications of SD in
healthcare, especially in the last decade (Mustafee,
Katsaliaki & Taylor 2010; Luke & Stamatakis
2012), consistently growing in numbers and areas of
investigation. This reflects the complex and dynamic
nature of healthcare systems. In particular, the
ability of SD to deal with dynamic complexity, the
term introduced by Sterman (2000), is valuable
when studying the subpopulations with different
demands (Diaz, Behr & Tulpule 2012), the diverse
stakeholders with conflicting policy aims, and the
unclear ramifications of non-trivial planning
decisions (Hoard et al. 2005).
The applications of SD in healthcare may be
grouped according to level (national, regional, unit),
type or phase of decision making (strategic and
policy, tactical or operational management), or
healthcare-related issues (prevention, population
health and epidemiology, patient flows and
healthcare delivery). In the field of ER, system
dynamics may be used: (a) in more general
emergency response models dealing with pre-
hospital aspects of acute health care within a region,
such as models of hospital-based emergency medical
care delivery in a single emergency unit or (b) in a
hospital-wide complex system including relations
with wards and other hospital units.
A well-known approach by Brailsford et al.
(2004) employs a whole-system perspective to study
the causes of increasing emergency demand in the
region of Nottingham, England and to investigate
the ways in which patient flows and system capacity
could be improved. Taylor & Dangerfield (2005)
used two cases of a shift in the location of cardiac
catheterization services to explore potential effects
of alternative policies on demand for services. A
conceptual framework of SD use for modelling mass
SIMULTECH2014-4thInternationalConferenceonSimulationandModelingMethodologies,Technologiesand
Applications
880

casualty hospital preparedness in rural areas, seen as
a community-wide effort, was formulated by Hoard
et al. (2005).
More SD models have been formulated for the
second group of ER problems, i.e. to investigate
patient flows in hospital emergency units in the
context of waiting times and bed capacity. For
example, Lane, Monefeldt & Rosenhead (2000)
explored relations between ER waiting times and
changes in an ER bed capacity and Vanderby &
Carter (2010) analysed additional ER performance
factors like changes in personnel capacity, re-routing
patients schemes, and increased arrival flows. A
general approach to analysing ER performance was
presented by Wong et al. (2012), who developed a
conceptual model of the relations between ER and
internal medicine. The authors have also elaborated
a taxonomy of issues confronting hospital
management with changing demand due to
population ageing and healthcare evolution (e.g.
shift from inpatient to outpatient settings or higher
acuity and complexity of care). Demir et al. (2014)
analysed a specific type of emergency demand,
namely demand for neonatal care, and in-hospital
patient flows in neonatal care units primarily for
understanding of the behaviour of the complex
system and informing the process of decision
making and policy design.
4 PROBLEM STRUCTURING
4.1 System Description
The study was conducted in the Wrocław Region
(WR), which is part of the Lower Silesia, the fourth
largest region in Poland. The WR encompasses 9
districts: the capital of Lower Silesia (Wrocław) and
8 districts that are close to the capital. In 2010, the
WR’s population comprised approximately 41.11%
of the Lower Silesian population. The AU/EWs
located in the WR serve the inhabitants of the region
in addition to patients from other Lower Silesia sub-
regions and citizens from other Polish provinces.
Individuals who reside in the WR may receive
emergency treatment from the AU/EWs located in
the WR and the AU/EWs located in other Polish
sub-regions.
During the first stage of the study (Mielczarek
2013; Mielczarek 2014) we used DES modelling
approach to forecast the level of emergency services
that should be contracted by NFZ for the following
year to cover the forecasted demand for emergency
medical treatment in the WR. We then assumed that
the population demography parameters were stable
and aspects like migration, birth and death rates,
average expected lifetimes, and morbidity factors
did not influence the volume of ER patients.
The general concept of the hybrid DES-SD
model is shown in Figure 1. The DES model
captures three geographically related sources of
emergency patients for direct admission to one of
the AU/EWs located in the WR: flow no.1 - arrivals
from the WR, flow no.2 - arrivals from other
subregions of Lower Silesia, flow no.3 - arrivals
from other Polish provinces. One output flow (no.4)
simulates the WR patients who select the treatment
outside the WR.
The model presented in this study attempts to
find the relationship between the demographic
changes observed over long period within the WR
population and the number of patients arriving to
AU/EWs located in the WR (flow number 1 in
Figure 1).
Figure 1: The general concept of the hybrid DES-SD
model.
4.2 Model Overview
The basic causal structure of the system dynamics
model built in ExtendSim software is shown in
Figure 2. The general graph features only the main
pathways by which the WR population influences
the volume of demand for emergency services. At
the core of the model is the aggregate population
stock describing the demographic changes observed
within the WR population. The detailed age pyramid
model is presented in Figure 3 and discussed in the
next section (4.3). Emergency needs of the WR
population are covered by the AU/EWs situated in
System Dynamics
Model
AU/EW in WR?
DES model
1
4
2 3
Demographic
(historical)
data
Demand
(historical)
data
External
demographic
forecasts (GUS)
Number of medical
procedures to be
contracted by NFZ
Cost of medical
procedures to be
contracted by NFZ
NO
YES
ASystemDynamicsModeltoStudytheImpactofanAgePyramidonEmergencyDemand
881
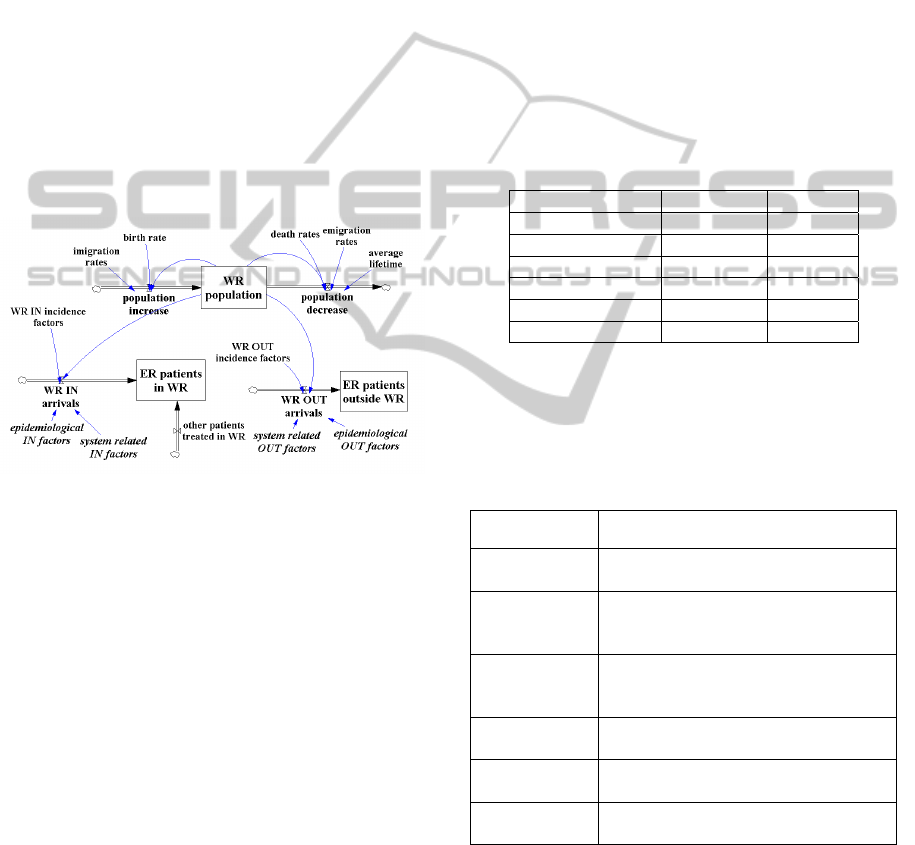
the WR (stock named “ER patients in WR”) and the
AU/EWs located in other Polish sub-regions (stock
named “ER patients outside WR”). The size of the
WR population is not, however, the only predictor of
emergency attendances to AU/EWs. Patients with
certain diseases or particular health problems (e.g.,
cardiac patients) may significantly increase the
number of emergency cases (“epidemiological
factors” in Figure 2). Because of the national health
system regulations, it is not uncommon that some
acute patients consider hospital AUs as alternatives
to general practitioners, which increases the number
of non-emergency cases treated by the emergency
departments (“system related factors” in Figure 2).
Patients living outside of the WR are free to choose
a hospital in the area and therefore the stock
describing the emergency services delivered by the
WR providers (“ER patients in WR”) is affected by
another flow named “other patients treated in WR”.
Figure 2: Overview of model structure, showing
quantitative (roman) and qualitative (italics) input factors.
4.3 Dynamic Aging Chain
The initial data analysis revealed that, in terms of
generating demand for emergency services, the
population is not homogenous, and the different age
groups have a different share in the global number of
emergency presentations (Table 1). We used two
aging chains according to each gender (Krejci,
Kvasnicka & Svasta 2011) with five age groups in
every chain (Figure 3). These age groups were
chosen because of the compatibility with the data
sources used for parameter quantification.
Each cohort (stock), except for the last one, of
the female aging chain presents a state variable with
two input and three output flows. The input flows
are: births (cohort 0
–4) or maturation from the
previous age group (cohorts 5–19, 20–39, 40–59),
and immigrations. The output flows are:
emigrations, deaths, and maturation to the next age
group. The last cohort (60+) has two input flows:
maturation from the age group 40
–59 and
immigrations, and two output flows: emigrations and
deaths.
The aging chain for males differs from the
female chain in that the birth input flow depends on
the number of female 20
–39 cohort.
The initial values of every cohort match
historical conditions. During simulation, the state
variables change at equal time intervals based on the
integrated (no delay) mode (ExtendSim 2014). This
means that all input and output flows that are
connected to the particular stock (cohort) are
aggregated into one dynamic object and this
resultant flow instantly increases or decreases the
number of individuals in the cohort.
Table 1: Percentage share of the age groups in the total
number of emergency cases. Historical data 2011.
Age group [years] Female [%] Male [%]
0–4 8.5 10.5
5–19 13.5 17.2
20–39 25.7 29.3
40–59 21.3 22.3
60+ 31.0 20.8
Total 100.0 100.0
The formulas used to model input and output
flows are briefly described in Table 2: this is usually
the function of the given population cohort and the
appropriate rate indicators.
Table 2: Formulas used to determine the flows’ equations.
Flow Function of:
births
- quantity of F 20–39 women cohort
- fertility rates
deaths (0–4,
5–19, 20–39,
and 40–59)
- quantity of population cohort
- mortality rates
deaths (60+)
- quantity of the population cohort
- the average life expectancy for the
female/male at the age 60
emigration
- quantity of population cohort
- emigration rates
immigration
- quantity of population cohort
- immigration rates
maturation
- quantity of population cohort
- full time within cohort
The simulation begins in 2007 and, until 2012,
the parameters have been set to values calculated on
the basis of published historical data (GUS 2014).
Beyond the year 2012, the exogenous variables can
not be based on survey data and are estimated using
historical data and forecasts published by GUS
(2014).
SIMULTECH2014-4thInternationalConferenceonSimulationandModelingMethodologies,Technologiesand
Applications
882

Figure 3: Female aging chain with five cohorts.
Some parameters remain on the same level as
observed for 2012 (e.g. migration rates), some
slightly increase (e.g. female/male birth rates), and
some very slowly decrease (e.g. female/male death
rates). More rapid decrease is forecasted for the
newborn death rates. The average life expectancy at
the age of 60 linearly grows to 24.51 in the year
2035 for a male, and for a female to 28.89.
4.4 Emergency Demand
Every population cohort influences two flows of ER
demand: the main flow (Figure 2), which is served
by the WR providers (“emergency arrivals inside
WR”), and the additional flow, which is served by
the ER providers situated outside of the WR
(“emergency arrival outside WR”).
Figure 4 shows an overview of the essential
causal structure for the female ER sub-model. The
single cohort of females simulated in the population
sub-model influences the number of emergency
cases classified into the particular age/gender related
ER stock. Every ER stock is also supplied by the
input flow of acute patients living outside of the
WR. The sum of all ER stocks determines the
number of emergency cases treated in the WR.
Data for the emergency demand analysis were
obtained from the NFZ regional branch in Wrocław
for the years 2010
–2011. Two basic data sets were
analysed. The first included information on 183,517
emergency visits by patients residing in the WR who
arrived in AUs/EWs located in the Lower Silesia
area. The records from the second data set included
201,636 patients with any residence codes registered
in AUs/EWs deployed in the WR. Based on these
data sets the rate-flow parameters were estimated.
The model also incorporates two other groups of
factors affecting the ER flow rates that may be
directly amenable to policy intervention: the
morbidity trends and the health system related
parameters. The morbidity flow-rate drivers reflect
the epidemiological trends, as forecasted for the WR
population, that may affect the total volume of ER
demand. For example, it is expected that the number
of emergency cases generated by the youngest
population cohort may decrease because of the
continuous decline observed in the number of cases
of the digestive system acute infectious diseases.
Conversely, hospitalization rates due to
cardiovascular diseases are systematically
increasing, particularly among the oldest population
groups. The second group of flow-rate drivers is
closely related to health system regulations and the
health policy strategy. The limited access to primary
care providers (PCPs) manifesting itself in long
waiting times to receive specialist care, results in the
significant increase in the number of non-acute
patients arriving to AU/EWs. The concept of the
policy-related flow-rate parameters is based on the
risk indicators that intensify or weaken the basic
level of the ER demand generated by the WR
population.
5 SIMULATION EXPERIMENTS
5.1 Model Testing
The simulation output measures are: the number of
the WR patients treated by the AU/EWs situated in
the WR and the number of the WR patients served
by the AU/EWs situated outside the region. Both
measures are calculated for the whole calendar year.
The simulation starts in 2007 and in the baseline
scenario we assume that no changes occur in policy
related flow-rate factors (these are invisible for the
simulation model and they do not influence the
model’s behaviour).
ASystemDynamicsModeltoStudytheImpactofanAgePyramidonEmergencyDemand
883

Figure 4: Female ER demand served by the WR providers.
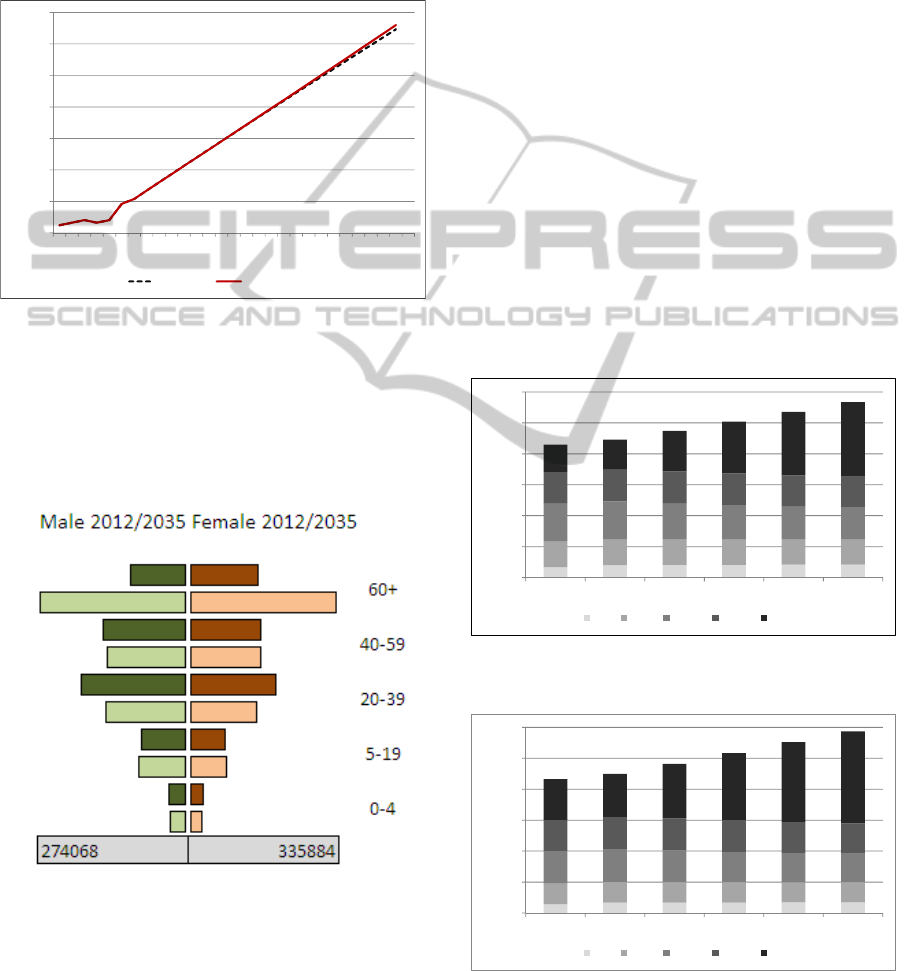
Validation was performed in two phases. First, the
population sub-model was tested for fit against
2007
–2012. Figure 5 presents two age pyramids for
2012: the dark coloured pyramid represents the
distribution of the WR population based on the
historical data published by GUS (2014). The light
coloured pyramid represents the simulation data.
Mean absolute percentage error shows that
simulation model provides good results for the
estimation of the WR population. For particular age
cohorts the value of the indicator ranges from 1.72%
to 11.53% (male population) and from 2.58% to
9.24% (female population).
Second, to determine whether the model properly
represents the volume of emergency demand, we
compared model output to the historical data
collected for the WR in 2010
–2011. The results
(Table 3 and Table 4) show how closely the
simulated output lies to the actual reported data. We
observe a slight underestimation in the simulation
results.
Figure 5: The comparison of the age pyramids of the WR
population built from the historical (dark colour) and
simulation (light colour) data.
SIMULTECH2014-4thInternationalConferenceonSimulationandModelingMethodologies,Technologiesand
Applications
884

Table 3: The comparison of the simulation and the
historical number of ER patients treated inside the WR.
Year Historical data Simulation Difference
Female patients
2010 89 979 87 814 -2.47%
2011 92 284 89 727 -2.85%
Male patients
2010 89 777 87 124 -3.04%
2011 92 094 89 027 -3.45%
Table 4: ER patients treated outside of the WR. The
comparison of the simulation and the historical data.
Year Historical data Simulation Difference
Female patients
2010 9 929 9 499 -4.53%
2011 1 0182 9 682 -4.93%
Male patients
2010 11 951 11 392 -4.91%
2011 12 412 11 732 -5.80%
5.2 What-if Scenarios
Four “what-if” scenarios were devised to illustrate
the potential of the suggested approach. The
simulation begins in 2007 and runs until 2035, with
time step equal to 0.01 (of the year).
Scenario 1: Birth rate increase
The first scenario simulates the birth rate increase.
According to some cautious forecasts, the new
parental leave regulations may reverse the actual
unfavourable trend and cause a noticeable increase
among the youngest population. We assume that
starting from 2015 the birth rates (both in male and
female population) will increase by 0.2% and this
trend will be maintained during four following years
(until 2019). Then, the birth rates will return to the
previous values.
Scenario 2: Demand increase in the oldest cohort
The second simulated scenario considers an increase
of acute cases due to morbidity rates growth
resulting from the diseases of the circulatory system
in the oldest population. We assume that starting
from 2015, the increased morbidity rates (in 60+
male and female cohorts) will generate 5%, 10%,
15% and 20% more emergency calls from the WR
oldest population than is observed today. Then, the
morbidity rates will remain on the increased level.
Scenario 3: Demand decrease in all age groups
The third simulated scenario features a reduction in
the number of emergency calls as a result of changes
in the global health policy. The common problem of
long waiting queues (often measured in months or
even years) for a consultation with a specialist
doctor, increases the volume of non-emergency
patients’ arrivals at AU/EWs. We tested the
consequences of some solutions that would lead to a
global reduction in the number of acute cases.
Scenario 4: Population projections
The fourth scenario uses assumptions formulated in
the long-term population projection prognostic
document constructed by GUS (2014). One of the
most optimistic forecasts published in the document,
foresees that starting from 2013: fertility rates will
increase, mainly because of social security system
reform; a favourable drop in death intensity will be
observed; an average life expectancy in 2035 will be
similar to the rates obtained in the developed
countries 17 years earlier; a mild decrease in the
migration streams will be observed.
5.3 Preliminary Scenario Comparison
Figure 6 shows a comparison of the first three
scenarios in terms of the impact on the total number
of emergency cases to arrive in the WR over time.
The greatest influence on acute demand has the
increased number of diseases of circulatory system
in the oldest population (Scenario 2). The aging of
the population and higher morbidity have amplified
the total demand and caused an increase in the
number of emergency patients in 2015. However,
even if the morbidity rates ceased to rise after 2019,
a more intense increase in acute demand would be
observed as compared to the baseline. Higher birth
rates will have a slight impact on the number of
emergency patients (Scenario 1). The simulated
decrease in the number of non-emergency arrivals at
AU/EWs, achieved through policy regulations
(Scenario 3), will reduce the acute demand
proportionally.
Figure 6: Impact of “what-if” scenarios on the emergency
arrivals in the WR.
150000
170000
190000
210000
230000
250000
270000
2007
2009
2011
2013
2015
2017
2019
2021
2023
2025
2027
2029
2031
2033
2035
baseline Scenario1 Scenario2 Scenario3
ASystemDynamicsModeltoStudytheImpactofanAgePyramidonEmergencyDemand
885
The favorable changes forecasted in the
optimistic prediction of the population projections
(Scenario 4) suggest a slight and continuous growth
in the number of ER patients (Figure 7). These
preliminary results show that because of the
increased fertility rates and extended life
expectancies the demand for hospital emergency
services will systematically grow.
Figure 7: Impact of long-term population projections on
the emergency arrivals in the WR.
Figure 8 compares the development of the age
pyramid of the WR population between 2012 and
2035, as predicted by the simulation model,
according to assumptions formulated in Scenario 4.
Figure 8: The comparison of the age pyramids of the WR
population built from the 2012 historical (dark colour) and
2035 simulation (light colour) data.
The simulation results for the year 2035 indicate
a decrease in the number of individuals within three
age groups (0
–4, 20–39 and 40–59) in comparison to
2012. Two age groups (5–19 and 60+) will however
experience the observable growth in the number of
persons. In particular, the oldest cohort will have to
face a rapid increase for both gender groups. The
number of women aged 60 and over will be higher
by 115.8% and the number of men – by 161.3%. The
total number of population in 2035 will increase by
21.5% in comparison to 2012.
The predicted changes in the structure of the WR
population will significantly influence the number of
ER patients served by AU/EW situated in the WR
(Figure 9 and 10). A detailed analysis of the age
groups requiring acute services shows that the total
number of patients not older than 60 will decrease
but the increased number of individuals from 60+
age groups (men and women) will dramatically raise
the overall demand. Those older than 60 are
responsible for the continuously growing share of
estimated ER needs. In particular, in 2035 this group
represents almost half of the total needs (Table 5).
Since older patients usually require the more costly
procedures during the ER treatment, the overall cost
of emergency services in 2035 is expected to be
much higher than in 2012.
Figure 9: Number of ER patients (men) classified
according to five age groups in the years 2007 - 2035.
Figure 10: Number of ER patients (women) classified
according to five age groups in the years 2007 - 2035.
170000
180000
190000
200000
210000
220000
230000
240000
2007
2009
2011
2013
2015
2017
2019
2021
2023
2025
2027
2029
2031
2033
2035
baseline Scenario4
0
20000
40000
60000
80000
100000
120000
2007 2012 2017 2022 2027 2032
0_4 5_19 20_39 40_59 60+
0
20000
40000
60000
80000
100000
120000
2007 2012 2017 2022 2027 2032
0_4 5_19 20_39 40_59 60+
SIMULTECH2014-4thInternationalConferenceonSimulationandModelingMethodologies,Technologiesand
Applications
886

Table 5: Percentage share of the age groups in the total
number of emergency cases. Simulation data 2035.
Age group [years] Female [%] Male [%]
0–4 3.7 4.3
5–19 11.0 12.8
20–39 20.2 21.8
40–59 21.3 21.6
60+ 43.8 39.5
Total 100.0 100.0
6 DISCUSSION AND FUTURE
DIRECTIONS
The model presented here extends our understanding
of the relations between the ongoing changes in the
WR population demography and the volume of
hospital emergency needs expressed by patients
arriving at AU/EWs situated in one of the Polish
regions. The simulations suggest that the NFZ will
have to tackle the problem of the growing demand
for hospital ER services over the coming years.
Although we have explored only a few of the
demography related factors, it is clear that the more
unfavourable scenario (e.g. Scenario 2: the increased
morbidity in particular cohorts) will amplify the ER
presentations.
Different age-gender segments of the population
have different shares among the total number of ER
patients. The significant delays between the initial
impulse in one cohort (e.g. the increased fertility
rates) and the resulting changes in the subsequent
cohort (e.g. the growth in a number of young men
generating the highest volume of acute cases) make
it difficult to formulate credible prognoses.
Therefore, although the potential direction of the
forecasted incentives is foreseeable, the magnitude
of the expected results is unknown. The simulation
model described in the paper aims to contribute to
filling this gap by studying the consequences of the
population dynamics on the emergency needs
expressed by patients arriving to AU/EW in the
region.
This paper describes work in progress and we
plan to study the relationships between the
demographic factors and the ER presentations to a
greater extent. For example, the shift in the mean
age at childbearing and relationship formation to
higher age groups will change the structure of the
age pyramid and, consequently, the level of cohort
related emergency needs. Further, the interesting but
not yet empirically examined influence of such
qualitative aspects as investigation of the policy
related incentives is also planned. Facilitating access
to primary care and encouraging a shift to PCPs
could decrease the number of patients arriving to
AU/EWs.
The study presented in this paper also needs a
stronger empirical analysis of the qualitative
parameters. Future work will focus on performing
sensitivity analyses to determine the impact of
uncertainty surrounding parameter values. We plan
to use system dynamics approach to formulate valid
demand forecasts that could be used by a discrete
simulation model to assess the volume of services to
be contracted by NFZ in particular AU/EWs in the
region.
ACKNOWLEDGEMENTS
This project was partially financed by a Grant from
the National Science Centre based on decision DEC-
2011/01/B/HS4/ “Simulation methods and computer
simulation models in healthcare management”.
REFERENCES
Bowers, J. & Mould, G. 2004, "Managing uncertainty in
orthopaedic trauma theatres", European Journal of
Operational Research, vol. 154, no. 3, pp. 599-608.
Brailsford, S.C., Lattimer, V.A., Tarnaras, P. & Turnbull,
J.C. 2004, "Emergency and on-demand health care:
modelling a large complex system", The Journal of the
Operational Research Society, vol. 55, no. 1, pp. 34-
42.
Cabrera, E., Taboada, M., Iglesias, M.L., Epelde, F. &
Luque, E. 2011, "Optimization of healthcare
emergency departments by agent-based simulation",
Procedia Computer Science, vol. 4, no. 0, pp. 1880-
1889.
Demir, E., Lebcir, R. & Adeyemi, S. 2014, "Modelling
length of stay and patient flows: methodological case
studies from the UK neonatal care services", The
Journal of the Operational Research Society, vol. 65,
no. 4, pp. 532-545.
Diaz, R., Behr, J.G. & Tulpule, M. 2012, "A system
dynamics model for simulating ambulatory health care
demands", Simulation in Healthcare, vol. 7, no. 4, pp.
243-250.
ExtendSim. 2013, Extendsim User Guide, Imagine That
Inc. Available: www.Extendsim.com [2014, May].
GUS. 2014, Główny Urząd Statystyczny. Available:
www.stat.gov.pl [2014, May].
Harper, P.R., Phillips, S. & Gallagher, J.E. 2005,
"Geographical simulation modelling for the regional
planning of oral and maxillofacial surgery across
London", The Journal of the Operational Research
Society, vol. 56, no. 2, pp. 134-143.
ASystemDynamicsModeltoStudytheImpactofanAgePyramidonEmergencyDemand
887

Hoard, M., Homer, J., Manley, W., Furbee, P., Haque, A.
& Helmkamp, J. 2005, "Systems modeling in support
of evidence-based disaster planning for rural areas",
International journal of hygiene and environmental
health, vol. 208, no. 1–2, pp. 117-125.
Homer, J., Hirsch, G., Minniti, M. & Pierson, M. 2004,
"Models for collaboration: how system dynamics
helped a community organize cost-effective care for
chronic illness", System Dynamics Review (Wiley),
vol. 20, no. 3, pp. 199-222.
Jacobson, S.H., Sewell, E.C. & Weniger, B.G. 2001,
"Using Monte Carlo simulation to assess the value of
combination vaccines for pediatric immunization" in
Proceedings of the 33nd Winter Simulation
Conference IEEE Computer Society, Washington, DC,
USA, pp. 1421-1428.
Kasaie, P., Kelton, W.D., Vaghefi, A. & Naini, S.G.R.J.
2010, "Toward optimal resource-allocation for control
of epidemics: an agent-based-simulation approach",
Proceedings of the 2010 Winter Simulation
Conference, pp. 2237-2248.
Krejci, I., Kvasnicka, R. & Svasta, J. 2011, "Dynamic
aging chain of the Czech Republic population", Acta
Universitatis et Silviculturae Mendelianae Brunensis,
vol. LIX (7), pp. 209-216.
Lagergren, M. 1998, "What is the role and contribution of
models to management and research in the health
services? A view from Europe", European Journal of
Operational Research, vol. 105, no. 2, pp. 257-266.
Lane, D.C., Monefeldt, C. & Rosenhead, J.V. 2000,
"Looking in the wrong place for healthcare
improvements: A system dynamics study of an
accident and emergency department", The Journal of
the Operational Research Society, vol. 51, no. 5, pp.
518-531.
Luke, D.A. & Stamatakis, K.A. 2012, "Systems science
methods in public health: dynamics, networks, and
agents", Annual Review of Public Health, vol. 33, no.
1, pp. 357-376.
Martin, S., Rice, N., Jacobs, R. & Smith, P. 2007, "The
market for elective surgery: Joint estimation of supply
and demand", Journal of health economics, vol. 26,
no. 2, pp. 263-285.
Mielczarek, B. & Uziałko-Mydlikowska, J. 2012,
"Application of computer simulation modeling in the
health care sector: a survey", Simulation, vol. 88, no.
2, pp. 197-216.
Mielczarek, B. 2013, "Using discrete-event simulation to
forecast the volume of hospital emergency services to
be delivered at the regional level", SIMULTECH 2013
- Proceedings of the 3rd International Conference on
Simulation and Modeling Methodologies,
Technologies and Applications, pp. 197-203.
Mielczarek, B. 2014, "Simulation modelling for
contracting hospital emergency services at the regional
level", European Journal of Operational Research,
vol. 235, no. 1, pp. 287-299.
Mustafee, N., Katsaliaki, K. & Taylor, S.J.E. 2010,
"Profiling literature in healthcare simulation",
Simulation, vol. 86, no. 8-9, pp. 543-558.
Sterman, J.D. 2000, Business dynamics. System thinking
and modeling for a complex world, McGraw-Hill
Higher Education, USA.
Taylor, K. & Dangerfield, B. 2005, "Modelling the
feedback effects of reconfiguring health services", The
Journal of the Operational Research Society, vol. 56,
no. 6, pp. 659-675.
Vanderby, S. & Carter, M.W. 2010, "An evaluation of the
applicability of system dynamics to patient flow
modelling", The Journal of the Operational Research
Society, vol. 61, no. 11, pp. 1572-1581.
Whitworth, M.H. 2006, "Designing the response to an
anthrax attack", Interfaces, vol. 36, no. 6, pp. 562-568.
Wong, H.J., Morra, D., Wu, R.C., Caesar, M. & Abrams,
H. 2012, "Using system dynamics principles for
conceptual modelling of publicly funded hospitals",
The Journal of the Operational Research Society, vol.
63, no. 1, pp. 79-88.
SIMULTECH2014-4thInternationalConferenceonSimulationandModelingMethodologies,Technologiesand
Applications
888
