
Mobility, Accessibility and Safety of People with Cerebral Palsy
Ana Marta Carvalho
1
, Alireza Asvadi
1
, Carlos Carona
2
, Ana Lopes
1
and Urbano Nunes
1
1
Institute of Systems and Robotics, University of Coimbra, DEEC - P´olo II, Coimbra, Portugal
2
Coimbra Cerebral Palsy Association, Cognitive and Behavioral Center for Research and Intervention,
University of Coimbra, Coimbra, Portugal
Keywords:
Cerebral Palsy, Mobility, Accessibility, Safety, Powered Wheelchair, Improvement, Assistive Navigation.
Abstract:
This research characterizes mobility, accessibility and safety of individuals with severe motor impairment such
as users suffering from Cerebral Palsy (CP). Through the analysis of enabling factors, constraints associated
and the search of possible improvements, it is possible to identify the needs in these fields and subsequently
develop strategies accordingly. The sample was collected in Coimbra Cerebral Palsy Association (APCC)
and it included 16 individuals with CP. To these individuals we gave an evaluation protocol with a form with
clinical and sociodemographic data and a questionnaire. The main limiting factors include building/vehicle
access, difficulty in reverse drive and lack of safety. The most valued features of a powered wheelchair are
comfort and structure, easy navigation and wheelchair control and safety. The lack of safety in the outdoors
was a relevant limiting factor. Almost all individuals requested improvements of the powered wheelchair. The
most requested improvements were safety related or related with navigation problems. An assistive navigation
solution based on a shared control algorithm is presented, where a powered wheelchair is equipped with the
Kinect sensor, in order to help the user maneuvering the wheelchair safely.
1 INTRODUCTION
Cerebral palsy (CP) is a complex medical and non-
progressive condition, that is characterized by cogni-
tive and motor disturbances, and it is a consequence
of the damage of specific brain areas caused before,
during or shortly after birth (Koman et al., 2003).
According to the data obtained from the National
Health Interview Survey from 1988 (Health Statis-
tics and Health & Human Services, 1988), CP ap-
pears as the most disabling clinical situation, involv-
ing the largest number of annual medical contacts and
also the largest number of hospital admissions dur-
ing the year. CP is also the most common disability
in childhood and the trend is to increase its preva-
lence over the last decades (Vargus-Adams, 2003).
Due to accessibility and quality improvement of med-
ical care provided to individuals with CP, the aver-
age life expectancy for this group has increased sig-
nificantly. Therefore, before 1950 few people with
CP survived until adulthood and now is expected that
65% to 90% of children with CP can live past adult-
hood (Zaffuto-Sforza, 2005). However, despite the
increasing prevalence of CP, the medical innovation
and development, observed in the 1970s and 1980s,
contributed to a significant increase in average life ex-
pectancy, which boosted the research to understand
how the CP can affect the quality of life (QOL) of
these individuals, including their levels of mobility
and participation (Kennes et al., 2002; Wake et al.,
2003). Research results show that children with CP
have a more impaired QOL in all domains when com-
pared with other able-body children (Vargus-Adams,
2003; Varni et al., 2007), but another study concludes
that the QOL of this group is only lower in the phys-
ical domain and not in the psychological and social
domains (Dickinson et al., 2007). The QOL of adults
with CP is significantly affected in all domains as-
sessed by The World Health Organization Quality
of Life (WHOQOL-BREF): Physical, Psychological,
Social Relationships and Environment (Carona et al.,
2010). More specifically, when compared to other
able-body adults, they reported a lower QOL in the
physical domain (mobility) and in the environment
domain (participation and/or opportunities for recre-
ation and leisure and transportation).
This work aims to research new technologies
that may contribute to the mobility, accessibility and
safety improvement of individuals with CP. We aim
to provide results to support the design and develop-
ment of more suitable solutions to improve mobility,
accessibility and safety. With the overall goal to char-
268
Amaral de Carvalho A., Asvadi A., Carona C., Lopes A. and Nunes U..
Mobility, Accessibility and Safety of People with Cerebral Palsy.
DOI: 10.5220/0005185502680275
In Proceedings of the International Conference on Health Informatics (HEALTHINF-2015), pages 268-275
ISBN: 978-989-758-068-0
Copyright
c
2015 SCITEPRESS (Science and Technology Publications, Lda.)

acterize all three factors referred above, this research
work was organized as follows: (1) Characterization
of subject’s mobility, public transportation use and
Human-Machine Interface (HMI); (2) Relation be-
tween HMIs and powered wheelchair steering perfor-
mance; (3) Identification of most valued features and
limiting factors in the use of powered wheelchairs; (4)
Analysis of possible solutions to be implemented in a
powered wheelchair. The lack of safety and the diffi-
culty in navigating the powered wheelchair were gen-
erally pointed out as the most limiting factors, which
means there is the need to develop more suitable so-
lutions to improve navigation and safety. A solution
to address both of these problems is to install more
sensors in the powered wheelchair, providing addi-
tional information of the environment and to intro-
duce a new navigation system based on a collabora-
tive controller that shares the information between the
user and the machine. In our case, we decided that
Kinect, a sensor that provides 3D information of the
environment, has certain features that makes it a po-
tential choice:
- It is a compact and lightweight sensor which pro-
vides both RGB and range images;
- It gathers 3D information of the powered
wheelchair’s surrounding from a 3D field-of view;
- It is a low cost solution;
- It works at a frequency of 30 Hz;
- Operation range acceptable for indoor environ-
ments: from 0.6 to 3.5m. However, the use of
Kinect to provide environment data to a reactive nav-
igator based on a 2D space representation presents
two difficulties: (a) the huge amount of data it pro-
vides and (b) the existence of a blind zone both at
short distance and because of the narrow horizon-
tal field-of-view (in comparison to laser radial scan-
ners) (Gonzalez-Jimenez et al., 2013). The current re-
search was based on the work done previously under
the research project Interface10 - Emergent Interfaces
for Improving Accessibility of Persons with Cerebral
Palsy (Carona et al., 2012), (Lopes et al., 2013).
2 APPROACH / METHODOLOGY
2.1 Participants
The sample for this study included 16 individuals and
was collected at APCC, between December 2013 and
March 2014, based on the following inclusion crite-
ria: (1) clinical diagnosis of CP; (2) ability to under-
stand questions and provide answers accordingly; (3)
use of a powered wheelchair; (4) minimum age of 15
years. After obtaining APCC’s formal authorization,
participants were selected by their teams of clinical
follow-up, based on the inclusion criteria listed above.
Before filling out the questionnaires, all participants
gave informed consent.
2.2 Tools
The evaluation protocol of this study was composed
of the following tools:
1. Clinical and sociodemographic data form:
questionnaire filled out jointly by the researcher and
the technician responsible for monitoring the subject,
which contains the following information: age, gen-
der, type of CP and associated problems;
2. Gross Motor Function Classification System
for Cerebral Palsy - GMFCS-CP (Palisano et al.,
1997): grading scale of the degree of impairment,
structured in five levels, in which the Level 1 is the
lowest and level 5 the highest. The grading is based
on functional limitations, the need of use of mobil-
ity aids or wheelchairs and also on the quality of
movement. Level 1 and 2 are for manual wheelchair
users. Since in this research we are studying powered
wheelchair users, we are only interested in level 3,
4 and 5. Level 3 is for individuals that need to use
a powered wheelchair in more complicated places,
but for short distances or in easier places to navi-
gate, a manual wheelchair will be enough to ensure
their mobility. Level 4 is for users that can only get
their autonomous mobility with the help of a powered
wheelchair. Level 5 is for users whose mobility is se-
riously compromised. Physical problems limit volun-
tary control of the movements and the control of the
head and trunk.
3. Questionnaire for mobility, accessibility and
safety characterization: questionnaire filled out by
the subject or with the researcher’s help, with mul-
tiple choice questions, organized into four parts: (1)
characterization of (a) subject’s mobility, (b) use of
public transportation and (c) HMIs; (2) characteriza-
tion of the use of assistive mobility technologies; (3)
most valued features and limiting factors in the use of
the powered wheelchair; (4) possible improvements
of the powered wheelchair.
3 RESULTS
3.1 Sample Characterization
In Table 1 we can see the clinical and sociodemo-
graphic characterization of the sample.
The collected sample (n = 16) had an average age
of 29,80. The most observed type of CP was spastic
Mobility,AccessibilityandSafetyofPeoplewithCerebralPalsy
269

Table 1: Clinical and sociodemographic data.
Age (M) 29,80
Gender (n/%)
Female 3/18,75
Male 13/81,25
Type of Cerebral Palsy (n/%)
Spastic 11/68,75
Dystonic 4/25,00
Ataxic 1/6,25
Additional associated Problems (n/%)
No additional associated problems 6/37,50
Visual problems 5/31,25
Epilepsy 2/12,50
Intellectual problems 2/12,50
Hearing problems 2/12,50
Degree of Impairment
(GMFCS-CP) (n/%)
Level III 2/12,50
Level IV 11/68,75
Level V 3/18,75
(68,75%), followed by dystonic (25,00%) and ataxic
(6,25%). Analyzing other health problems associ-
ated with CP (besides motor impairment), 37,50%
of the cases do not present any additional associ-
ated problems, although 31,25% experience visual
deficits, 12,50% intellectual deficits, 12,50% epilepsy
and 12,50% hearing deficits. According to the in-
clusion criteria associated with the use of an assis-
tive technology to improve mobility, most individuals
(68,75%) are level 4 in the grading scale of the degree
of impairment, 18,75% of the individuals are level 5
and the rest (12,50%) of the subjects are level 3.
3.2 Characterization of Accessibility,
Mobility and Support
Almost all individuals with CP (93,75%) reported be-
ing able to move autonomously with the help of a
powered wheelchair. The number of individuals who
reported not using public transportation (although
they wanted to) is very high (87,50%). This some-
how reflects the inadequacy in the access to public
transportation, in which individuals with CP are par-
ticularly vulnerable. Finally, a relatively small per-
centage (25,00%) of people in the group of subjects
need HMIs for computer use. These results can be
verified in Table 2.
Table 2: Characterization of accessibility, mobility and sup-
port.
Yes (n/%) No (n/%)
Do you have the possi-
bility of moving autono-
mously with the powered
wheelchair? 15/93,75 1/6,25
Do you use public
transportation? 2/12,50 14/87,50
Do you use HMIs for
computer use? 4/25,00 12/75,00
3.3 Experience in Using the HMIs and
Powered Wheelchair vs Quality of
Performance
All subjects participating in this study were consid-
ered experienced users steering a powered wheelchair
since they have several years of experience using it.
Table 3: Level of performance with the HMIs.
HMIs for powered wheelchair
navigation (n/%)
Joystick 13/81,25
Pedal Technology 1/6,25
Head interface with sensors 1/6,25
Chin Technology 1/6,25
Level of performance with HMIs for
powered wheelchair navigation (n/%)
Level 3 3/18,75
Level 4 3/18,75
Level 5 10/62,50
HMIs for computer use (n/%)
Chin Pointer 2/50,00
Pedal Technology 1/25,00
SmartNav - Infrared Technology 1/25,00
Missing=12 (n=4)
Level of performance with HMIs
for computer use (n/%)
Level 5 4/100,00
Missing=12 (n=4)
Level of steering performance
in the powered wheelchair (n/%)
Level 3 3/18,75
Level 4 7/43,75
Level 5 6/37,50
Analyzing Table 3, it is possible to see that all the
users of HMIs for computer use and most individu-
als (62,50%) using the HMIs required for steering the
powered wheelchair, considered themselves in a level
5 of performance. Most of the subjects (81,25%) in
this research use a joystick to help the navigation of
HEALTHINF2015-InternationalConferenceonHealthInformatics
270

the powered wheelchair.
Many of the users (43,75%) were classified as
level 4 in terms of steering performance of the pow-
ered wheelchair and also, that a significant percentage
(37,50%) were classified as level 5.
3.4 Most Valued Features and Limiting
Factors in the Use of Assistive
Technologies for Mobility
In Table 4 we can see that the most valued features
of a powered wheelchair are its comfort and struc-
ture (68,75%), easy navigation and wheelchair con-
trol (56,25%) and finally, safety (43,75%). The main
limiting factors in a powered wheelchair are the diffi-
culty in reverse drive (37,50%) and building/vehicle
access (31,25%). Also 12,50% of the individuals
complained about the lack of safety.
Table 4: Most valued features and limiting factors in a pow-
ered wheelchair.
Most valued features in a wheelchair
Frequency
(n/%)
Comfort/Positioning 11/68,75
Easy navigation and
wheelchair control 9/56,25
Safety 7/43,75
Dimension 2/12,50
Not specified 2/12,50
Limiting factors of powered
wheelchair use
Frequency
(n/%)
Difficulty in reverse drive 6/37,50
Building/vehicle access 5/31,25
Mechanical aspects 3/18,75
Dimension 3/18,75
Safety 2/12,50
Design 1/6,25
Complicated interfaces 1/6,25
Control and navigation of
the wheelchair 1/6,25
Impractical belt 1/6,25
Not specified 3/18,75
The architectural barriers were identified as the
main factor limiting the powered wheelchair use at
home (75,00%) and in the outdoors (87,50%). An-
other relevant limiting factor is again the difficulty in
reverse drive at home (18,75%) and lack of safety in
public places (31,25%).
The powered wheelchair inadequacy (75,00%),
the limitations of the vehicles (31,25%) and the ve-
hicle adaptation costs (25,00%) on one hand, and the
lack of adapted transports and complexity of its use
(both referred by all the public transportation users),
Table 5: Limiting factors in the use of assistive technologies
for mobility.
Limiting factors of the powered
wheelchair use at home
Frequency
(n/%)
Architectural barriers 12/75,00
Reverse drive 3/18,75
Strain caused by the
powered wheelchair use 2/12,50
Fatigue 1/6,25
Powered wheelchair inadequacy 1/6,25
No limitation 2/12,50
Limiting factors of the
outdoor access
Architectural barriers 14/87,50
Safety 5/31,25
Strain caused by the
powered wheelchair use 1/6,25
Fatigue 1/6,25
No limitation 1/6,25
Limiting factors in the
private transportation use
Powered wheelchair inadequacy 12/75,00
Vehicle limitation 5/31,25
Vehicle adaptation costs 4/25,00
Difficulty placing the powered
wheelchair in the vehicle 3/18,75
No limitation 2/12,50
Limiting factors in the public
transportation use
Complexity of the usage 2/100,00
Shortage of transportation 2/100,00
Missing=14 (n=2)
on the other hand, were the main limiting factors men-
tioned for the use of private and public transportation,
respectively.
The results above can be seen in Table 5. We were
able to get a perception of the mobility and accessi-
bility difficulties and also concluded that many of the
complaints were related with the lack of safety and
how relevant this issue is or related with the lack of
an appropriate assistive navigation system to help ma-
neuvering the powered wheelchair.
3.5 Possible Improvements of the
Powered Wheelchair
Since one of the goals of this research is to help im-
prove the QOL of people with CP, the subjects of this
study were asked if their powered wheelchair could
be improved in any way, and almost all of them an-
swered positively (93,75%), as seen in Table 6.
In Table 7 is possible to see the most requested im-
provements: aid for reverse drive (40,00%), collision
Mobility,AccessibilityandSafetyofPeoplewithCerebralPalsy
271
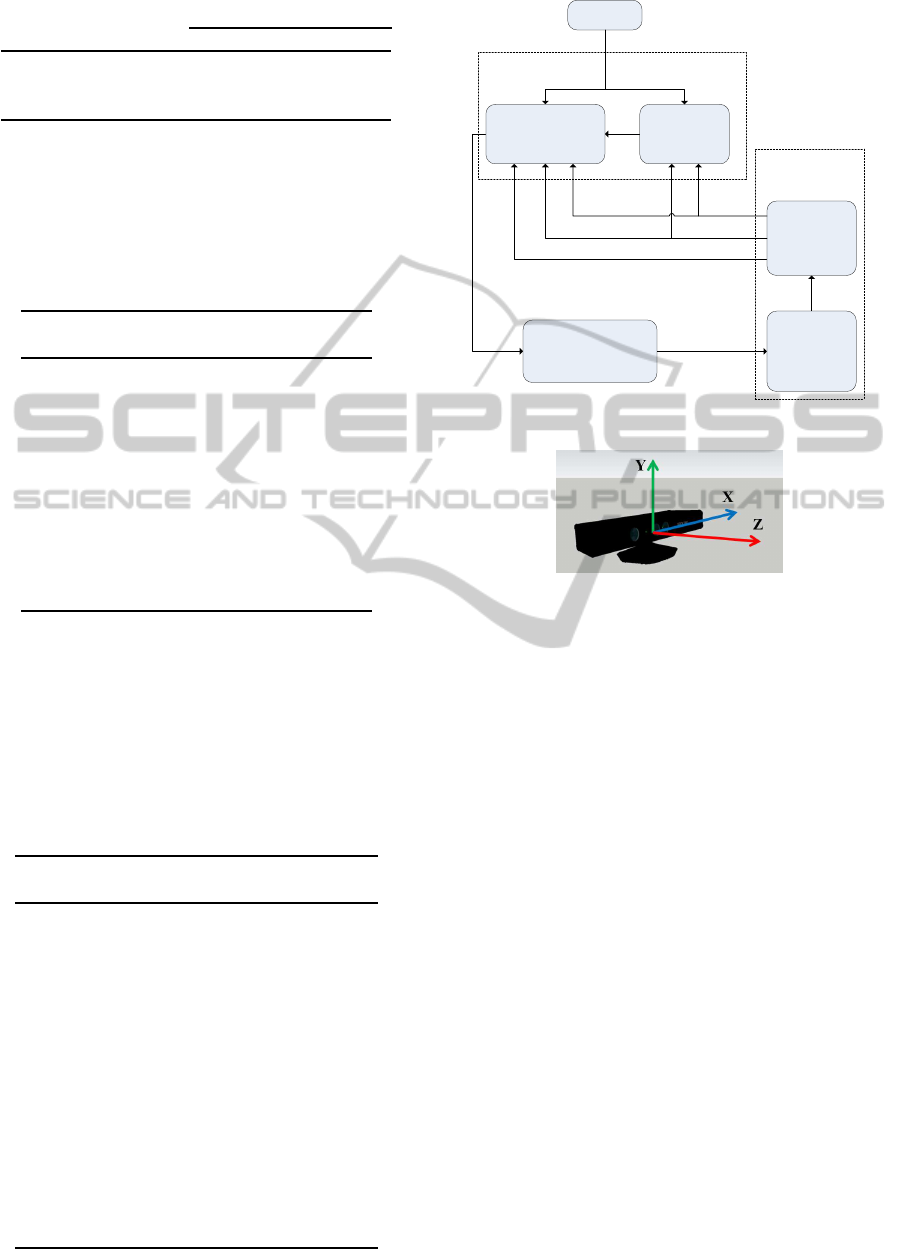
Table 6: Powered wheelchair improvement.
Yes (n/%) No (n/%)
The powered wheel-
chair can be impro-
ved in any way? 15/93,75 1/6,25
avoidance (26,67%), a warning during reverse driv-
ing (26,67%), reverse driving information (26,67%),
comfort/structure improvement (20,00%), assistance
in navigation in more complicated places (13,33%).
Table 7: Most requested powered wheelchair improve-
ments.
Possible improvements
Frequency
(n/%)
Aid for reverse drive 6/40,00
Collision avoidance 4/26,67
Warning during reverse
driving
4/26,67
Reverse driving
information
4/26,67
Comfort/structure
improvement
3/20,00
Assistance in navigation
in more complicated places
2/13,33
Missing=1 (n=15)
Table 8 shows the least requested powered
wheelchair improvements. With the results men-
tioned in Table 7, we can conclude that most of the
suggested improvements (57,14%) affect safety and
could be solved by installing more sensors in the pow-
ered wheelchair and by introducing a new navigation
system.
Table 8: Least requested powered wheelchair improve-
ments.
Possible improvements
Frequency
(n/%)
Wheelchair that lifts 1/6,67
Rear camera/mirror 1/6,67
Wheelchair that lies down 1/6,67
Retracting pedal 1/6,67
Bumper (soften ball
impact in football)
1/6,67
Chance of driving the
wheelchair vertically
1/6,67
Flashers 1/6,67
Autonomous wheelchair 1/6,67
Wheelchair with lights 1/6,67
Buttons design improvement 1/6,67
Improvement of speed
control with the joystick
1/6,67
Missing=1 (n=15)
Collaborative Control
Module
Joystick
Reactive Collision
Avoidance
Risk
Assessment
Obstacle
Detection
Multi-level
2.5D data
processing
Mobile Assistive
Robot
Local Perception
Module
Risk
level
Three 2D
scans
Point cloud
v, w
Safe direction
Obstacles z coordinates
v, w
Number of obstacles
Figure 1: Block diagram of the ANS architecture.
Figure 2: X, Y and Z coordinates of the installed Kinect
sensor.
4 ASSISTIVE NAVIGATION
SYSTEM
In this section we describe the proposed solution
for the control and safe navigation of the powered
wheelchair structured in the Assistive Navigation
System (ANS) shown in Figure 1, which integrates
a human-machine collaborative controller. The ANS
requires an effective model of the local environment,
obtained through the use of a Kinect sensor.
4.1 Local Perception
The Local Perception Module is composed by the
multi-level 2.5D data processing and obstacle detec-
tion submodules.
4.1.1 Multi-level 2.5D Data Processing
The 3D depth data (point cloud) receivedfrom Kinect,
is divided into three 2.5D horizontal scans (one for the
top, one for the middle and one for the bottom) to de-
crease the computational complexity. The 2.5D scans
are composed by the minimum measured distance in
HEALTHINF2015-InternationalConferenceonHealthInformatics
272

each column of depth data (Z-array). The minimum
distance for each 2.5D scan is computed by
Z
′
= min(Z
0, j
, Z
1, j
, ..., Z
479, j
) (1)
where j is the respective column number in the depth
image (Rockey, 2013). Y and X locations for the cor-
responding Z elements are respectively provided in
480x1 and 640x1 arrays. Since the robot can only
move in the X-Z plane, the Y (height) coordinate is
ignored (see Figure 2). The data in Z and X arrays in-
dicate the nearest obstacle locations regardless of the
vertical position of obstacles.
An example of the Kinect point cloud and result-
ing 2.5D scans (2.5D scan resulting from the entire
3D field-of-view and multilevel 2.5D scans) obtained
by the proposed method, as well as the 2D scan of the
environment provided by a 2D laser range finder are
shown in Figure 3.
Kinect has the disadvantage of close range blind
spot, and, due to that, it is not reliable when obstacles
are closer than 0.6 meters and it is blind in distances
less than 0.5 meters. The 3D depth data from Kinect is
condensed into three 2.5D scans, corresponding to the
top, middle and bottom volumes. With this methodol-
ogy it is possible to identify obstacles at three differ-
ent height levels, which allows the Mobile Assistive
Robot (MAR) to identify and approach certain ob-
stacles such as tables or desks and at the same time,
avoiding obstacles that could threaten its safety.
4.1.2 Obstacle Detection
The obstacle detection methodology is based on the
VFH method (Borenstein and Koren, 1991). Each of
the three 2.5D scans provided in the previous step is
divided into 5 angular sectors, which are analyzed to
find the closest obstacle in each sector. The number
of obstacles and the distance to each obstacle are ob-
tained through the analysis of the 2.5D scans. There-
fore, if an obstacle in a certain sector has a value (dis-
tance) less than a given threshold, it will be consid-
ered as an actual obstacle that can endanger the user
safety, or that can be approached, depending on the
user’s intent and on the 2.5D scan under analysis.
A second analysis is performed to detect the sec-
tor(s) with highest obstacle density. This information
is then provided to the reactive collision avoidance
module, indicating the obstacle weight values of each
sector.
4.2 Collaborative Control
The Collaborative Control Module has a central role
in the ANS. It decides, according to the perceived sit-
uation, whether to give all the power to the user or to
the machine, or to merge user and machine inputs. It
is composed by Risk Assessment and Reactive Colli-
sion Avoidance submodules.
4.2.1 Risk Assessment
This submodule evaluates the current situation and
makes an appropriate decision according to the infor-
mation obtained by the Local Perception module (see
Figure 1). The algorithm selects the sector with the
closest obstacle (the most dangerous sector) among
all sectors, and classifies the current situation accord-
ing to the relative position of the MAR to that sector:
- Obstacles at a distance greater than 0.9 m present
no risk to the user (risk level 0).
- Obstacles that are located between 0.6 and 0.9 m
are classified as potential obstacles. Obstacles in this
class are later sub-divided in medium risk obstacles,
those located in a distance between 0.75 and 0.9 me-
ters (risk level 1 or 2), and high risk obstacles those lo-
cated in a distance between 0.6 and 0.75 meters (risk
level 3 or 4).
- Obstacles at a distance less than 0.6 m represent
eminent danger (risk level 5).
The current direction taken by MAR also affects
the risk level classification. User can move towards
the obstacle or go away from obstacles. The closer
the obstacles are, the greater is the risk.
4.2.2 Reactive Collision Avoidance
The main objective of the Reactive Collision Avoid-
ance submodule is to avoid the obstacles in the vicin-
ity of the MAR. The algorithm takes into account the
number of obstacles in the sectors, the safest direction
to follow, the distance to the obstacle and the angular
and linear speed commands that the user is providing
to the MAR. It acts as a Traded Controller and effec-
tively denies or allows the user commands or acts as
a Shared Controller by combining the robot naviga-
tion commands with the user commands. It assists
user for maneuvering in more complicated situations
as well as avoiding collision in order to achieve a bet-
ter level of safety. The rules composing the reactive
navigation are:
- Traded Control - in this case the steering con-
trol is fully delegated to the user or to the MAR: 1)
When there are no obstacles in risky area, the user
commands are followed, constrained by a maximum
speed value due to safety reasons; 2) If an obstacle is
endangering the user safety, the MAR stops and turns
until a safe direction is found.
- Shared Control - in this case the control is shared
between the user and the MAR: 1) When the user is in
a medium risk situation the maximum linear speed is
Mobility,AccessibilityandSafetyofPeoplewithCerebralPalsy
273
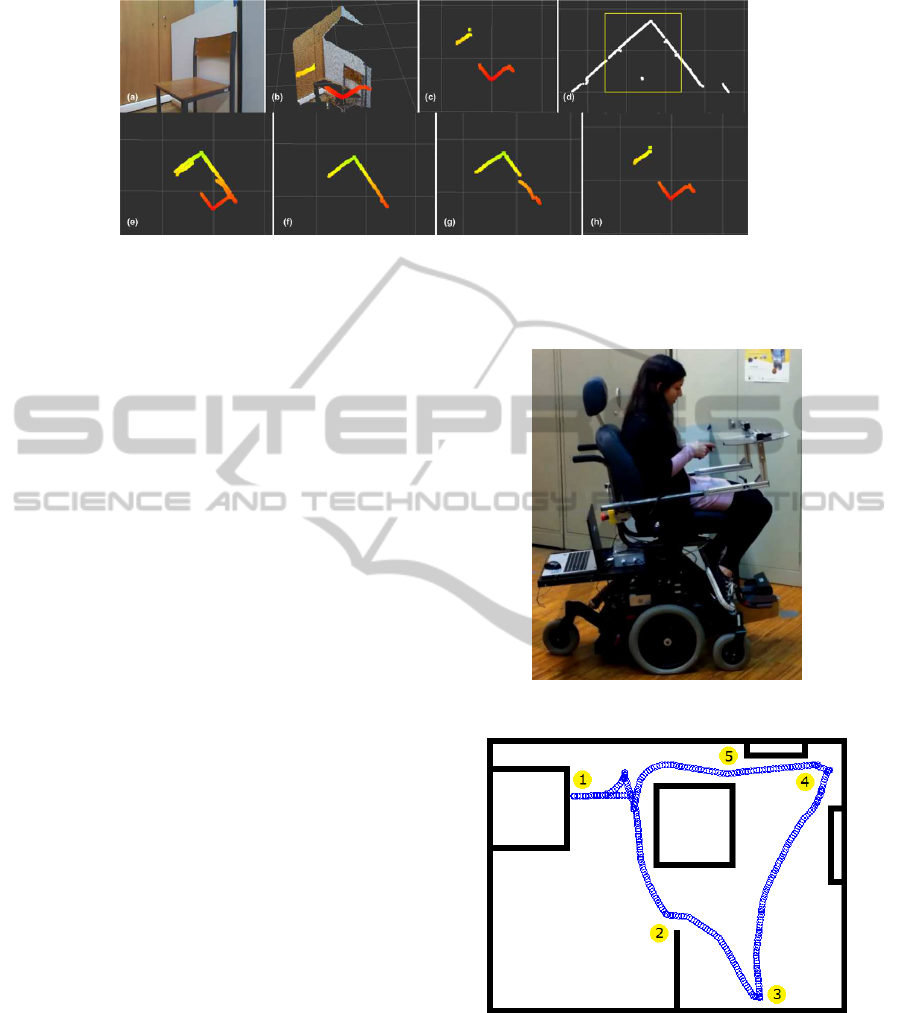
Figure 3: (a) Kinect RGB image, (b) Kinect’s pointcloud and the 2.5D scan resulting from the entire 3D field-of-view, (c) the
Kinect’s 2.5D scan resulting from the 3D field-of-view, (d) 2D scan from Hokuyo URG-04LX laser scanner with the Kinect’s
field-of-view highlighted in yellow, (e) sum of the three level 2.5D scans provided by Kinect, f) the top 2.5D scan, g) the
middle 2.5D scan and h) the bottom 2.5D scan.
reduced for safety reasons. When the user is moving
towards an obstacle the linear speed is even more re-
duced and varies with distance; 2) In a high risk situa-
tion, the reactive navigation will affect both linear and
angular speeds. Linear speed is reduced proportion-
ally to the MAR distance to the obstacle. The MAR
rotates towards a safe direction, which is chosen ac-
cording to the sectors with lower obstacle density.
The reactive navigation module was developed in
a way to lead the MAR avoid deadlocks (U-shaped
obstacles), by using a short term memory, which
stores the number of perceivedobstacles in the robot’s
vicinity. RobChair (Lopes et al., 2012), (Lopes et al.,
2013) was the MAR used in the experiments (see Fig-
ure 4). An example of a trajectory performed in a real
test experiment is shown in Figure 5. Some situations
can be underlined:
Situation 1: In this situation, the user successfully
approached the table. The MAR identified it as a safe
situation since this obstacle had the features (height)
of a table. The control was delegated to the user.
Situation 2, 3 and 4: The user steered the
wheelchair to approach obstacles and the MAR suc-
cessfully avoided them. Because the user was quickly
navigating towards the obstacles, the traded control
was activated almost immediately in order to prevent
a collision. The control was delegated to the MAR.
Situation 5: Shared control was activated since the
user tried to approach the side of a table. Once the
user was navigating slower than in the previous situa-
tions, traded control was not activatedsince the shared
controller commands were able to deviate the MAR
and avoid collision with the obstacle.
5 CONCLUSION AND FUTURE
WORK
This paper presents the characterization of mobility,
Figure 4: RobChair - Mobile Assistive Robot.
Figure 5: MAR navigation trajectory in ISR test scenario.
accessibility and safety in a group of individuals with
Cerebral Palsy. The results suggest that user expe-
rience in steering the powered wheelchair is a deci-
sive factor for a good level of performance. Younger
users can have increased troubles driving the pow-
ered wheelchair due to the lack of experience, there-
fore contributing to a more complex navigation and
compromised safety. Combining these results with
HEALTHINF2015-InternationalConferenceonHealthInformatics
274

the suggested improvements by the users, we con-
cluded that the lack of safety and the difficulty in nav-
igating the powered wheelchair were the most limit-
ing factors, in general, and also the most suggested
(57,14%) to be improved. The ANS was tested both
in simulated environment conditions and in real con-
ditions. The promising results show that the collab-
orative controller and other modules of the ANS ar-
chitecture compose a structure on which it is worth
continuing to devote research effort.
Future work includes adding short range sensors
for close distances, improving the collaborative con-
trol methodology to allow safe navigation in human
environments, and also solving other remaining issues
pointed out by powered wheelchair users. Getting a
larger user sample could also point us toward future
research directions.
ACKNOWLEDGEMENTS
This work has been supported by the FCT project
”AMS-HMI2012 - RECI/EEI-AUT/0181/2012” and
project ”ProjB-Diagnosis and Assisted Mobility
- Centro-07-ST24-FEDER-002028” with FEDER
funding, programs QREN and COMPETE.
REFERENCES
Borenstein, J. and Koren, Y. (1991). The vector field
histogram-fast obstacle avoidance for mobile robots.
Robotics and Automation, IEEE Transactions on,
7(3):278–288.
Carona, C., Canavarro, M. C., Pereira, M., Vaz-Serra, A.,
Quartilho, M., Paredes, T., Rijo, D., Gameiro, S., and
Sim˜oes, M. (2010). Qualidade de vida de indiv´ıduos
adultos com paralisia cerebral e dos seus cuidadores
familiares. In Qualidade de vida e sa´ude – Uma
abordagem na perspectiva da Organizac¸˜ao Mundial
de Sa´ude (in Portuguese). Fundac¸˜ao Calouste Gul-
benkian.
Carona, C., Reis, P., Almeida, L., Pires, G., Lopes, A.,
Almeida, A., Machado, D., Vaz, L., Moita, F., Carid´a,
V., Castela-Lobo, J., Figueira, A., Antunes, F., Bran-
quinho, A., Elias, C., and Nunes, U. (2012). Mobili-
dade, acessibilidade e participac¸˜ao em indiv´ıduos com
paralisia cerebral (in portuguese). Technical report,
Institute of Systems and Robotics, Coimbra Cerebral
Palsy Association, Cognitive and Behavioural Center
for Research and Intervention - University of Coim-
bra.
Dickinson, H. O., Parkinson, K. N., Ravens-Sieberer, U.,
Schirripa, G., Thyen, U., Arnaud, C., Beckung, E.,
Fauconnier, J., McManus, V., Michelsen, S. I., Parkes,
J., and Colver, A. F. (2007). Self-reported qual-
ity of life of 8-12-year-old children with cerebral
palsy: a cross-sectional european study. Lancet,
369(9580):2171–2178.
Gonzalez-Jimenez, J., Ruiz-Sarmiento, J., and Galindo, C.
(2013). Improving 2d reactive navigators with kinect.
In Int. Conf. on Informatics in Control, Automation
and Robotics, ICINCO 2013.
Health Statistics, N. C. f. and Health & Human Services, U.
S. D. (1988). National health interview survey: Child
health supplement.
Kennes, J., Rosenbaum, P., Hanna, S. E., Walter, S., Rus-
sell, D., Raina, P., Bartlett, D., and Galuppi, B.
(2002). Health status of school-aged children with
cerebral palsy: information from a population-based
sample. Developmental Medicine & Child Neurology,
44(4):240–247.
Koman, L. A., Smith, B. P., and Balkrishnan, R. (2003).
Spasticity associated with cerebral palsy in children:
guidelines for the use of botulinum a toxin. Pediatric
Drugs, 5(1):11–23.
Lopes, A., Pires, G., and Nunes, U. (2012). Robchair:
Experiments evaluating brain-computer interface to
steer a semi-autonomous wheelchair. In Intelligent
Robots and Systems (IROS), 2012 IEEE/RSJ Interna-
tional Conference on, pages 5135–5136.
Lopes, A. C., Pires, G., and Nunes, U. (2013). Assisted
navigation for a brain-actuated intelligent wheelchair.
Robot. Auton. Syst., 61.
Palisano, R., Rosenbaum, P., Walter, S., Russell, D., Wood,
E., and Galuppi, B. (1997). Gross motor function clas-
sification system. Developmental Medicine & Child
Neurology, 39(4):214–223.
Rockey, C. (2013). depthimage
to laserscan - ros wiki.
Vargus-Adams, J. (2003). Health-related quality of life
in childhood cerebral palsy. Archives of Physical
Medicine Rehabilitation, 86(5):940–945.
Varni, J. W., Limbers, C. A., and Burwinkle, T. M. (2007).
Impaired health related quality of life in children
and adolescents with chronic conditions: A compar-
ative analysis of 10 disease clusters and 33 disease
categories/severities utilizing the pedsql 4.0 generic
core scales. Health and Quality of Life Outcomes,
5(43):673–681.
Wake, M., Salmon, L., and Reddihough, D. (2003). Health
status of australian children with mild to severe cere-
bral palsy: cross-sectional survey using the child
health questionnaire. Developmental Medicine and
Child Neurology, 45(3):194–199.
Zaffuto-Sforza, C. D. (2005). Aging with cerebral palsy.
Physical Medicine and Rehabilitation Clinics of North
America, 16(1):235–249.
Mobility,AccessibilityandSafetyofPeoplewithCerebralPalsy
275
