ECG Biometrics Using a Dissimilarity Space Representation
Francisco Marques
1
, Carlos Carreiras
2
, Andr
´
e Lourenc¸o
2,3
, Ana Fred
1,2
and Rui Ferreira
4
1
Instituto Superior T
´
ecnico, Av. Rovisco Pais 1, Lisboa, Portugal
2
Instituto de Telecomunicac¸
˜
oes, Av. Rovisco Pais 1, Lisboa, Portugal
3
Instituto Superior de Engenharia de Lisboa, R. Cons. Em
´
ıdio Navarro 1, Lisboa, Portugal
4
Hospital de Santa Marta, R. de Santa Marta 50, Lisboa, Portugal
Keywords:
ECG, Segmentation, Heartbeat, Feature Space, Dissimilarity Space, Dissimilarity Representation, Nearest
Neighbor, Authentication, Identification, Biometrics.
Abstract:
Electrocardiogram (ECG) biometrics are a relatively recent trend in biometric recognition, with at least 13
years of development in peer-reviewed literature. Most of the proposed biometric techniques perform classifi-
cation on features extracted from either heartbeats or from ECG based transformed signals. The best represen-
tation is yet to be decided. This paper studies an alternative representation, a dissimilarity space, based on the
pairwise dissimilarity between templates and subjects’ signals. Additionally, this representation can make use
of ECG signals sourced from multiple leads. Configurations of three leads will be tested and contrasted with
single-lead experiments. Using the same k-NN classifier the results proved superior to those obtained through
a similar algorithm which does not employ a dissimilarity representation. The best Authentication EER went
as low as 1.53% for a database employing 503 subjects. However, the employment of extra leads did not prove
itself advantageous.
1 INTRODUCTION
1.1 ECG Basics
Humans possess an intrinsic ability to recognize pat-
terns and observations as part of a certain class. Often
the class-assigning process is immediate and deemed
obvious. However, when asked to explain how that
conclusion was achieved, the human observer is un-
able to detail the iterations that led him to it.
A biometric system attempts to replicate this be-
haviour and pursue an even more demanding goal –
subject identification. For that purpose a specific pro-
cedure must be designed which will employ sensors
to measure the data requested by it.
In what concerns the field of Electrocardiogram
(ECG) Biometrics the sensors record the heart’s elec-
trical activity – the ECG itself – and build a proce-
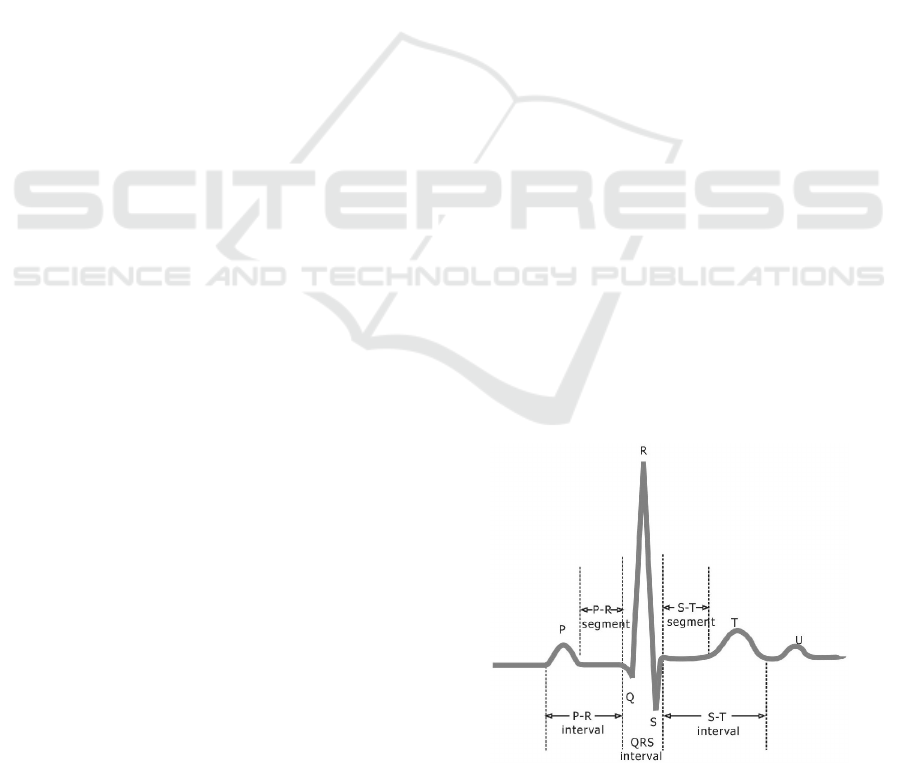
dure for feature extraction and classification. An ECG
heartbeat is composed by three main components: P
wave, QRS complex, and T wave, illustrated in Figure
1.
The measurement of an ECG is obtained via cor-
rect placement of a number of electrodes in specific
parts of the body and by tracing voltages between
Figure 1: A labeled ECG waveform.
them. Specific linear combinations between electrode
potentials result in different leads. For instance, lead
I corresponds to the voltage between the electrodes in
the right and left arms, as stated by Einthoven’s Tri-
angle (Conover, 2003) shown in Figure 2.
An ECG biometric system works just like any
other biometric system or any supervised learning
algorithm. Its functioning can be divided into two
modes of operation – enrolment and classification.
350
Marques F., Carreiras C., Lourenço A., Fred A. and Ferreira R..
ECG Biometrics Using a Dissimilarity Space Representation.
DOI: 10.5220/0005289303500359
In Proceedings of the International Conference on Bio-inspired Systems and Signal Processing (BIOSIGNALS-2015), pages 350-359
ISBN: 978-989-758-069-7
Copyright
c
2015 SCITEPRESS (Science and Technology Publications, Lda.)

Figure 2: Figure representing Einthoven’s Triangle and re-
spective leads. The lead voltages are taken from the plus to
the minus signs.
During enrolment the system is given a user’s ID
and extracts his/her information – the training data.
From this data the classifier generates the templates
which best represent the user and build the system’s
database. More enrolled subjects imply greater dif-
ficulty for identification as the number of possible
choices increases (and the probability of having an
individual with similar data also increases). This ef-
fect can be countered by storing more templates for a
given subject.
The second mode, classification extracts a current
user’s data and compares it to the registered training
data. It then outputs the best match, i.e. the correct
user in the case of a biometric system. Classifica-
tion can be divided into two procedures, authentica-
tion and identification.
Authentication
The system is provided an ID and will confirm
or deny that a given user is who he/she claims to
be. For that purpose the classifier performs only
comparisons with respect to the given ID’s stored
templates.
Identification
In this case, the classifier is not given any ID
by the user. As a result, it must search its en-
tire database for the subject whose templates best
match the input data.
1.2 ECG Biometrics
All the studies on ECG biometrics are based on one-
lead, two-lead, three-lead, or 12-lead ECG signals,
mirroring what is most commonly employed in clin-
ical situations (Odinaka et al., 2012). The most
widespread lead configuration used in ECG biomet-
rics is by far the one-lead configuration as (Biel et al.,
2001) demonstrated that a signal from one lead con-
tains enough information to form the basis for a bio-
metric system. Nonetheless, some studies have re-
sorted to multiple-lead ECG signals in their biometric
strategy. (Ye et al., 2010) utilized two leads (Fang and
Chan, 2009) (W
¨
ubbeler et al., 2007) and (Labati et al.,
2013) opted for three leads and (Biel et al., 2001) and
(Agrafioti and Hatzinakos, 2008) used 12 leads. The
technique proposed in this article will be tested in a
single and triple-lead scenario, employing the limb-
lead I or all the limb-leads I, II and III respectively.
With an ECG signal in hand, regardless of the
lead, there are several existing techniques for carrying
out the feature extraction procedure. These fall into
three different categories in what concerns the type of
features they employ (Odinaka et al., 2012).
Fiducial Features
These methods use characteristic points of an
ECG heartbeat and/or relationships between them
as features – the fiducial features. Characteristic
points include the peak of the R-wave, while a re-
lationship between points can be the temporal du-
ration of a QRS impulse. Several combinations of
the four types of fiducial features have been used
in the literature (Singla and Sharma, 2010) – tem-
poral, amplitude, angle and dynamic (R-R inter-
vals) (Odinaka et al., 2012).
Non-Fiducial Features
Techniques based on non-fiducial features do
not use characteristic points as features. De-
spite that, most of them rely on some charac-
teristic points for heartbeat segmentation (Chan
et al., 2008) (Fatemian and Hatzinakos, 2009)
while others simply create windows from the
ECG recording (Wang et al., 2013) (Plataniotis
et al., 2006) (Agrafioti and Hatzinakos, 2008) (Li
and Narayanan, 2010). Afterwards these seg-
ments/windows are transformed into another do-
main so as to extract features from the resulting
signals.
Hybrid Features
Algorithms in this group resort to both fiducial
and non-fiducial features for their biometric sys-
tem. Some use a combination of them as features
(Wang et al., 2008) (Silva et al., 2007). Others
design two classifiers where the first uses non-
fiducial features to reduce the match set and the
second outputs the classification while being fed
with the fiducial features (Shen and Hu, 2011)
(Shen et al., 2002).
Having assembled the feature space some algo-
rithms additionally perform its dimensionality reduc-
tion. Afterwards, the reduced or raw feature space is
then directly used for the training of classifiers. Re-
gardless, it must be emphasised that the ideal feature
representation is yet to be found – all the existing ones
present pros and cons in relation to one another.
ECGBiometricsUsingaDissimilaritySpaceRepresentation
351

It is on these grounds that the current article intro-
duces the concept of a feature space based on a Dis-
similarity Representation for ECG biometrics by re-
sorting to comparisons between signals as inspired by
the study in (Duin and Pe¸kalska, 2011). The current
study explores this possibility by designing a multi-
lead configuration and comparing it with the single-
lead version. Dissimilarity Representations will be
explained in Section 3.
Moreover Section 2 describes the notation used in
this paper. Section 4 then outlines the pre-processing
feature extraction and template generation carried out
on the ECG signals, as well as the utilized classifier.
Section 5 outlines the executed experiments and their
results. This paper is concluded in Section 6 which
draws the main findings and conclusions.
2 NOTATION
In order to better understand the methodology pro-
posed in this paper as well as the process of building
the dissimilarity representation, the notation that will
be employed throughout the paper is here presented.
The basic element behind the proposed method’s
biometric system is the ECG heartbeat. Heartbeats
will be employed as templates and dissimilarities will
be calculated through comparisons between them.
The current work utilized a Sampling Frequency of
500 Hz. With this in mind we shall consider:
• A population of S existing subjects;
• A percentage p which is considered sufficient to
represent the whole population variation. From
this percentage, a number of subjects S
p
will be
randomly chosen from S. For this work p is set to
15%.
• A set C of leads. For the scope of this work, C’s
elements will be either the single-lead [I] or the 3
limb-leads [I, II, III]. The variable L is defined as
L = |C|.
• N
i
as the number of extracted heartbeats from sub-
ject i’s ECG, i = 1, . . . ,S.
• N =
S
∑
i=1
N
i
as the number of all extracted heart-
beats over all subjects.
• A heartbeat belonging to subject i is denoted by
h
l
i
j
with j = 1, . . . , N
i
and l ∈ C. The variable h
i
j
implies a heartbeat originating from lead I. Beats
are represented by a 600 ms window which is
built having the R-peak as a reference at position
200 ms. Thus, for the employed Sampling Fre-
quency, they are composed of 300 samples.
• A reference lead, R, which for the scope of this
work will be lead I. Note that h
R
i
j
will correspond
to signals taken from lead R.
• A Feature Space F, represented by an N × M ma-
trix. M consists of the 300 samples present in a
heartbeat.
Two metrics have been employed in various steps
of the proposed methodology – the euclidean distance
and the cosine similarity. For the sake of clarity they
are respectively defined here in Equations 1 and 2.
D(h
i
j
, h
i
k
) =
q
(h
i
j
− h
i
k
)
T
(h
i
j
− h
i
k
) (1)
D(h
i
j
, h
i
k
) = 1 −
h
i
j
· h
i
k
kh
i
j
kkh
i
k
k
(2)
where k.k represents the euclidean norm.
3 DISSIMILARITY
REPRESENTATION
A Dissimilarity Representation is built on the fact that
similarity between objects plays a crucial role in class
formation, i.e. a class is a set of similar objects (Duin
and Pe¸kalska, 2012). A universal object similarity,
however, does not exist and always depends on the
classification context, procedure and/or the domain of
study. Moreover, the presence of other classes will in-
fluence the degree to which an object should or should
not be assigned to a particular class.
This paper puts forward the notion of dissimilar-
ity between ECG elements. Calculating a dissimilar-
ity is simply comparing elements, pairwise, according
to some pre-defined rules (Duin and Pe¸kalska, 2012).
Metrics, for instance, fit this criteria. The present
study will explore two different ones – euclidean dis-
tance and cosine similarity.
A dissimilarity-based representation can be con-
structed from any type of elements which can be any
kind of feature array possible. Also, they can be built
from as many comparisons between elements as one
wishes. Consequently, note that this process is eas-
ily extensible to using more than one-lead by simply
comparing one lead’s elements with another lead’s el-
ements.
A dissimilarity space intends to take the original
feature space F and output another one, F
D
, by taking
pairwise distances between ECG elements i, where
i = 1, . . . , N. This paper proposes two different ap-
proaches for defining the dissimilarity space. Subsec-
tion 4.4 details their development.
BIOSIGNALS2015-InternationalConferenceonBio-inspiredSystemsandSignalProcessing
352
4 PROPOSED METHODOLOGY
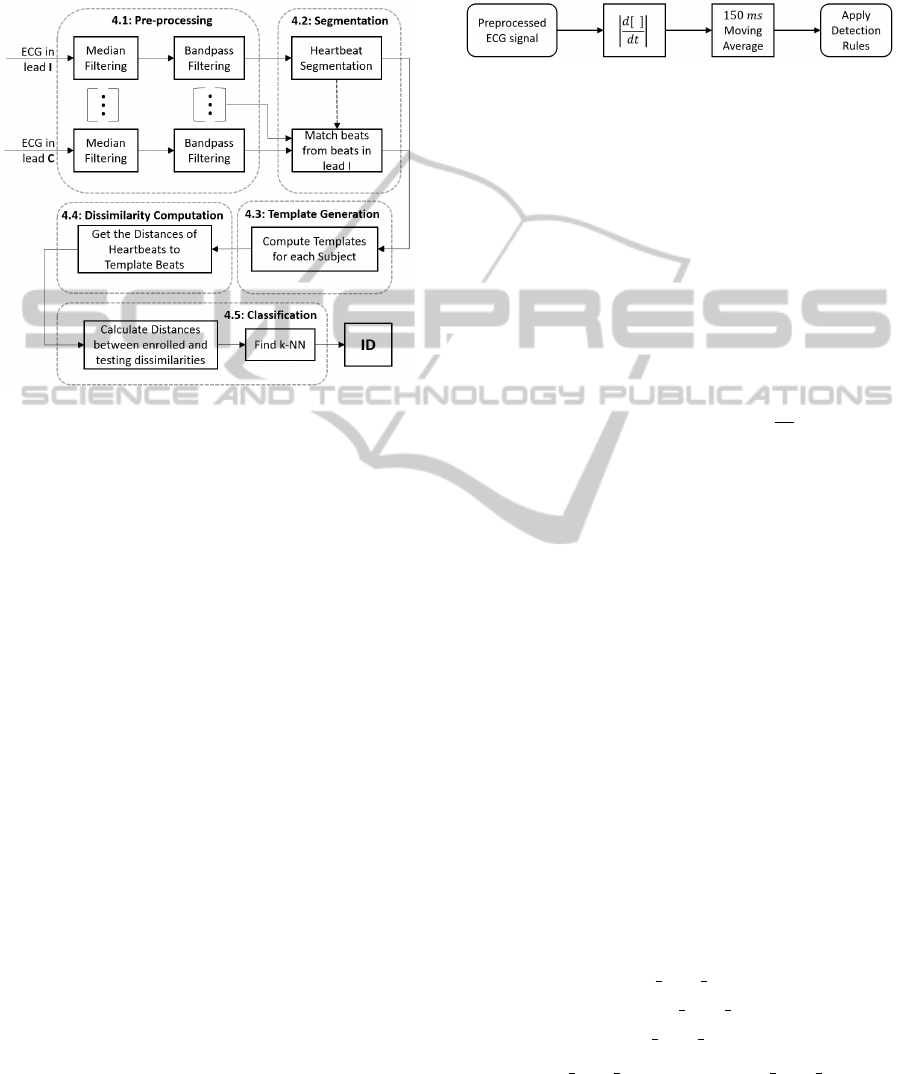
The whole methodology for the proposed technique
is summarized in Figure 3.
Figure 3: Block diagram of the proposed ECG biometric
system. Note that lead C simply refers to an arbitrary lead.
Also, the suspension points underline the possibility of us-
ing additional leads.
4.1 Pre-processing
Due to the presence of several noise sources dur-
ing measurement – power line interference, electrode
contact loss, baseline drift due to respiration and mo-
tion artefacts, for example (Friesen et al., 1990)– it is
imperative to filter the signal to facilitate the proce-
dure of feature extraction.
In order to remove baseline drift from raw ECG
signals we apply the method by (de Chazal et al.,
2004). It applies two median filters (of 200 ms and
600 ms respectively) to the raw ECG signal and then
proceeds to subtract the resulting waveform to the raw
ECG.
Afterwards, an additional filtering stage elimi-
nates the effect of other noise sources through band-
pass filtering. The filter consists of a 5 → 20 Hz band-
pass FIR filter with order 150. This frequency band
removes a substantial part of the information present
in heartbeats but compensates by successfully clean-
ing the signal of any motion artefacts and power line
interference as well as reducing electromyographic
noise effects.
4.2 Segmentation
In order to segment the ECG signal into heartbeats,
R-peak detection is first carried out as in (Hamil-
ton, 2002). Beat detection is performed over a trans-
formed signal which is obtained according to the dia-
gram in Figure 4. Its basic detection rules are as fol-
lows:
Figure 4: Transformation process applied to the ECG signal
so as to perform beat detection.
1. Ignore all peaks that precede or follow larger
peaks by less than 200 ms.
2. If the peak occurred within 360 ms of a previ-
ous detection and had a maximum slope less than
0.7×the maximum slope of the previous detection
assume it is a T-wave.
3. If the peak is larger than the detection threshold
– DT – call it a QRS complex; otherwise call it
noise.
4. If an interval equal to 1.5 times the average R-to-
R interval has elapsed since the most recent detec-
tion, check for a peak larger than
DT
2
within that
interval. If the peak followed the preceding detec-
tion by at least 360 ms then classify that peak as a
QRS complex.
The detection threshold – DT mentioned in
rules 3 and 4 – resorts to the following data
structures:
QRS-peak buffer
Stores the 8 most recent R-peak values. Its entries
are used in the detection threshold – DT – calcula-
tion. It is initialized with the highest-valued peaks
in one second intervals for 8 seconds;
Noise-peak buffer
Behaves like the previous structure but stores the 8
most recent noise-peak values instead. It is, how-
ever, initialized at 0;
RR-interval buffer
Stores the 8 most recent interval between R-peaks.
These are initialized at a value corresponding to a
1 s interval.
The DT threshold is computed as:
DT = Noise Peak Bu f f
med
+ T H(QRS Peak Bu f f
med
− Noise Peak Bu f f
med
) (3)
where Noise
Peak Bu f f
med
and QRS Peak Bu f f
med
are the median of the Noise-peak buffer and QRS-peak
buffer arrays respectively. TH = 0.45 was empirically
found most suitable for the database used in testing.
ECGBiometricsUsingaDissimilaritySpaceRepresentation
353

However, the peaks detected on the transformed
signal do not map directly to the R-peaks in the ECG
signal. A post-processing phase is necessary so as
to perform adequate R-peak detection. The points
found are then mapped to the exact R-peak location
by searching within ±150 ms and choosing the high-
est sloped peak of the two largest ones found in that
interval. This process is executed only for lead I –
the beats are then matched on the other utilized leads
by once again looking for the highest sloped peak of
the two largest ones, but this time in a smaller interval
consisting of ±60 ms.
Having the location of the R-peaks for all leads,
the segments are constructed simply by taking the
ECG window from 0 ms to 600 ms, where 200 ms
correspond to the R-peak. As mentioned in Section 2,
all segments have a fixed length of 600 ms.
4.2.1 Outlier Detection
Outlier removal is performed as in (Lourenc¸o et al.,
2013). It will only be executed for lead I – the beats
here discarded will be discarded for the other em-
ployed leads as well.
This algorithm receives as input the N
i
heartbeats
for subject i and begins by calculating the average
beat via:
h
av
i
=
1
N
i
N
i
∑
j=1
h
i
j
, (4)
Heartbeats which stray away from the average beat
are discarded according to the following procedure:
1. For each h
i
j
, compute its distance D(h
i
j
, h
av
i
) to
the mean waveform h
av
i
.
2. Compute the 1
st
and 2
nd
order statistical moments
of the distances D(·, h
av
i
); µ
D(·,h
av
i
)
corresponds to
the mean value and σ
D(·,h
av
i
)
to the standard devi-
ation.
3. Compute the median of the minimum and maxi-
mum values over all templates h
i
j
, denoted as h
med
i
min
and h
med
i
max
respectively.
4. Verify the conditions below for every h
i
j
. If any is
confirmed, then h
i
j
is discarded as an outlier:
(a) h
i
j
min
< 1.5 × h
med
i
min
, h
i
j
min
is the minimum value
for beat h
i
j
;
(b) h
i
j
max
> 1.5× h
med
i
max
, h
i
j
max
is the maximum value
for beat h
i
j
;
(c) D(h
i
j
, h
av
i
) > µ
D(h
i
j
,h
av
i
)
+ 0.5 × σ
D(h
i
j
,h
av
i
)
;
Note that D(h
i
j
, h
av
i
) can refer to any distance metric.
The present work utilizes the cosine distance in 2.
4.3 Template Generation
The problem of template selection may be posed as
follows: given a set of N heartbeats, select K tem-
plates that “best” represent the variability as well as
the typically observed patterns according to a given
similarity criterion (Lourenc¸o et al., 2014).
Clustering methods are especially adequate for
this task, and have already been used for template se-
lection in other modalities (Uludag et al., 2004; Con-
nell and Jain, 1999; Liu and Wang, 2008; Lumini and
Nanni, 2006). In this paper the K-means algorithm
was used, with K empirically set to 5, the cluster’s
centroids being used as templates (Lourenc¸o et al.,
2014).
4.4 Dissimilarity Computation
Dissimilarities can be calculated by measuring a dis-
tance between beats according to a metric. Two such
metrics have been explored in this study – euclidean
distance and cosine similarity referred respectively in
Equations 1 and 2. In Section 5 their effects can be
contrasted.
Two different dissimilarity extraction techniques
are hereby proposed.
Subject based
This first and simplest approach computes the dis-
tance D(h
R
i
j
, h
l
i
t
) between each segment h
R
i
j
and the
set of h
l
i
t
template beats for each lead in set C.
The process is repeated for all subjects S. It is
presented in pseudo-code below.
for each subject i in S do
for each beat j in N
i
do
ds
i
j
= [ ]
for each lead l in C do
for each template t do
ds
i
j
.append(D(h
R
i
j
, h
l
i
t
))
Considering T templates per subject, the resulting
dissimilarity representation is then an N × T*L
matrix composed by N dissimilarity arrays with
T ∗ L components.
Inter-subject based
A second strategy computes the distance
D(h
R
i
j
, h
l
i
t
) between each segment h
R
i
j
and the set
of h
l
i
t
template beats of the randomly chosen S
p
subjects for each lead in set C. The following
pseudo-code outlines these steps.
for all S subjects do
for each beat j in N do
ds
j
= [ ]
for each lead l in C do
BIOSIGNALS2015-InternationalConferenceonBio-inspiredSystemsandSignalProcessing
354
for each subject s in S
p
do
for each template t do
ds
j
.append(D(h
R
j
, h
l
s
t
))
Once again, considering T templates per sub-
ject, the obtained dissimilarity representation is an
N × T*S
p
*L matrix consisting of N dissimilarity
arrays composed by T ∗ S
p
∗ L elements.
4.5 Classification
In classification, both authentication and identifica-
tion follow the same principles for matching. A fea-
ture space comprising dissimilarities supports a large
variety of classifiers (Duin et al., 2010). The current
work employs a k-Nearest Neighbours (k-NN) model
applied to dissimilarity arrays, with k set to 3.
The steps taken during the classification process
depend on the dissimilarity representation approach
taken in Sub-section 4.4. During enrolment, for a
Subject based approach, the classifier will store all the
S users’ template heartbeats h
l
i
t
for all C leads.
As for the Inter-subject method the algorithm
saves only the template beats belonging to the S
p
sub-
jects (which have been recorded prior to enrolment)
over the C used leads.
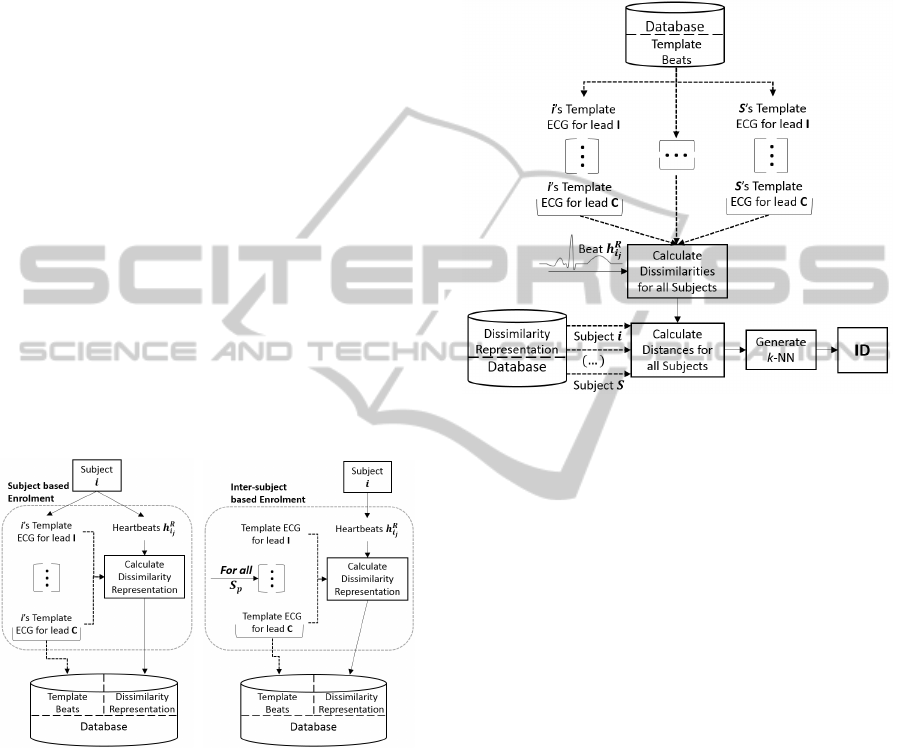
(a) Enrolment for a Subject based
Dissimilarity Representation.
(b) Enrolment for an Inter-subject
based Dissimilarity Representation.
Figure 5: Enrolment for both approaches.
Both methods store their N respective template
dissimilarity arrays calculated for all the extracted
heartbeats h
R
i j
over S. Consider v
t
as one such tem-
plate. See Figure 5 for an illustration of this mode.
As for authentication and identification, for each dis-
similarity representation approach:
Subject based
Authentication or identification determine the set
of retrieved h
l
i
t
templates – in the former they only
originate from the requested subject while in the
latter they are obtained from the S subjects.
Inter-subject based
In this case, the classifier calculates one single dis-
similarity representation with respect to the tem-
plates originating from the S
p
determined subjects
– regardless of the procedure taken.
Figure 6: Block diagram illustrating the identification pro-
cedure for the Subject based dissimilarity approach.
The obtained dissimilarity arrays are called v
id
.
Then, the template dissimilarity arrays v
t
chosen for
the determination of the 3-NN are either sourced from
the input subject – for authentication – or obtained
from all subjects – for identification.
Distances between dissimilarity vectors D(v
id
, v
t
)
are once again measured according to both euclidean
distance and cosine similarity referred in Equations 1
and 2. In Section 5 their effect in classification is com-
pared as well. See Figures 6 and 7 for the classifica-
tion procedure for the Subject based and Inter-subject
based dissimilarity approaches respectively.
After calculating all the D(v
id
, v
t
), the 3 small-
est distances are taken as the 3-Nearest Neighbours.
They will then be compared with a threshold, th
auth
for authentication or th
id
for identification. This
threshold will validate the distances’ votes according
to:
d
k
<= th (5)
where d
k
is one of the 3 resulting distances and th
is either th
auth
or th
id
according to the chosen mode.
Distances d
k
not respecting Equation 5 are not consid-
ered in the final classification. If at least 2 d
k
distances
have been validated, then for authentication the input
user is confirmed as valid. In identification the most
voted user corresponding to those d
k
is provided as
ECGBiometricsUsingaDissimilaritySpaceRepresentation
355
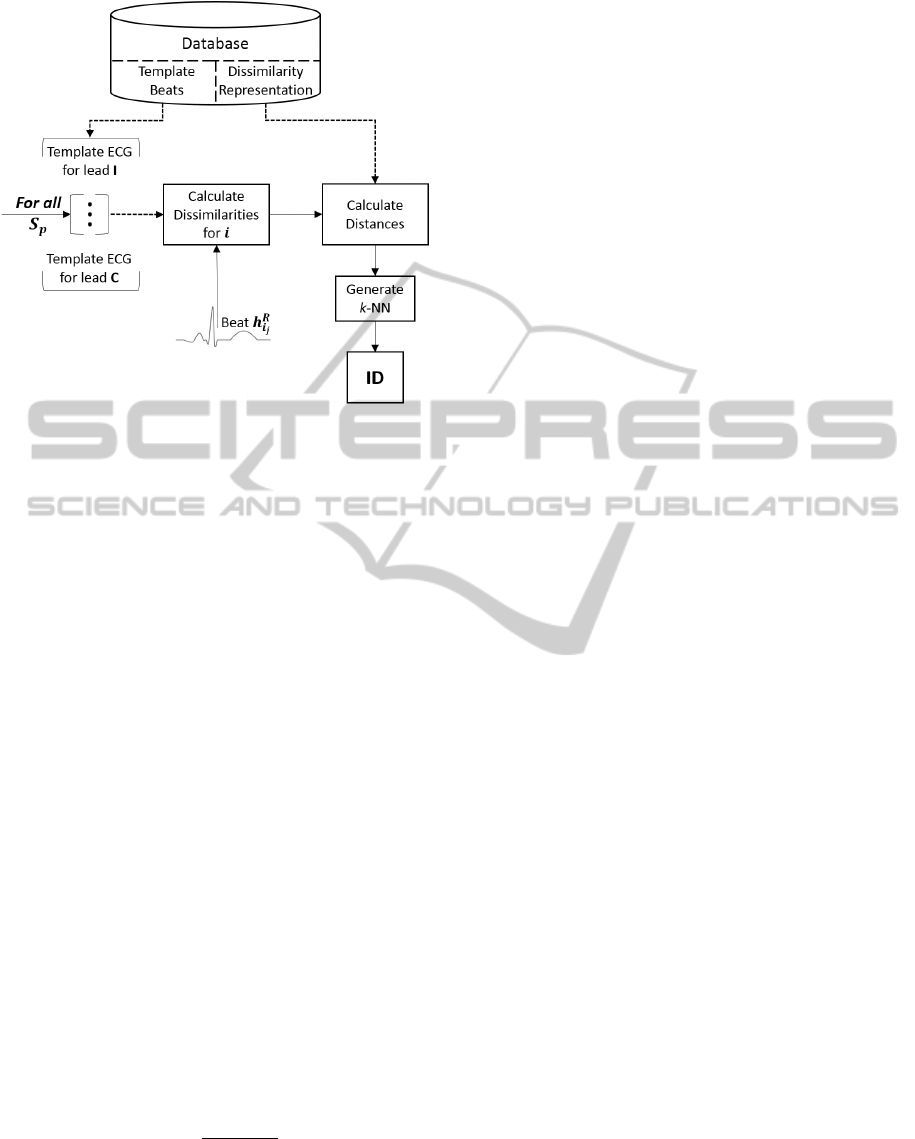
Figure 7: Block diagram illustrating the identification pro-
cedure for the Inter-subject based dissimilarity approach.
output. However, for this mode, if no majority exists
for the valid d
k
, then identification fails.
5 RESULTS
In order to provide a thorough evaluation of the pro-
posed method, we applied it to a database provided by
a local cardiac hospital, Hospital de Santa Marta, that
has been previously validated in terms of biometric
performance in (Carreiras et al., 2014).
The used ECG records were acquired during nor-
mal hospital operation, encompassing scheduled ap-
pointments, emergency cases, and bedridden patients.
This study focuses on signals originating from healthy
individuals. All signals were acquired using Philips
PageWriter Trim III devices, following the standard
12-lead placement, with a sampling rate of 500 Hz
and 16 bit resolution. Each record has a duration of
10 s. 832 records were then employed belonging to
618 subjects.
The various results are compared through Re-
ceiver Operating Characteristic (ROC) and corre-
sponding Equal Error Rates (EER) for the authentica-
tion mode of operation while the identification mode
is characterized by its Identification Error (EID) as in:
E
ID
=
F
ID
T
ID
+ F
ID
(6)
where F
ID
and T
ID
correspond to the number of incor-
rect and correct identifications respectively.
All of the designed experiments were executed ac-
cording to a simple random approach. The existing
valid heartbeats were randomly partitioned into two
sets, a training set containing 75% of those beats and
a test set composed by the remaining 25%, whose
beats are individually evaluated. This procedure was
repeated 10 times and the average EER and EID were
calculated from all these 10 runs. The minimum num-
ber of training heartbeats is 5, an amount demanded
by the template generation block. Some subjects did
not satisfy this requirement and were thus not consid-
ered for testing. The employed number of subjects
thus becomes 503.
The following experimental set-ups were tested.
The effect of the metric choice over both dissimilarity
computation in Section 4.4 and classification in Sec-
tion 4.5 was tested. The chosen metrics for both steps
were the cosine similarity and euclidean distance. To
test all the possible metric combination, 4 different
scenarios are possible. Given the existence of two
methods for dissimilarity computation, the number of
experiments rises to 8 for each lead configuration C.
Experiments over all metrics were only carried out
with C = [I, II, III]. Due to time constraints, the set
of metrics corresponding to the best results for each
dissimilarity method were employed for C = [I]. The
total number of experiments is then 10. Tags are given
to these experiments so as to facilitate the observation
of results.
Subject based (B)
This approach is given the tag B. The employed
metric scenario for a given experiment will be de-
scribed by two letters C or E whether the em-
ployed metric is a cosine similarity or euclidean
distance respectively. The first letter will corre-
spond to the metric utilized in the dissimilarity
computation process while the second refers to the
metric used in the classification procedure. The
utilized set C is shown subscript to the letter B.
As a result, a tag of B
I,II,III
− CE pinpoints the
use of cosine similarity for dissimilarity calcula-
tion and the use of euclidean distance to get the
distances between dissimilarity arrays, for a set
C = [I, II, III]. As a result, for approach B there
are:
• B
I,II,III
−CC
• B
I,II,III
−CE
• B
I,II,III
− EC
• B
I,II,III
− EE
• B
I
−CE
Inter-subject based (I)
The tag I was attributed to experiments following
this approach. The notation associated to them
follows the same as in the previous method. As
such:
BIOSIGNALS2015-InternationalConferenceonBio-inspiredSystemsandSignalProcessing
356
• I
I,II,III
−CC
• I
I,II,III
−CE
• I
I,II,III
− EC
• I
I,II,III
− EE
• I
I
−CC
Additionally, results obtained from the technique
in (Carreiras et al., 2014) are contrasted with the ones
hereby obtained. This technique is similar to the one
presented in this paper but ditches the dissimilarity
computation phase. Instead, it uses heartbeats as fea-
ture arrays and then applies k-NN directly to them.
Also this method is exclusively single-lead. It shall
be tagged with the expression O
I
. Table 1 summa-
rizes results obtained for all experiments in the form
of averaged EERs and EIDs and respective standard
deviations.
Table 1: Results all experiments’ EER & EID rates.
EER [%] EID [%]
O
I
8.51 ± 0.30 12.04 ± 0.68
B
I,II,III
CC 21.55 ±0.36 87.97 ± 2.21
CE 4.45 ± 0.13 8.89 ± 1.11
EC 30.25 ±0.34 92.59 ± 1.78
EE 1.53 ± 0.09 23.46 ± 1.96
B
I
CE 4.45 ± 0.09 9.92 ± 0.76
I
I,II,III
CC 2.46 ± 0.09 5.48 ± 0.33
CE 4.76 ± 0.24 6.90 ± 0.38
EC 10.75 ±0.06 13.02 ± 0.68
EE 3.83 ± 0.11 19.74 ± 0.50
I
I
CC 2.46 ± 0.09 5.37 ± 0.48
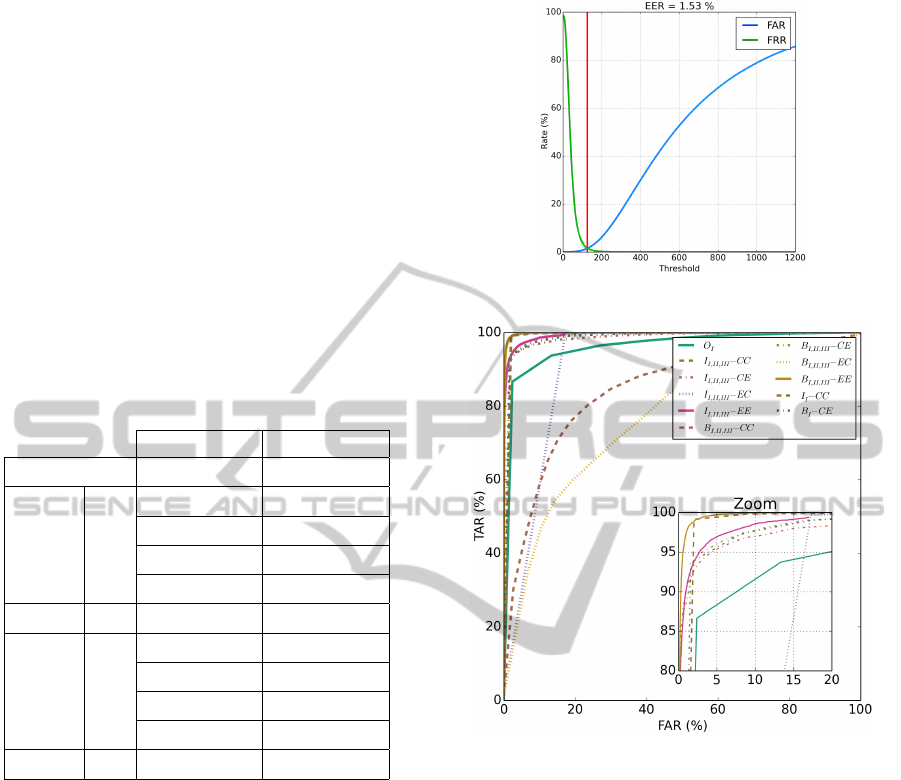
The ROC curve for the experiment B
I,II,III
− EE
is shown in Figure 8(a). A ROC curve comparing all
the experiments in authentication mode is shown in
Figure 8(b).
The results in Table 1 suggest the following obser-
vations.
• Classifiers whose training computes dissimilari-
ties based on a cosine metric proved much supe-
rior to their euclidean distance equivalents. This
was expected due to the large initial feature size of
M = 300. The exception concerns authentication
results for CE vs EE, in which the latter is better.
• For a Subject-based approach, experiments em-
ploying a cosine similarity metric during classi-
fication present very high EER and EID indices.
This was expectable due to the very small dissim-
ilarity array size (T ∗L = 15) rendering the cosine
similarity metric unable to extract viable informa-
tion. Precisely the opposite can be said for an
(a) ROC curve and obtained EER for the exper-
iment B
S
− EE.
(b) ROC curve for all the executed experiments.
Figure 8: ROC curves outlining obtained results for authen-
tication.
Inter-subject approach which presents a dissimi-
larity array size of (T ∗ S
p
∗ L = 1125).
• Both single-lead experiments present better re-
sults than those obtained from O
I
. From here it
is possible to conclude that a dissimilarity based
representation can originate a more effective bio-
metric system.
• Authentication EERs did not vary significantly
by changing the lead-set C. However, EIDs for
a triple-lead set improved in a subject based ap-
proach and deteriorated for an inter-subject based
one. The following are the possible explanations
for what happened.
– For a subject based approach B, the single-lead
dissimilarity array size is very small (T ∗L = 5).
The three extra leads raise this dimension to 15
which is a significant increase in information.
ECGBiometricsUsingaDissimilaritySpaceRepresentation
357

– For an inter-subject based approach I, the
single-lead dissimilarity array size is already
relatively large (T ∗ S
p
∗ L = 375). Increasing
it further does not contribute to the rise in in-
formation. Thus the EID degrades slightly.
• Lastly, the lowest EER for authentication origi-
nated from B
I,II,III
−EE. However it also presents
a high EID. The lowest EID is shown by I
I,II,III
−
CC which also gave a good and second lowest
EER value.
6 CONCLUSIONS AND FUTURE
WORK
The number of possible ECG representations is end-
less and so far none has managed to stand out at the
expense of all the others. In this paper a new ECG rep-
resentation space is developed and integrated into an
already existing biometric system. This feature space
is built through dissimilarity computation, where the
new features are a direct and pairwise comparison be-
tween those present in two signals, which here were
taken via metrics.
Moreover, the computation of this novel repre-
sentation can be extended to various types of ECG
configurations or signals, underlining its versatility.
The current study extended its usage to multi-lead
ECG signals, where an EER rate of 1.53% has been
achieved, for authentication over a database of 503
subjects as well as an EID rate of 5.65%. It should
be emphasized that for authentication/identification a
single heartbeat was used. The usage of a larger num-
ber of beats for classification will likely lead to better
results. When contrasting with the original technique,
which does not compute a dissimilarity representa-
tion, this feature space returns better results, proving
the usefulness of such a representation. However, as
in previous work, the usage of more than one lead did
not significantly improve results.
ACKNOWLEDGEMENTS
This work was partially funded by Fundac¸
˜
ao para a
Ci
ˆ
encia e Tecnologia (FCT) under grants PTDC/EEI-
SII/2312/2012, and SFRH/PROTEC/49512/2009,
whose support the authors gratefully acknowledge.
We would also like to thank Joana Santos for her hard
work labelling the ECG records.
REFERENCES
Agrafioti, F. and Hatzinakos, D. (2008). Fusion of ECG
sources for human identification. In Communications,
Control and Signal Processing, 2008. ISCCSP 2008.
3rd International Symposium on, pages 1542–1547.
Biel, L., Pettersson, O., Philipson, L., and Wide, P. (2001).
ECG analysis: a new approach in human identifica-
tion. Instrumentation and Measurement, IEEE Trans-
actions on, 50(3):808–812.
Carreiras, C., Lourenc¸o, A., Fred, A., and Ferreira, R.
(2014). ECG signals for biometric applications - are
we there yet? In 11th Int. Conf. on Informatics in
Control, Automation and Robotics, pages 765–772.
Scitepress.
Chan, A. D. C., Hamdy, M., Badre, A., and Badee, V.
(2008). Wavelet distance measure for person identifi-
cation using electrocardiograms. Instrumentation and
Measurement, IEEE Transactions on, 57(2):248–253.
Connell, S. D. and Jain, A. K. (1999). Template-based on-
line character recognition. Pattern Recognition, 34:1–
14.
Conover, M. (2003). Understanding Electrocardiography.
Mosby.
de Chazal, P., O’Dwyer, M., and Reilly, R. (2004). Auto-
matic classification of heartbeats using ECG morphol-
ogy and heartbeat interval features. Biomedical Engi-
neering, IEEE Transactions on, 51(7):1196–1206.
Duin, R., Loog, M., Pe¸kalska, E., and Tax, D. (2010).
Feature-based dissimilarity space classification. In
¨
Unay, D., C¸ taltepe, Z., and Aksoy, S., editors, Recog-
nizing Patterns in Signals, Speech, Images and Videos,
volume 6388 of Lecture Notes in Computer Science,
pages 46–55. Springer Berlin Heidelberg.
Duin, R. P. and Pe¸kalska, E. (2011). The dissimilarity
representation for structural pattern recognition. In
San Martin, C. and Kim, S.-W., editors, Progress in
Pattern Recognition, Image Analysis, Computer Vi-
sion, and Applications, volume 7042 of Lecture Notes
in Computer Science, pages 1–24. Springer Berlin
Heidelberg.
Duin, R. P. and Pe¸kalska, E. (2012). The dissimilar-
ity space: Bridging structural and statistical pattern
recognition. Pattern Recognition Letters, 33(7):826 –
832.
Fang, S.-C. and Chan, H.-L. (2009). Human identifi-
cation by quantifying similarity and dissimilarity in
electrocardiogram phase space. Pattern Recognition,
42(9):1824 – 1831.
Fatemian, S. and Hatzinakos, D. (2009). A new ECG fea-
ture extractor for biometric recognition. In Digital
Signal Processing, 2009 16th International Confer-
ence on, pages 1–6.
Friesen, G., Jannett, T., Jadallah, M., Yates, S., Quint, S.,
and Nagle, H. (1990). A comparison of the noise sen-
sitivity of nine qrs detection algorithms. Biomedical
Engineering, IEEE Transactions on, 37(1):85–98.
Hamilton, P. (2002). Open source ECG analysis. In Com-
puters in Cardiology, 2002, pages 101–104.
BIOSIGNALS2015-InternationalConferenceonBio-inspiredSystemsandSignalProcessing
358

Labati, R. D., Sassi, R., and Scotti, F. (2013). ECG biomet-
ric recognition: permanence analysis of qrs signals for
24 hours continuous authentication. In IEEE Interna-
tional Workshop on Information Forensics and Secu-
rity (WIFS), pages 31–36. Institute of electrical and
electronics engineers.
Li, M. and Narayanan, S. (2010). Robust ECG biomet-
rics by fusing temporal and cepstral information. In
Pattern Recognition (ICPR), 2010 20th International
Conference on, pages 1326–1329.
Liu, N. and Wang, Y. (2008). Template selection for on-line
signature verification. In Proc. of the 19th Int. Conf.
on Pattern Recognition (ICPR), pages 1–4.
Lourenc¸o, A., Carreiras, C., Silva, H., and Fred, A. (2014).
ECG biometrics: A template selection approach. In
Medical Measurements and Applications (MeMeA),
2014 IEEE International Symposium on, pages 1–6.
Lourenc¸o, A., Silva, H., Carreiras, C., et al. (2013). Out-
lier detection in non-intrusive ECG biometric sys-
tem. In Image Analysis and Recognition, pages 43–52.
Springer Berlin Heidelberg.
Lumini, A. and Nanni, L. (2006). A clustering method
for automatic biometric template selection. Pattern
Recognition, 39(3):495–497.
Odinaka, I., Lai, P.-H., Kaplan, A., O’Sullivan, J., Sirevaag,
E., and Rohrbaugh, J. (2012). ECG biometric recog-
nition: A comparative analysis. Information Forensics
and Security, IEEE Transactions on, 7(6):1812–1824.
Plataniotis, K., Hatzinakos, D., and Lee, J. (2006). ECG
biometric recognition without fiducial detection. In
Biometric Consortium Conference, 2006 Biometrics
Symposium: Special Session on Research at the, pages
1–6.
Shen, T. W., Tompkins, W., and Hu, Y. H. (2002). One-
lead ECG for identity verification. In Engineering in
Medicine and Biology, 2002. 24th Annual Conference
and the Annual Fall Meeting of the Biomedical Engi-
neering Society EMBS/BMES Conference, 2002. Pro-
ceedings of the Second Joint, volume 1, pages 62–63
vol.1.
Shen, Tsu-Wang, T. W. J. and Hu, Y. H. (2011). Implemen-
tation of a one-lead ECG human identification system
on a normal population. Journal of Engineering and
Computer Innovations, 2(1):12–21.
Silva, H., Gamboa, H., and Fred, A. (2007). One lead
ECG based personal identification with feature sub-
space ensembles. In Perner, P., editor, Machine Learn-
ing and Data Mining in Pattern Recognition, volume
4571 of Lecture Notes in Computer Science, pages
770–783. Springer Berlin Heidelberg.
Singla, S. and Sharma, A. (2010). ECG as biometric in the
automated world. International Journal of Computer
Science & Communication, 1:281–283.
Uludag, U., Ross, A., and Jain, A. (2004). Biometric tem-
plate selection and update: a case study in fingerprints.
Pattern Recognition, 37(7):1533–1542.
Wang, J., She, M., Nahavandi, S., and Kouzani, A. (2013).
Human identification from ECG signals via sparse
representation of local segments. Signal Processing
Letters, IEEE, 20(10):937–940.
Wang, Y., Agrafioti, F., Hatzinakos, D., and Plataniotis, K.
(2008). Analysis of human electrocardiogram for bio-
metric recognition. EURASIP Journal on Advances in
Signal Processing, 2008(1):148658.
W
¨
ubbeler, G., Stavridis, M., Kreiseler, D., Bousseljot, R.-
D., and Elster, C. (2007). Verification of humans using
the electrocardiogram. Pattern Recognition Letters,
28(10):1172 – 1175.
Ye, C., Coimbra, M., and Kumar, B. (2010). Investigation
of human identification using two-lead electrocardio-
gram (ECG) signals. In Biometrics: Theory Applica-
tions and Systems (BTAS), 2010 Fourth IEEE Interna-
tional Conference on, pages 1–8.
ECGBiometricsUsingaDissimilaritySpaceRepresentation
359
