
Automatic Abstraction of Flow of Control in a System of
Distributed Software Components
Nima Kaviani
1
, Michael Maximilien
2
, Ignacio Silva-Lepe
2
and Isabelle Rouvellou
2
1
University of British Columbia, Vancouver, Canada
2
IBM Watson Research Center, New York, U.S.A.
Keywords:
Platform-as-a-Service (PaaS), CloudFoundry, Introspection.
Abstract:
CloudFoundry (CF) provides an open source platform-as-a-service software for deploying scalable software
systems to the cloud. The architecture for CF is distributed by design and consists of several components which
interact with one another through a message-oriented middleware. This message-oriented distributed design
delivers on the scalability and resiliency requirements of the platform. In such a complex distributed multi-
component system, there is a steep learning curve for software developers to understand how components
interact, what messages are exchanged between them, and how the message exchanges affect the behaviour
of the system. In particular developers find it difficult to identify the execution flows, the authentication
flows, interactions with the persistence layer, etc. We have developed a framework that allows interpreting
the behaviour of the system by analyzing the exchanged messages between components, inspecting message
contents, and extracting data and control flow across components. The paramount aim is to improve develop-
ers’ understandability of the system and to examine software resiliency through approaches like bug injection
and message alterations. An initial version of our framework was released to the CF community and we have
collected feedback that indeed show that we are achieving some of our goals.
1 INTRODUCTION
Utilizing open source software (OSS) systems to
manage infrastructure, platforms, or applications is
increasingly popular in the domain of cloud comput-
ing (ope, a)(ope, b). With Openstack (ope, c) and
CloudStack (clo, a) as examples of widely adopted
open source Infrastructure-as-a-Service (IaaS) en-
ablers, and CloudFoundry (clo, b) and Open-
Shift (ope, d) as examples of open source Platform-as-
a-Service (PaaS) enablers, the anticipated role of OSS
in the cloud becomes more apparent than ever before.
As such, a lot of companies have started looking into
understanding, deploying, and extending these open
source platforms for their infrastructure. To name a
few examples, IBM is partnered with Openstack (ibm,
a) and CloudFoundry(ibm, b) to have their software
deployed on its infrastructure; and Baidu (bai, b) has
seven hundred developers working on CloudFoundry
enabled deployments (bai, a).
With the rapid development cycles for these
highly distributed open source cloud platforms, it has
become increasingly more difficult for software de-
velopers to understand and assess the behaviour of an
existing open source cloud platform, track evolutions
of software components across releases, or assess re-
liability of a new release. OpenStack has already
gone through eight major revisions, CloudFoundry
has moved from its first version to the second version,
and Eucalyptus has already made six releases. In such
a fast-evolving software ecosystem, developers and
architects adopting these technologies need to under-
stand the issues aforementioned to accurately answer
the following questions: i) How do the components
in the system interact with one another? What is the
flow of control and data in the system? What message
are exchanged and what are their types and contents?
ii) How is the system evolved from one release to an-
other? iii) How reliable is a new release with respect
to changes or use cases required by a target client?
and iv) How do we detect anomalies in the behavior
of the system?
Many of these cloud platforms share a com-
mon architectural design, i.e., a distributed multi-
component architecture in which component interac-
tions happen through synchronous or asynchronous
message exchanges. We developed an initial hypoth-
esis that by capturing all message exchanges across
381
Kaviani N., Maximilien M., Silva-Lepe I. and Rouvellou I..
Automatic Abstraction of Flow of Control in a System of Distributed Software Components.
DOI: 10.5220/0005407403810388
In Proceedings of the 5th International Conference on Cloud Computing and Services Science (CLOSER-2015), pages 381-388
ISBN: 978-989-758-104-5
Copyright
c
2015 SCITEPRESS (Science and Technology Publications, Lda.)

components in a cloud platform we should be able
to address the above questions as follows: i) through
message correlation and temporal analysis of message
exchanges we should be able to derive message se-
quences and identify the patterns of communication
across all messages in the system; ii) by analyzing and
comparing message contents across different releases
of a platform we should be able to track changes in
message exchange patterns and project on evolutions
at the level of system components; iii) by corrupting
or interfering with the pattern of message exchanges
we should be able to assess the resiliency of the plat-
form from one release to another; and iv) by collect-
ing a long enough history of message exchanges we
should be able to detect anomalies and irregularities
in the behaviour of the system by comparing the ex-
pected patterns of message exchange with the newly
observed message exchange patterns.
In this paper we discuss how using an instrumen-
tation technique we managed to extract sequences of
message exchanges for CloudFoundry, analyze mes-
sage context, and generate valuable information on
the behavior of the system to be shared with the com-
munity of CloudFoundry developers. We also provide
preliminary results of two releases of our framework
to CF developers and users inside IBM as well as to
the CF community at large. Finally, we discuss our
plans to utilize the current technique to provide auto-
mated approaches for software testing and validation.
2 BACKGROUND
2.1 Instrumentation and Profiling
Analyzing system behaviour is done either through
black-box profiling techniques or white box instru-
mentation strategies. In an instrumentation strategy,
code snippets are injected into the original source
code of the system under study in order to collect in-
formation on flow of control or data flow. In a pro-
filing process however, the behaviour of the system
is inferred through collecting footprints of system in-
teractions with the underlying framework, the current
platform, or the operating system which is used. The
collected data then is analyzed or interpreted to form
a view of the system’s behavior (Beschastnikh et al.,
2011). While data collected through black-box profil-
ing is usually insufficient in effectively tracking and
monitoring the behavior of a distributed system, in-
strumentation is also no panacea as it is typically hin-
dered by limited accessibility and comprehension of
system source code. Magpie (Barham et al., 2003),
MANTICORE (Kaviani et al., 2012), and ARM instru-
mentation (arm, ) are examples of systems that allow
tracing of code and data through instrumentation. At
the other end, Baset et al. (Baset et al., 2013), Aguil-
era et al. (Aguilera and et al., 2003), and Anandkumar
et al. (Anandkumar et al., 2008) provide solutions on
doing black-box tracking of software systems.
2.2 Aspect-oriented Programming
Aspect-Oriented Programming (AOP) (Kiczales
et al., 2001) provides an abstraction of program
execution with techniques that allow to change flow
of control or data in order to separate crosscutting
concerns spread across multiple abstraction layers in
the system from the functional requirements at each
abstraction layer. AOP is often conceptualized into
the three concepts of joinpoints, pointcuts, and ad-
vice. A joinpoint is a metaprogram event identifying
a distinguished point of interest in the program; a
pointcut defines a query on selecting a certain set
of joinpoints in the program; and an advice is a
function associated with a pointcut to be executed at
a matching joinpoint (Kiczales et al., 2001). AOP has
been widely used to analyze and monitor the behavior
of distributed systems by injecting monitoring and
analysis code into components of a system. The
works by Wohlstadter and Devanbu (Wohlstadter
and Devanbu, 2006) and Whittle et al. (Al Abed and
Kienzle, 2011) are examples of the efforts in utilizing
AOP instrumentation in software development and
modelling.
2.3 CloudFoundry Architecture
CloudFoundry v1.0 consists of the following major
components: the cloud controller manages the over-
all behaviour of the system and instructs the inter-
nal components of CloudFoundry on their roles; The
health manager monitors the well-being of the com-
ponents; the User Authorization and Authentication
(UAA) unit performs authorizations; the stager pre-
pares deployments; the Deployment Agent (DEA) de-
ploys the application and monitors its execution; and
the router directs traffic from outside CloudFoundry
into the deployed applications. Communication be-
tween CF components happens in two ways: a) asyn-
chronously through messages sent to the pub/sub mid-
dleware called the NATS server (nat, ) or b) syn-
chronously by exchanging HTTP messages. A typi-
cal workflow in CF starts by a client interface send-
ing a request to the CF controller through the router.
The cloud controller captures the incoming message
and initiates a series of message exchanges with other
components in the system to deliver on the received
CLOSER2015-5thInternationalConferenceonCloudComputingandServicesScience
382
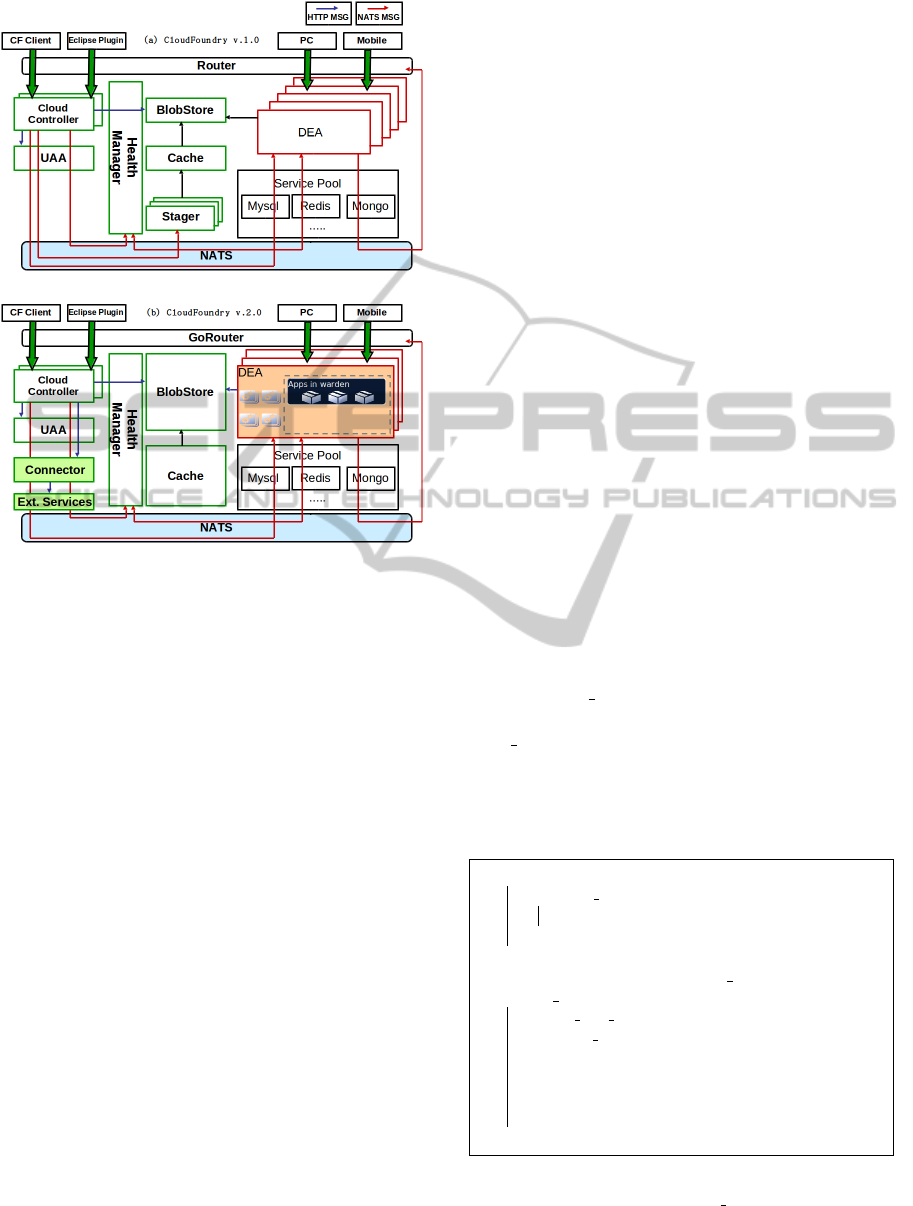
Figure 1: The overall architecture for (a) CloudFoundry
v1.0, and (b) CloudFoundry v2.0.
command. One of the biggest challenges with com-
prehending the platform involves understanding the
type and sequence of message exchanges during the
execution of each command. Figure 1(a) shows the
components in CF v1.0 and their message exchanges.
CloudFoundry v2.0 underwent significant re-
architecture which led to removing some of the com-
ponents and adding new components. The Stager
component was removed and replaced by a compo-
nent called Warden (internal to the DEA) which es-
sentially acts like a container for the deployment of
applications. Additionally, CF v2.0 introduced the
notion of buildpacks to enable new runtimes to be
added dynamically to the platform. However, despite
major architectural changes to some of CF v2.0 com-
ponents, the overall communication model stayed the
same from CF v1.0 to v2.0. Figure 1(b) shows the
architecture of CF v2.0.
3 APPROACH
3.1 Instrumenting CloudFoundry
Components
With CloudFoundry utilizing two methods of com-
munication, i.e., i) asynchronously through NATS
and ii) synchronously through HTTP messages, the
problem of intercepting message exchanges comes
down to understanding the enabling communication
libraries used by each CF component. For dispatch-
ing async NATS messages, CloudFoundry compo-
nents use the NATS client library. Similarly, for sync
messages, CloudFoundry components use the Ruby-
based REST-HTTP-Client library. For both NATS
and HTTP messages, the challenge of instrument-
ing CloudFoundry components, involves altering the
code for these libraries to include the profiling code,
and capturing message types, message content, and
other required information.
Rather than trying to understand the internals of
every CF component and how the communication li-
braries are used, we took a reverse-engineering ap-
proach which led to a more systematic and automatic
approach to profiling the CF components. First, we
studied the internals of the code for the client libraries
(both NATS and REST HTTP) and then used Aquar-
ium (aqu, ) - a Ruby AOP framework - to automate
detect calls and weave profiling code into CF compo-
nents. Aquarium builds on the premise of AOP to sep-
arate the main functional code from code that consti-
tutes cross-cutting concerns. Particularly in our case,
the cross-cutting concerns were points of message ex-
change across all components in CloudFoundry.
Let us take the code for Algorithm 1 as an example
of how Aquarium works. The simple code snippet
defines a test method in a Test class. The bottom
of Algorithm 1 presents an aspect defined around the
test method to add print-outs before and after the
original body of the method. At runtime, the aspect
hooks Aquarium to the execution of the Test class
code where it re-writes the body of the Test class to
execute the pre- and post-advice respectively before
1 class Test
2 def test method
3 puts ‘‘Hello World!’’
4 end
5 end
6 Aspect.new :around, :calls to =>
‘‘test method’’,
7 :type and descendents => ‘‘Test’’,
:method options[:public] do |jpt, obj,
*args|
8 puts ‘‘Pre-Aspect Execution.’’
9 result = jpt.proceed
10 puts ‘‘Post-Aspect Execution.’’
11 end
Algorithm 1: Example of using Aquarium to write an as-
pect around the body of the test method from the Test
class.
AutomaticAbstractionofFlowofControlinaSystemofDistributedSoftwareComponents
383
1 class Test
2 def aspect saved Test test method
3 puts ‘‘Hello World!’’
4 end
5 def test method *args, &block for method
6 # advice chaining
7 puts ‘‘Pre-Aspect Execution.’’
8 : aspect saved Test test method
9 puts ‘‘Post-Aspect Execution.’’
10 end
11 end
Algorithm 2: The re-written Test class after applying the
aspect from Algorithm 1.
1 Aspect.new
2 :around,
3 :calls to => /(send|receive) data/,
4 :type and descendents =>
5 [/(NATSD|EventMachine)::(.*)/,
6 /(NATS|EventMachine)::(.*)::(.*)/],
7 :method options[:public] do |jpt, obj,
*args|
8 # analyzing captured NATS messages
9 end
Algorithm 3: The aquarium aspect to capture NATS mes-
sages in CloudFoundry.
and after the target method of the aspect. Algorithm 2
shows the modifications Aquarium makes to the body
of the Test class in order to include the advice.
The NATS client used in CloudFoundry compo-
nents is developed on top of the EventMachine (eve,
) library that implements a reactive pattern for asyn-
chronous communications with the NATS server.
When exchanging messages with the NATS server,
the client calls the send method from EventMachine
which then calls an internal C-library to dispatch the
message to the server. When receiving messages
from the server, the NATS client extends the NATS
template from EventMachine by implementing the
receive method which can then extract and interpret
the content of the message received from the NATS
server. In order to capture NATS messages, we de-
veloped an aspect that would mine every CF com-
ponent’s code for the given methods and weave our
profiling code into it. The code to capture NATS
messages is shown in Algorithm 3. Similarly for the
HTTP REST Client, mining its code revealed that
each REST call is done through calling the request
method in the library. This method receives the end-
point URL for the REST call as well as the parameters
to be included, makes the invocation to the endpoint,
and blocks until a response is received.
The process of instrumenting CF components in-
volves having aspects added to the execution entry
point of every component in CF. Starting the com-
ponent engages Aquarium which searches the com-
ponent code to find the matching pointcuts and inject
the advice from the aspect.
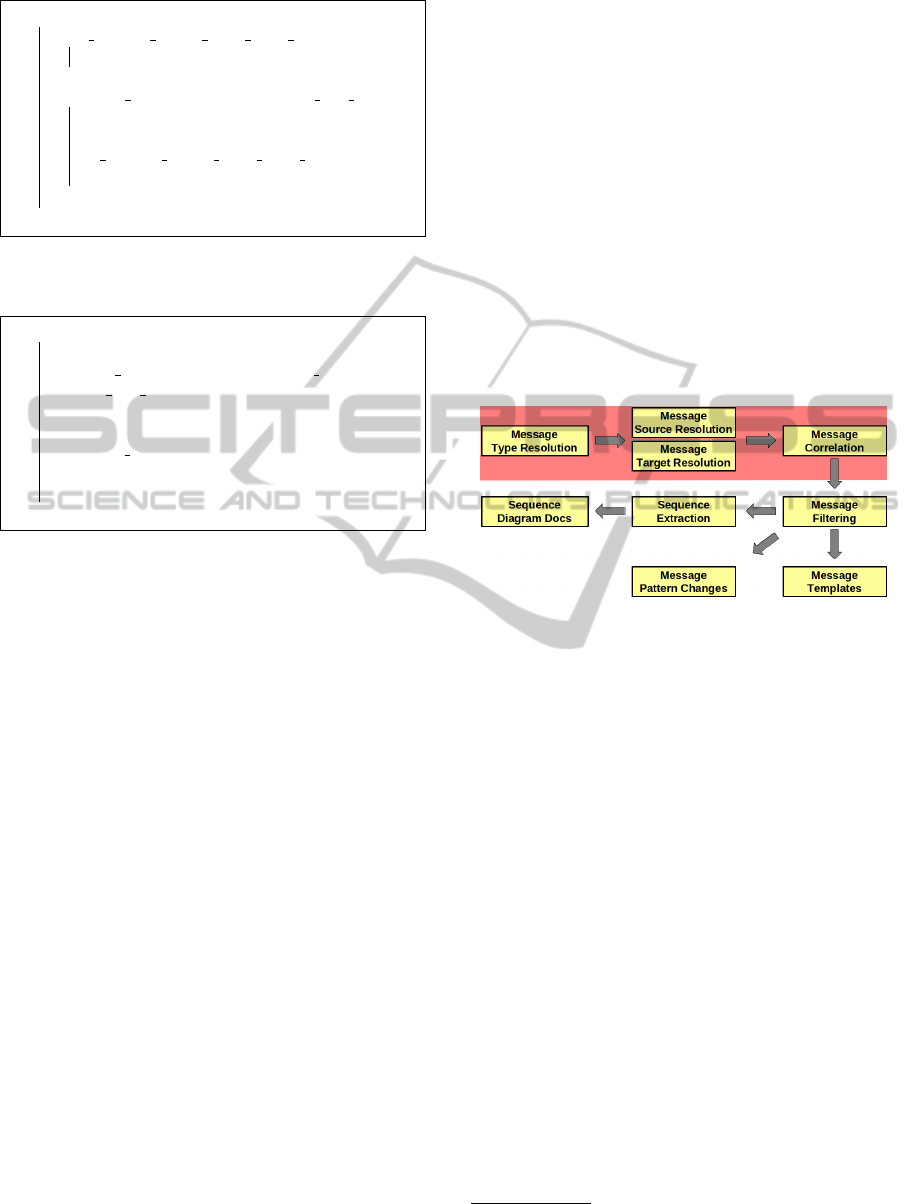
3.2 Analyzing CF Message Exchanges
Once the aspects are developed and added to every
component, captured messages are collected and an-
alyzed to extract their functional and temporal corre-
lations. The advice code for all the aspects involves a
short code snippet that dispatches collected message
information to a centralized analysis server. Figure 2
shows the set of tasks done by the analysis server.
The tasks can be categorized into two high level cat-
egories: i) Message Pattern Analysis and Correlation
and ii) Message Sequence Analysis.
Figure 2: The overall architecture for the analysis server.
3.2.1 Message Patterns and Correlations
As shown at the top of Figure 2, message pattern anal-
ysis and correlation involves resolving message types
as well as detecting the source and the target compo-
nent for each message.
For NATS messages, this is done by analyzing
subscriptions and publications to NATS channels for
every CF component. Components in CloudFoundry
announce their registrations to a channel by send-
ing a subscription message through the NATS send
method. The analysis server receives these subscrip-
tion messages and stores a map of all the channels
with their subscribers. At a later point in time, once a
publish message is received by the analysis server, it
searches through all the channels in its directory and
correlates the component sending the message to the
components previously subscribed to the channel.
HTTP communications are done by components
targeting the REST API endpoints of other compo-
nents. The analysis server maintains a list of the APIs
it is aware of at any given time, which it extracts from
the requests it receives as they come in
1,2
. Upon an
1
Cloud controller’s target API is http://api.vcap.me
2
UAA’s target API is http://uaa.cvap.me.
CLOSER2015-5thInternationalConferenceonCloudComputingandServicesScience
384

HTTP request call, the analysis server identifies the
endpoint where the HTTP message is directed to and
maps the endpoint to its corresponding component.
3.2.2 Message Sequences
As mentioned earlier, a workflow in CloudFoundry
starts by a client interface sending a message to the
cloud controller. In order to be able to capture
message exchange sequences we employed a snap-
shotting technique as follows: we instrumented the
command line interface (CLI) bundles embedded in
CloudFoundry in such a way that it would notify the
analysis server at the beginning and end of any com-
mand execution. When the message arrives at the
server, the server marks the start of a new work-
flow execution and records all message exchanges and
their temporal order to the point it receives a termina-
tion command from the CLI. Upon receiving a ter-
mination command all the captured messages are as-
signed to the latest executed CF command. Generat-
ing the message sequence however, requires two con-
siderations:
1. Not all messages captured during the snapshot-
ting process are dispatched in response to the exe-
cuted command. To accurately capture message se-
quences, the analysis server employs two strategies to
identify and dismiss irrelevant messages: i) Cloud-
Foundry components may dispatch heartbeat mes-
sages or registering/unregistering messages to some
pre-defined NATS channels irrespective of the com-
mand being executed
3
. The analysis server ignores
messages published to these channels during an snap-
shotting process. ii) Another strategy in reducing
noise comes as a consequence of a prolonged mon-
itoring process of message exchanges. Upon collect-
ing a long enough trace of exchanged messages, the
analysis server goes through all message snapshots
and assigns an occurrence frequency rate to each mes-
sage in a snapshot. Messages whose occurrence fre-
quencies fall below a given threshold can be elimi-
nated from the generated sequence.
2. CloudFoundry allows for more than one CLI
to dispatch messages to the cloud controller. How-
ever distinguishing messages dispatched by different
CLIs requires detailed tracing of data flows which are
not currently implemented into our profiling tool and
analysis server. In order to avoid interference from
several CLIs we run our CF deployment and the CLI
in a completely controlled environment where only
one instance of the CLI is allowed to dispatch mes-
sages to the CF deployment.
3
e.g., dea.heartbeat is a channel used by DEA to no-
tify the Health Manager of their well being.
Figure 3 shows an example of the message se-
quence captured by the analysis server. As shown
in the figure, the sequence starts by the vmc CLI
(the embedded CLI for CF v1.0) sending a mes-
sage to the cloud controller which then triggers a se-
quence of message exchanges between CF compo-
nents before returning a response to the CLI. The
generated sequence diagram has the message types
color coded, with the HTTP messages shown as blue
(darker colour in grayscale) arrows and NATS mes-
sages shown as green (lighter colour in grayscale) ar-
rows. For HTTP messages, labels above the arrows
show the HTTP request method and the end point the
message is directed to. For NATS messages the label
shows the name of the channel to which the message
is published.
We code-named the generated documentations as
BlueDocs. The detailed list of all captured message
sequences for all commands both in CF v1.0 and CF
v2.0 can be found under our CloudFoundry BlueDocs
GitHub repository (cfb, a).
4 EVALUATION
For the purpose of our evaluations, we took two strate-
gies: i) tracking evolution from CF v1.0 to CF v2.0 by
analyzing changes in message exchange patterns, and
ii) sharing our results with the community of CF de-
velopers and surveying them to assess the benefits of
our generated documentation.
4.1 Comparing CF v1.0 and v2.0
In our first evaluation, we provided comparison of
message exchange patterns across different versions
of CF. In Section 2, we mentioned that despite archi-
tectural changes from CF v1.0 to CF v2.0 the meth-
ods of synchronous and asynchronous communica-
tion stayed the same. For each version of CF, we gen-
erated documentation on message exchange templates
including the communication channel names and the
message contents. We converted the generated doc-
uments into sorted comparable strings and used the
minimum edit distance algorithm (Atallah and Fox,
1998) to capture differences between the two message
templates. We then compared the generated results
with the message templates we captured through our
prolonged tracing of message exchanges and updated
the comparison results. For the NATS messages, we
detected 24 different communication channels in CF
v1.0. Out of these channels, two had their names
changed from CF v1.0 to v2.0, one channel was re-
moved, and five new channels were added. Also for
AutomaticAbstractionofFlowofControlinaSystemofDistributedSoftwareComponents
385
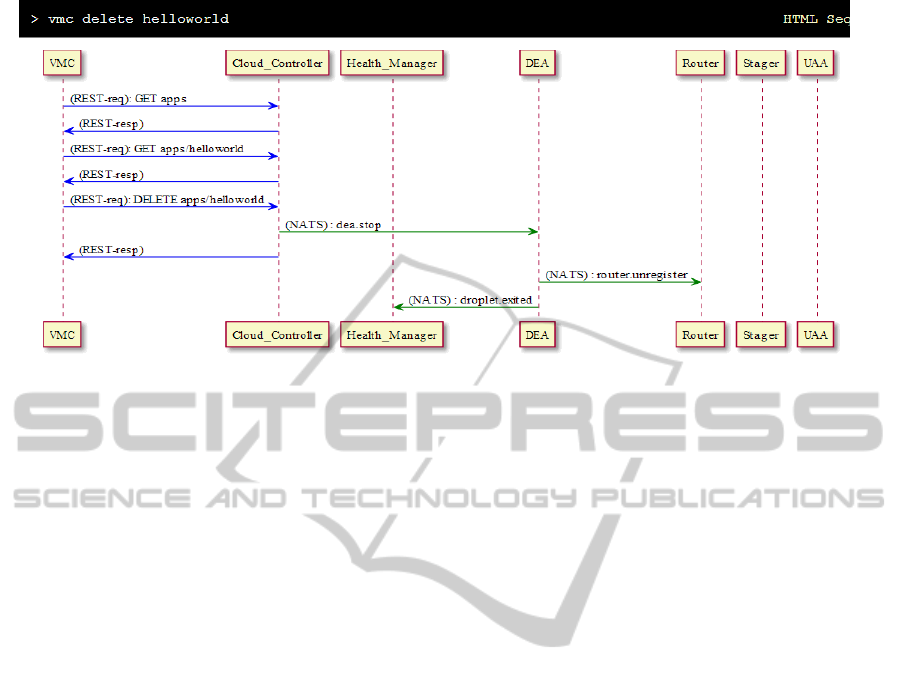
Figure 3: The sequence of exchanged messages for vmc delete with blue arrows showing HTTP messages and green arrows
showing NATS messages.
all message templates captured, we discovered 222
key-value pairs in total out of which 28 keys were
removed from v1.0 to v2.0, 12 were added, and 10
had their types changed. Details are available on the
BlueDocs website (cfb, b).
4.2 Surveying the Developer
Community
For the second evaluation, we presented the results
of our instrumentation and analysis to the developer
community for CloudFoundry. We asked the commu-
nity to fill out a short survey with the following five
questions:
1. Have you ever felt the need for documentation on
internals of CloudFoundry? If yes, how do you
find this documentation?
2. Do you think knowing details of CloudFoundry
components, message types, and message se-
quences helps for the type of work you do with
CloudFoundry?
3. Do you find the BlueDocs on message exchanges
in CloudFoundry helpful?
4. What do you find useful in the auto-generated
BlueDocs documentation for CloudFoundry?
5. What additions or modifications do you like to see
in the BlueDocs CloudFoundry documentation?
We received 12 responses from the CloudFoundry
developers, 6 from within IBM and 6 from the open
source community. All respondents described them-
selves as developers or system architects working on
the internals of CloudFoundry.
When asked about their needs to have documenta-
tions on the internals of CloudFoundry, all 12 respon-
dents replied with a yes. Also, out of all who took
the survey, all except for one thought that such docu-
mentation on the internals of CloudFoundry would be
helpful for the type of work they were doing.
We then asked the CF developers to investigate the
generated BlueDocs documentation and tell us if they
find it useful. The survey showed that 9 out of the 12
participants found the generated documentation help-
ful. When asked about what they found interesting in
the generated BlueDocs, the developers made inter-
esting statements like the followings: “it might allow
for auto-generated ”diffs” of the documentation be-
tween versions. I don’t trust that the APIs of CF will
be stable - the core team doesn’t seem to have API
stability in the heart & soul. So it will be important
for us to identify the changes in the internal APIs.”.
We also received comments that pinpointed problems
such as: “I would rather the message content be for-
malized as classes. The interactions are somewhat
interesting. It doesn’t guarantee that if someone is
posting, that there is in fact a listener who cares”.
The developers continued to make interesting in-
sights and suggestions as a response to our last ques-
tion. The following suggestions were made by our
respondents: “Correlate/integrate BlueDocs with ex-
isting documentation [on CloudFoundry].” or “I’m
looking for flow diagrams, description of each func-
tion, and how each module idempotently operates
for specific application lifecycle functions (e.g., push
app, start app, delete app, create service, bind ser-
vice, identify unresponsive app, etc)”.
CLOSER2015-5thInternationalConferenceonCloudComputingandServicesScience
386

5 FUTURE WORK AND
CONCLUSIONS
In this paper we discussed our work developing a
framework that would allow for software analysis,
documentation generation, testing, and debugging,
particularly targeted towards the Ruby-based open
source cloud platform: CloudFoundry. The aim of the
work is to enable developers to better understand and
analyze patterns of message exchange across compo-
nents in CloudFoundry. Our early analysis of the re-
sults showed significant interest from the open source
community in having this type of analysis in place.
We are extending the framework to enable message
tacking, data flow analysis, resiliency testing, and in-
creased automation in order to improve the accuracy
of collected data and make it more readily available
to the open source developer community.
Throughout the development process of our anal-
ysis framework, we encountered several challenges
that we had to resolve in order to make the framework
functional. The first challenge is inherent to AOP. For
our type of instrumentation, defined pointcuts were
tightly coupled to the signature of the target methods
of interest. This is restrictive in that our aspects code
are only good for as long as the methods in the tar-
get libraries preserve their signature. Any change in
the signature of the methods of interest would result
in unmatched pointcuts. A more generic approach
could search for all functions of a library establish-
ing a network connection and then capture exchanged
messages. A second challenge was with respect to in-
jecting the profiling code into every CF component’s
code. Ruby, as a scripting interpreter-based language,
does all the loading and linking at runtime. For the
profiling code to capture and instrument the target
methods in a Ruby program, it should be added to
the component’s code after the library of interest is
loaded. We are developing a Domain Specific Lan-
guage (DSL) in Ruby that could be utilized for auto-
matic runtime injection of aspects to the code while
verify if a given library is already loaded.
For the future work, we intend to focus on the fol-
lowing: (i) Software Resiliency: We believe our de-
veloped framework can help with software resiliency
through interrupting, corrupting, or modifying mes-
sage exchanges. In the current implementation, the
analysis server makes no interferences to the content,
order, or pattern of message exchanges. However, to
test resiliency, the analysis server can have a more ac-
tive role by allowing messages to be dropped, or by
modifying message content, and monitoring how the
change in the content or pattern of messages affects
the overall behaviour of the system. (ii) Testing & De-
bugging: One major issue with debugging distributed
systems is that often times the source of a problem
is not in close proximity of where the failure is ob-
served. When debugging, the long history of infor-
mation for message exchanges allows to see for each
component fan-in and fan-out of message exchanges
to track a message back to the source of a discrepancy.
Our strategy for testing and debugging relies on col-
lecting a long enough history of messages exchanged
and testing the newly arriving messages against the
expected pattern of a given workflow.
REFERENCES
OpenStack - Online: http://www.openstack.org/.
CloudStack - Online: http://cloudstack.apache.org/.
CloudFoundry - Online: http://www.cloudfoundry.com/.
OpenShift - Online: https://www.openshift.com.
Baidu Corp. - Online: http://baidu.com.
ARM - Online: http://www.opengroup.org/tech/
management/arm/.
NATS library - Online: https://github.com/derekcollison/
nats/.
Aquarium: Aspect-Oriented Programming for Ruby - On-
line: http://aquarium.rubyforge.org/.
EventMachine - Online: https://github.com/eventmachine/
eventmachine.
CloudFoundry BlueDocs - Online: https://github.com/
nkaviani/cloudfoundry-bluedocs/.
CloudFoundry BlueDocs version comparison - Online:
http://rawgit.com/nkaviani/cloudfoundry-bluedocs/
master/cf-v2/docs/output.html.
(2012). In Openness is Winning in the Cloud - Online:
https://www.linux.com/news/featured-blogs/200-
libby-clark/577866-marten-mickos-openness-is-
winning-in-the-cloud.
(2012). IBM Announces Platinum Sponsorship
of the New OpenStack Foundation - Online:
http://www.openstack.org/blog/2012/04/openstack-
foundation-update/.
(2013). The role of open source in cloud infrastruc-
ture - Online: http://www.informationweek.in/
informationweek/news-analysis/176401/role-source-
cloud-infrastructure.
(2013). IBM and Pivotal to Accelerate Open Cloud Inno-
vation with Cloud Foundry - Online: http://www-03.
ibm.com/press/us/en/pressrelease/41569.wss.
(2013). Baidu report on CloudFoundry - Online:
http://www.slideshare.net/wattersjames/baidu-
cloudfoundry-english-24626493.
Aguilera, M. K. and et al. (2003). Performance debugging
for distributed systems of black boxes. SIGOPS Oper.
Syst. Rev., 37(5):74–89.
Al Abed, W. and Kienzle, J. (2011). Aspect-Oriented Mod-
elling for Distributed Systems. volume 6981, pages
123–137.
AutomaticAbstractionofFlowofControlinaSystemofDistributedSoftwareComponents
387

Anandkumar, A., Bisdikian, C., and Agrawal, D. (2008).
Tracking in a spaghetti bowl: monitoring transac-
tions using footprints. In Proceedings of the 2008
ACM SIGMETRICS international conference on Mea-
surement and modeling of computer systems, SIG-
METRICS ’08, pages 133–144, New York, NY, USA.
ACM.
Atallah, M. J. and Fox, S., editors (1998). Algorithms and
Theory of Computation Handbook. CRC Press, Inc.,
Boca Raton, FL, USA, 1st edition.
Barham, P., Isaacs, R., Mortier, R., and Narayanan, D.
(2003). Magpie: Online Modelling and Performance-
aware Systems. In HotOS, pages 85–90.
Baset, S. A., Tang, C., Tak, B., and Wang, L. (2013). Dis-
secting Open Source Cloud Evolution: An OpenStack
Case Study. In HotCloud, pages 333–340. IEEE.
Beschastnikh, I., Brun, Y., Schneider, S., Sloan, M., and
Ernst, M. D. (2011). Leveraging existing instrumenta-
tion to automatically infer invariant-constrained mod-
els. In SIGSOFT FSE, pages 267–277. ACM.
Kaviani, N., Wohlstadter, E., and Lea, R. (2012). MAN-
TICORE: A framework for partitioning software ser-
vices for hybrid cloud. In CloudCom, pages 333–340.
IEEE.
Kiczales, G., Hilsdale, E., Hugunin, J., Kersten, M., Palm,
J., and Griswold, W. G. (2001). An Overview of As-
pectJ. In Proceedings of the 15th European Confer-
ence on Object-Oriented Programming, pages 327–
353.
Wohlstadter, E. and Devanbu, P. (2006). Transactions on
Aspect-Oriented Software Development II. pages 69–
100. Springer-Verlag, Berlin, Heidelberg.
CLOSER2015-5thInternationalConferenceonCloudComputingandServicesScience
388
