
VisMinerTD
An Open Source Tool to Support the Monitoring of the Technical Debt Evolution
using Software Visualization
Thiago S. Mendes
1,3
, Daniel A. Almeida
2
, Nicolli S. R. Alves
2
, Rodrigo O. Spínola
1,2
,
Renato Novais
1,3
and Manoel Mendonça
1
1
Fraunhofer Project Center for Software and System Engineering at UFBA, Salvador, Brazil
2
Salvador University – UNIFACS, Salvador, Brazil
3
Federal Institute of Bahia – IFBA, Salvador, Brazil
Keywords: Technical Debt, Software Visualization, Metrics, Software Maintenance, VisMinerTD.
Abstract: Software development and maintenance activities can be negatively impacted by the presence of technical
debt. One of its consequences is the software quality decrease. In order to produce better software, the
evolution of technical debt needs to be monitored. However, this is not a trivial task since it usually requires
the analysis of large amount of data and different types of debt. The areas of metrics and software
visualization can be used to facilitate the monitoring of technical debt. This paper presents an open source
tool called VisMinerTD that uses software metrics and visualization to support developers in software
comprehension activities including the identification and monitoring of technical debt. VisMinerTD brings a
new perspective to the hard work of identifying and monitoring technical debt evolution on software
projects. Moreover, the user can easily plug new metrics and new visual metaphors to address specific
technical debt identification and monitoring activities.
1 INTRODUCTION
The quality of software under maintenance often
decreases over time. This is especially true when
considering aspects such as its internal structure,
adherence to standards, and documentation (Lientz
et al., 1978); (Lehman and Belady, 1985); (Parnas,
1994). One reason is that maintenance activities are
often carried out under stringent constraints of time
and resources.
To deal with this scenario, the metaphor of
Technical Debt (TD) has helped some professionals
to discuss software maintenance issues (Seaman and
Guo, 2011); (Kruchten et al., 2012). The concept of
TD illustrates the problem of pending maintenance
tasks as a type of debt that brings a short-term
benefit to the project, but that may have to be paid
with interest later in the development process
(Seaman and Guo, 2011); (Izurieta et al., 2012).
It is common that software projects incur debts
during its development process, since small amounts
of debt can increase productivity (Spínola et al.,
2013). On the other hand, the presence of the debt
brings risks to the project. So, it is worthwhile to
manage it. An important step for an effective
management of the debt is its identification and
monitoring. However, this is still a difficult task for
both researchers and practitioners (Guo et al., 2014).
Software comprehension is a pre-requisite for
maintenance activities. Researchers have identified
that 50% of the time spent on maintenance are used
in understanding the software (Fjeldstad and
Hamlen, 1983). Techniques of information (Chen,
2004) and software (Diehl, 2007) visualization have
been used in software engineering as a possible
solution to the task of software comprehension.
They help to maintain, test and develop software
systems using visual resources (Storey et al., 2005).
However, although automated approaches are
proving effectiveness in supporting the identification
of TD (Zazworka et al., 2013), software
visualization approaches have not been widely used
yet to support this task.
In this context, this paper presents the tool called
VisMinerTD. This tool aims to support developers
457
S. Mendes T., A. Almeida D., S. R. Alves N., O. Spínola R., Novais R. and Mendonça M..
VisMinerTD - An Open Source Tool to Support the Monitoring of the Technical Debt Evolution using Software Visualization.
DOI: 10.5220/0005464804570462
In Proceedings of the 17th International Conference on Enterprise Information Systems (ICEIS-2015), pages 457-462
ISBN: 978-989-758-097-0
Copyright
c
2015 SCITEPRESS (Science and Technology Publications, Lda.)
in the identification and monitoring of TD in
software projects through the extraction of metrics
and the use of software visualization. VisMinerTD is
a free, open source and extensible tool. The user can
use its existing features, or easily plug new metrics
and new visual metaphors to address specific TD
identification and monitoring activities.
The main contribution of this position paper is
the definition of VisMinerTD. We hope it can
stimulate the using of software visualization
techniques on the TD area. Besides, it will be briefly
discussed how these techniques have been currently
used for the identification and/or monitoring of the
evolution of TD in software projects.
In addition to this introduction, this paper is
organized as follows. Section 2 presents how
software visualization has been used to support the
identification and monitoring of TD activities.
Section 3 presents the VisMinerTD, focusing on its
architecture, and how it can be used and expanded.
Section 4 presents a proof of concept for this tool.
Finally, Section 5 presents concluding remarks and
next steps of this research.
2 SOFTWARE VISUALIZATION
FOR TECHNICAL DEBT
Software visualization (SV) techniques have been
used in software engineering as a possible solution
to the task of software systems understanding. SV
uses visual aids to facilitate software
comprehension. Visual resources are increasingly
exploited by the fact that the vision is the most used
sense by humans (Novais et al., 2013).
SV techniques can support the developer in the
identification and/or monitoring of different types of
TD. Thus, it is important to investigate which visual
metaphors have been proposed and what are the
platforms being used to show them.
To this end, our research group conducted a
systematic mapping study (will be available soon)
on TD and SV. One of the research questions was:
“What software visualization techniques were
proposed to identify and/or manage the TD?”.
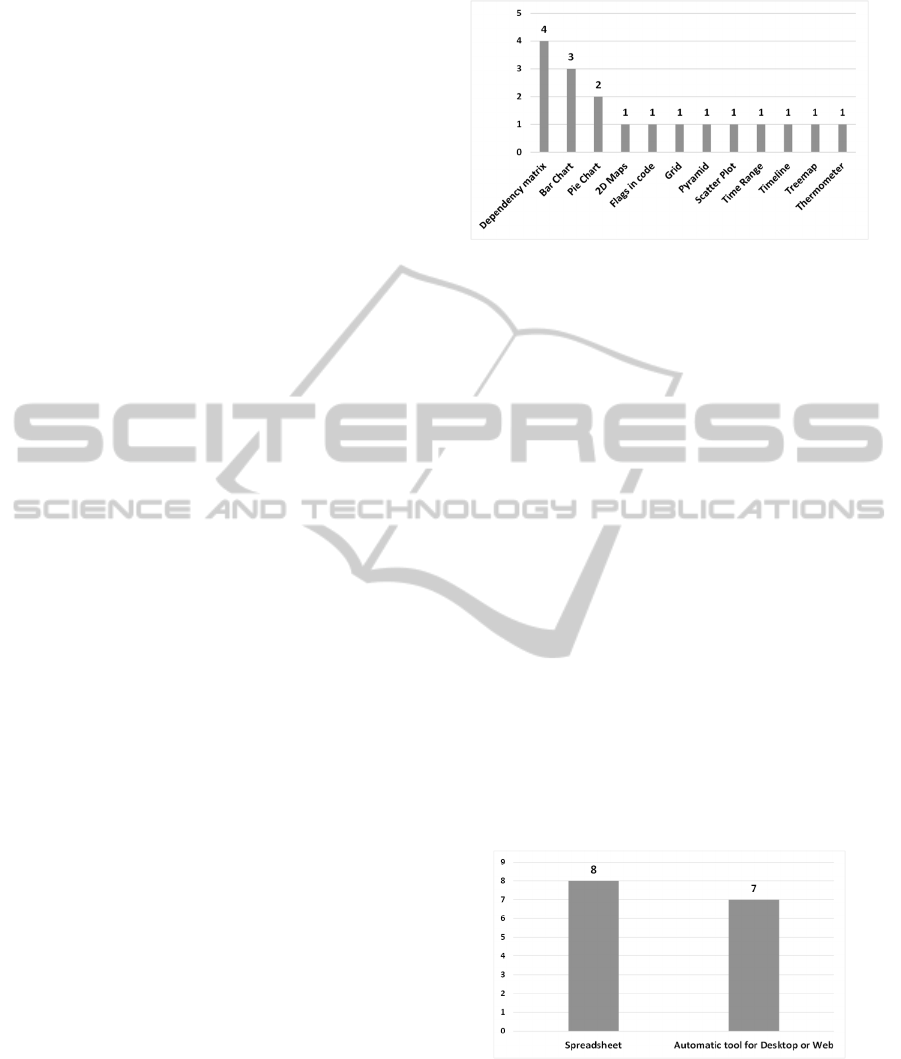
Were selected 69 studies in 8 digital libraries. Figure
1 summarizes the results of this question. Only 17 of
69 primary studies proposed visual metaphors in the
context of TD. The most proposed metaphors were
dependency matrix, bar graph, and pie chart format,
respectively. We observed that there is a low use of
SV on this context. In other words, this is fairly
unexplored research area.
Figure 1: Quantity of visual metaphors types proposed to
identify TD.
One challenge that rises here is to investigate
different types of visual metaphors already used on
other contexts of software maintenance and
evolution (Novais et al., 2012); (Novais et al., 2013);
(Novais et al., 2013a), and adapt them to identify
and/or monitor TD.
Another interesting result can be seen in Figure
2. The most common type of platform used to
display graphics is the spreadsheet. This kind of
manual solution is far from ideal, as it requires a lot
of effort to record the data extracted from the
software project and to keep it up-to-date.
3 VisMinerTD
VisMinerTD is a tool that aims to improve software
comprehension through the use of software metrics
and software visualization. VisMinerTD is intended
to be a free, extensible, open source software
comprehension tool to assist the developer to
identify and monitoring TD on software projects.
Figure 2: Quantity of platforms types used to display the
visual metaphors.
The tool extracts data from the local GIT
repository, calculates software metrics and stores the
information in a local relational database system.
The tool also provides a set of visual metaphors that
allows visual exploration of the analyzed data.
ICEIS2015-17thInternationalConferenceonEnterpriseInformationSystems
458
Currently, VisMinerTD also extracts additional
project information (milestones and issues) from
GITHUB repository.
The design of the VisMinerTD was divided into
two modules: (i) the first module has all of the
features for data extraction from the source code
repository and the GITHUB, calculation of the
metrics, and storage of them in the local database; ii)
the second module has the functionalities to recover
the information from the local database and show
them through visual metaphors in a web browser.
VisMinerTD was built to be customized. It
allows the user to use the existing metrics or to plug-
in new ones. The user only needs to fork the project
in VisMinerTD repository (VisMinerTD GIT
repository, 2015).
Currently, our research group is already
developing some metrics in the context of TD
related to source code. The tool has four metrics
tested and working properly, which is available for
all users: Lines of Code (LOC), Cyclomatic
Complexity (CC), Number of Classes (NOC), and
Number of Methods (NOM).
Besides, we are developing different web based
visualizations to help in TD identifying and
monitoring activities. Thus, both the developer and
the project manager will be able to follow the
evolution of software under development as well as
to find out possible problems in the project.
3.1 Architecture
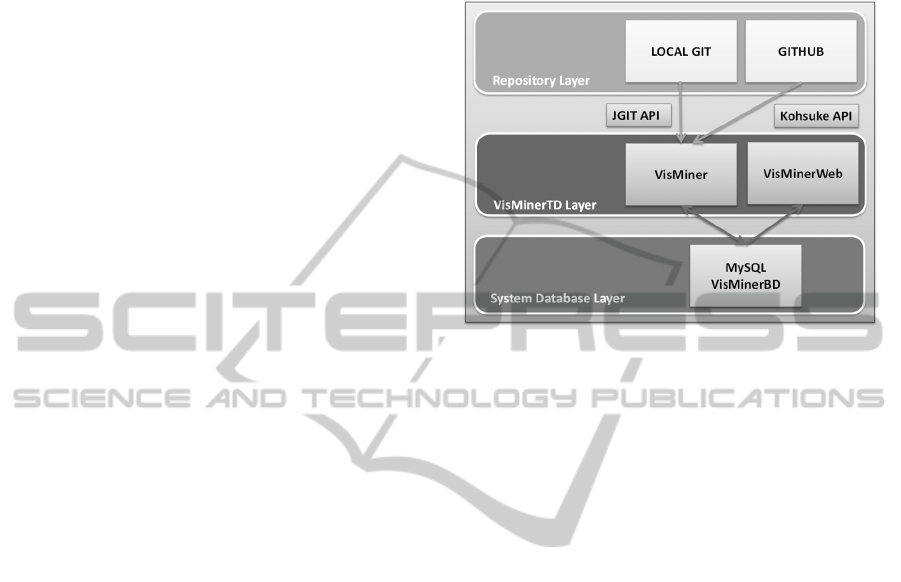
VisMinerTD is composed of two modules: VisMiner
and VisMinerWEB (see Figure 3). The first one,
VisMiner, is written in Java. It uses JGit API (JGit,
2015) to read the project code from the local GIT. It
calculates the metrics of each version of the project
and stores them in the database. The tool also
extracts existing issues and milestones from GitHub
via a Kohsuke API (Kohsuke, 2015) and stores them
in the local database.
One of the main challenges for software
visualization tools is to guarantee the efficiency of
the data extraction and analysis process. This task is
time consuming, particularly when there is a project
with multiple versions and hundreds of thousands of
lines of code. To overcome this issue, VisMinerTD
uses a local database to store the analyzed data. It
works with MySQL, and can easily be integrated to
other Database Management Systems (DBMSs).
Once the data is stored, the user can quickly
manipulate it.
The database structure of VisMinerTD is
automatically created on the developer’s computer.
To do this, it is necessary for the user to have
MySQL installed on its computer and an empty
database created. The data model is available with
the source code of the VisMiner project.
Figure 3: VisMinerTD architecture.
The second module, VisMinerWEB, is written in
Python and uses visual metaphors developed in
JavaScript. As all the information is generated and
stored in a structured database, the process of
creating visual metaphors for VisMinerTD becomes
much easier. The views can, for example, be created
from visual libraries such as (D3.js, 2015), (Google
Chart Tools, 2015), and (High Charts, 2015) that
already have several metaphors developed in
JavaScript language. Those visual libraries can be
adapted to the context of software visualization to
help in the identification of source code anomalies
such as, code smells, violation of modularity among
others.
3.2 Use and Expansion
The philosophy behinds the VisMinerTD
construction is twofold: 1) the tool must be easy to
use and 2) the tool should allow developers expand
its features according to their need. For this reason,
the architecture design was created to be easy to
understand, customize and use.
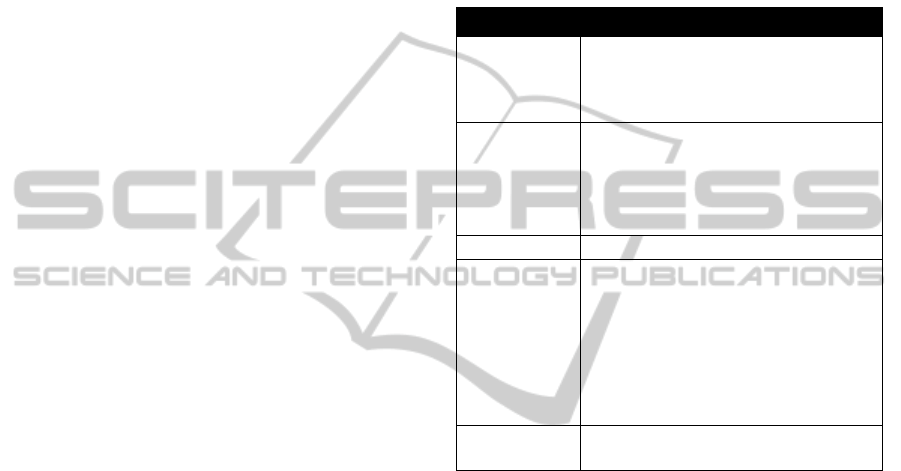
Our goal is that the VisMinerTD has a large
number of views to allow the identification and
monitoring of several types of TD. It will address
different perspectives considering TD indicators that
were mapped from the Technical Debt literature
(Alves et al., 2014). Some of the identified
indicators are presented on Table 1.
If the user is aware that the views already
available are not enough to visualize a specific type
of debt, he will be able to access the project site on
VisMinerTD-AnOpenSourceTooltoSupporttheMonitoringoftheTechnicalDebtEvolutionusingSoftware
Visualization
459
the VisMinerTD in GIT, read the instructions, look
at the database model that is available along with the
tool, and create your own views according to his
needs.
To use the tool, the user must access the project
page, where he can have access to all the
information on how to use VisMinerTD
(VisMinertTD Site, 2015). To collaborate with the
project the user must access the Wiki (VisMiner
Wiki, 2015), and read the tool installation and
creation of new metrics/views tutorials. The user can
also report bugs or suggestions of new features.
To facilitate the source code management and
allow the use of the two modules of the project in an
independent way, we decided to create two different
repositories: VisMiner and VisMinerWeb. Thus, the
user can decide if he wants to use only the
functionality of metrics extraction and/or access the
visual metaphors.
4 EXAMPLE OF USE OF
VisMinerTD
The current version of VisMinerTD enables its users
to analyse a software repository over time. It helps
an user to identify and monitor potential signs of TD
through two main features: i) Overview and ii)
Detailed View.
i) Overview: provides a high level view of the
project by creating a timeline containing every
Java class in the project that fit a given set of
filters determined by the user, including the
available metrics and a period of time. Although
it cannot determine the existence of TD in the
project, the Overview feature allows the user to
easily detect characteristics that may signal that a
problem exists, such as a god class. Figure 4
shows an example of overview feature.
ii) Detailed View: provides a detailed view of any
Java class in the project during a period of time.
By using a line chart, it enables the user to see
how the available metrics varied over time and
their values for each commit. Figure 5 shows an
example of detailed view feature.
To demonstrate how the VisMinerTD can be used,
we propose the following hypothetical scenario: a
lead engineer working on the Project Floodlight, an
open source project hosted at GitHub, runs
VisMinerTD and uses both features to analyze the
state of the project and draw some conclusions.
While the current version of the tool is not able
to identify directly a God class (a well known
indicator of TD (Alves et al., 2014), he can use the
available features to help him identify potential God
classes. Taking into account not only his previous
experiences but also the size and characteristics of
the project, he sets some of the available filters
(based on the metrics collected by the tool) to have a
overview of the project.
Table 1: Indicators by type of Technical Debt (Alves et al.,
2014).
TD Type Indicators
Architecture
Debt
Betweeness Centrality
Software Architecture Issues
Structural Dependencies
Violation of Modularity
Code Debt
ASA Issues
Code Metrics
Code outside of standards
Duplicated code
Multithread correctness
Slow Algorithm
Defect Debt Uncorrected known defects
Design Debt
ASA Issues
Code Smells (Brain Method, Data Class,
Data clumps, Dispersed Coupling,
Duplicated Code, God class (or large
class), Schizophrenic Class, Refused
Parent Bequest, Intensive Coupling)
Code Metrics
Grime
Structural Analysis
Test Debt
Incomplete Tests
Low coverage
The Overview feature is then used to identify
classes that satisfy the following conditions: at least
1500 lines of code and 10 methods from January 01,
2012 to December 31, 2013 (see Figure 4). It is easy
for him to notice that some of the classes in the
project might need some attention. For instance, the
file ‘‘TopologyImpl.java’’ was larger than
1500 lines of code and had more than 10 methods
for a brief period of time near April 2013. While he
might be interested in this file, he is probably more
concerned about files such as “ControllerTest.java”,
which was larger than 1500 LOC, had more than 10
methods in November 2012 and stayed as it was
throughout the entire timeline.
Knowing that ‘‘TopologyImpl.java’’
presents characteristics that, according to the user,
might represent a TD in the project being analyzed,
he can further investigate the changes that happened
until that file became the way it is. The Detailed
View feature allows the user to select the mentioned
file and strategically set the interval to be from
August 2012 to August 2013. A line chart displaying
all of the available metrics during the selected period
ICEIS2015-17thInternationalConferenceonEnterpriseInformationSystems
460
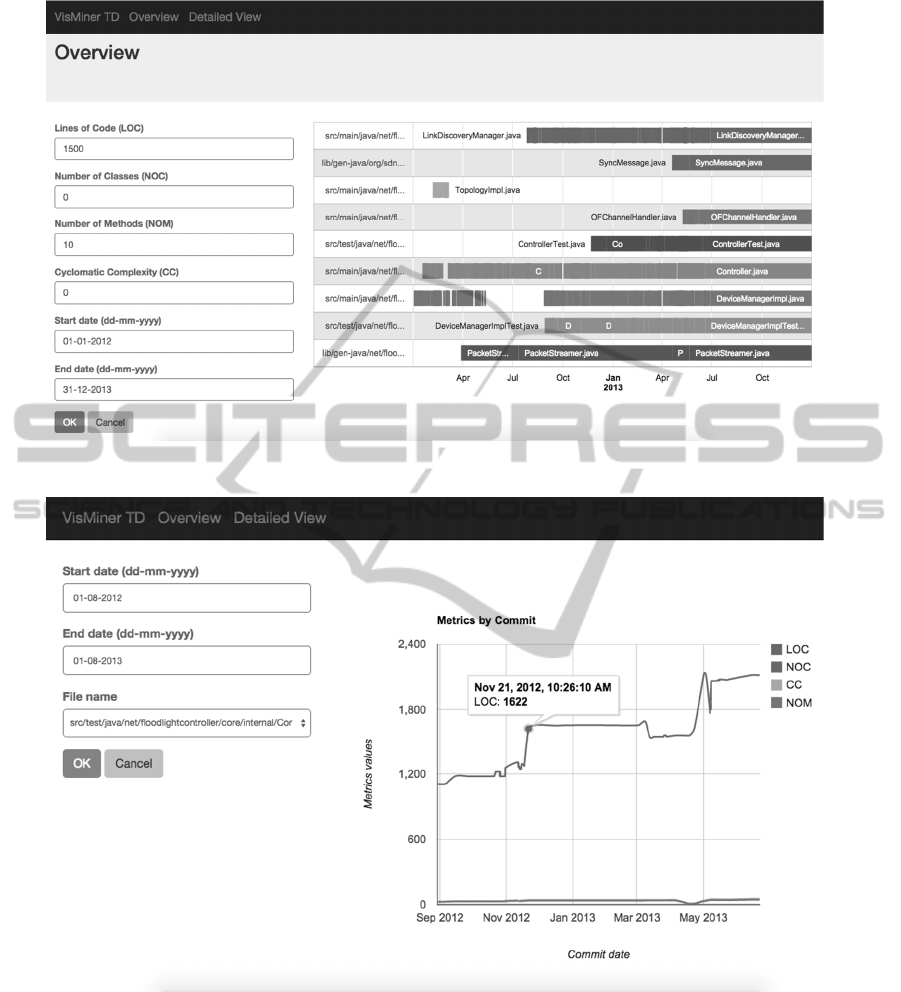
Figure 4: Overview feature.
Figure 5: Detailed View feature.
of time enables the user to have a closer look at each
of the metrics’ values per commit (see Figure 5).
Being used together, the available features give
the user a tool for identifying possible indicators of
TD that might appear during the project. They allow
the user to monitor the appearance and evolution of
TD while making informed decisions about the
appropriate time to pay them.
5 CONCLUSIONS
This paper presented the VisMinerTD. It is an open
source web tool to support the identification and
monitoring of TD in software projects using
software visualization resources. The tool allows
software engineers use the existing metrics and
VisMinerTD-AnOpenSourceTooltoSupporttheMonitoringoftheTechnicalDebtEvolutionusingSoftware
Visualization
461

visual metaphors or create new ones according to
their need.
VisMinerTD still has few metrics and
visualizations ready to be used. As future works, we
intend to create a larger set of metrics and views for
the TD domain. Another important activity is to plan
and perform empirical studies to evaluate the
developed views. In addition, we will improve the
documentation of the project and create a set of
automated unit tests for the main features.
We believe that this tool is an important
contribution for the TD area because it brings a new
perspective to the challenging work of to identifying
and monitoring TD on software projects. Besides,
VisMinerTD can also be easily adapted and
customized by researchers and practitioners to
address their specific needs.
ACKNOWLEDGEMENTS
This work was partially supported by CNPq
Universal 2014 grant 458261/2014-9. The authors
would like to thank the students Felipe Gomes and
Heron Sanches that is helping us with the
development of VisMinerTD.
REFERENCES
Alves, N. S. R., Ribeiro, L. F., Caires, V.; Mendes, T. S.,
Spínola, R.O., 2014. Towards an Ontology of Terms
on Technical Debt. In Sixth International Workshop
on Managing Technical Debt, Victoria, British
Columbia. Canada. DOI: 10.1109/MTD.2014.9.
Chen, C., 2004. Information Visualization - Beyond the
Horizon, 2
nd
edition. Springer Verlag, Berlin,
Heidelberg, New York.
D3.js, 2015. Available in http://d3js.org.
Diehl S., 2007. Software Visualization: Visualizing the
Structure, Behaviour, and Evolution of Software.
Springer-Verlag, New York, Inc.
Fjeldstad, R., Hamlen, W., 1983. Application program
maintenance: Report to our respondents. Tutorial on
Software Maintenance, Parikh, G. & Zvegintzov, N.
(Eds.). IEEE Computer Soc. Press., pp. 13–27.
Guo, Y., Spínola, R.O., Seaman, C., 2014. Exploring the
costs of technical debt management - a case study.
Empirical Software Engineering Journal, v.1, p.1 - 24.
DOI:10.1007/s10664-014-9351-7.
Google Chart Tools, 2015. Available in
https://developers.google.com/chart.
High Charts, 2015. Available in
http://www.highcharts.com.
Izurieta, C.; Vetro, A.; Zazworka, N.; Cai, Y.; Seaman, C.
& Shull, F. 2012, Organizing the technical debt
landscape, In Third International Workshop on
Managing Technical Debt, pp. 23-26.
JGit, 2015. Available in http://www.jgit.org/.
Kohsuke, 2015.Available in http://github-api.kohsuke.org.
Kruchten, P., Nord, R. L., Ozkaya, I., 2012. Technical
Debt: From Metaphor to Theory and Practice, In IEEE
Software, Published by the IEEE Computer Society.
Lehman, M. M., Belady, L. A., 1985. Eds., Program
evolution: processes of software change. Academic
Press Professional, Inc.
Lientz, P., Swanson, E.B., Tompkins, G.E., 1978.
Characteristics of Application Software Maintenance.
Communications of the ACM, vol. 21, p. 6.
Novais, R., Nunes, C., Lima, C., Cirilo, E., Dantas, F.,
Garcia, A.; Mendonca, M., 2012. On the proactive and
interactive visualization for feature evolution
comprehension: An industrial investigation, In 34th
International Conference on Software Engineering
(ICSE), pp.1044,1053.
Novais, R. L., Torres, A., Mendes T. S., Mendonca, M.
Zazworka, N., 2013. Software evolution visualization:
A systematic mapping study. IST, 55(11):1860 – 1883.
Novais, R. L., Nunes, C., Garcia, A., Mendonca, M.,
2013b. SourceMiner Evolution: A Tool for Supporting
Feature Evolution Comprehension, In 29th IEEE
International Conference on Software Maintenance
(ICSM), pp.508,511, 22-28.
Parnas, D. L., 1994. Software Aging. In 16th International
Conference on Software Engineering, Sorrento, Italy.
Seaman, C., Guo, Y., 2011. Measuring and Monitoring
Technical Debt. Advances in Computers 82, pp. 25-46.
Spínola, R. O., Zazworka, N., Vetro, A., Seaman, C.,
Shull, F., 2013. Investigating Technical Debt Folklore.
In Fourth International Workshop on Managing
Technical Debt, San Francisco. DOI:
10.1109/MTD.2013.6608671.
Storey, M. D., Čubrani
ć, D., German, D. M., 2005. On the
use of visualization to support awareness of human
activities in software development: a survey and a
framework. In ACM Symposium on Software
Visualization. ACM, New York, pp. 193-202.
VisMiner Site, 2015. Available in
http://visminer.wordpress.com.
VisMiner Wiki, 2015. Available in
http://github.com/visminer/Visminer/wiki/Installation.
VisMinerTD GIT repository, 2015. Available in
https://github.com/visminer/.
Zazworka, N., Spínola, R. O., Vetró, A., Shull, F.,
Seaman, C., 2013. A Case Study on Effectively
Identifying Technical Debt. In 17th International
Conference on Evaluation and Assessment in Software
Engineering, Porto de Galinhas. DOI:
10.1145/2460999.2461005.
ICEIS2015-17thInternationalConferenceonEnterpriseInformationSystems
462
